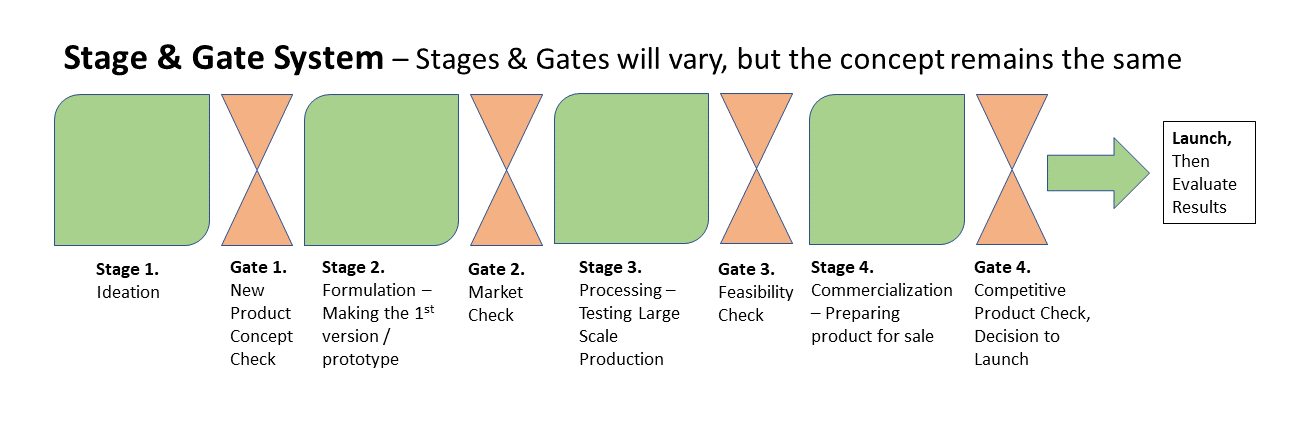
Iowa State University Digital Press
Ames, Iowa
Food Product Development Lab Manual by Kate Gilbert and Ken Prusa is licensed under a Creative Commons Attribution-NonCommercial-ShareAlike 4.0 International License, except where otherwise noted.
Suggested citation: Gilbert, K. & Prusa, K. (2021). Food product development. Ames, IA: Iowa State University Digital Press. DOI: https://doi.org/10.31274/isudp.2021.66
Published by the Iowa State University Digital Press, a division of the University Library at Iowa State University.
701 Morrill Rd, Ames, IA 50011, USA
E-mail: digipress@iastate.edu
1
Before using this lab manual, it is helpful to know a bit about the origins and goals of the content. Ken Prusa has been teaching food product development at Iowa State University for over 20 years, building the foundation and layout of the course over time. The course meets 7 hours each week, split between two afternoon sessions. A short amount of time is used for announcements and reminders. The remainder of the time is used for teams to work in the lab and develop their product. Teams of three or four students develop a new food product working through formulation, processing, and commercialization sections throughout the course. Teams present to an industry board at the end of the formulation and commercialization sections. Kate Gilbert joined Ken five years ago and has slowly added content for the course.
One of the goals of adding instructions, explanations, and examples for the course has been to let student teams be as resourceful and independent as possible. With limited instructors for a large lab-based course, it is important to eliminate answering the easy and repetitive questions and focus on guiding students while they problem-solve through the more complicated, project-specific challenges. The second goal is related to the first and is to push the boundaries of what students can accomplish in a one-semester 3-credit course. Each team develops a product from start to finish, but there is potential to increase the number and depth of components that can be researched. The more efficient student teams can be (with added instructions and resources), the more can be accomplished and a more real-world experience will be achieved.
In addition to this lab manual, this product development course includes video lectures, scenarios, and questions to check student understanding. It is set up in a pseudo flipped classroom approach. Students view content and answer questions before working through the corresponding tasks in class. The lab manual reinforces the content students learned outside of class and acts as a guide for the students while working in class.
There are a few reasons that we chose an OER instead of a published book. One reason is that we have received resources, methods, and suggestions from industry members that we have incorporated into the course and course content over time. While we have added our knowledge and developed the content, we do not feel like it belongs to just us. We recognize and appreciate that building this course has been a supported effort and we want to thank all of the industry members who have shared their time, knowledge, and resources with us. Another reason that we chose OER is the format of the material. We refer to this book as a lab manual because we want it to be actively used throughout the development process. The content includes some background context but is written with direct and practical instructions as the main focus. The last reason is that we know each product development course is set up a bit differently. It is most useful to have materials that can be adapted to fit the needs of each individual course and an OER makes that possible.
Ken Prusa received his Ph.D. in Food and Nutrition from Kansas State University, spent two years at the University of Missouri in Columbia, and then joined the faculty at Iowa State University in 1985. Ken is a Professor of Food Science and Human Nutrition and is Professor-in-Charge of the Sensory Evaluation Center. He works closely with the food industry in new product development and product quality optimization through sensory testing. Ken helped develop the course FSHN 412, Food Product Development, at Iowa State into what we believe is the best experience possible for our students entering food-related careers.
Kate Gilbert is an alumnus of the food product development course, graduating with a Bachelor of Science in Food Science in 2007. She worked in technical services and research for the Grain Processing Corporation and completed a Masters in Food Science from Kansas State University before returning to teach at Iowa State University in the fall of 2014. Kate transitioned from industry to academia because she wanted to share real-world experiences with students to better prepare them for their careers. Her approach to teaching is to meet students where they are, connect new information to what they already know, and then allow them to understand and apply that information. In addition to teaching a variety of courses, she coordinates internship opportunities, advises the Food Science Club, and is active in the Iowa Section of the Institute of Food Technologists.
In addition to contributions from food industry members, we would also like to thank Abbey Elder for all her help with the OER Grant process and answering all our questions along the way, Derek Schweiger for reviewing first drafts of content and finding great references, and Sarah Gilbert for diligently editing the whole manual.
I
Jump into product development by learning the basic process, roles involved, and typical timelines.
1
At each stage, or even within the stages, there are checkpoints to decide to continue or stop the project. This can be done through a Stage and Gate System like the example shown here or it can be done in a modified system. The principle is the same, though, to develop new products strategically and use time and resources wisely.
Typically this Stage and Gate process works like a funnel. You may start with 12 to 15 ideas and then research and evaluate those ideas. Some ideas will get discarded because you will find the product concept already exists. Others will get discarded because the ingredients or processing will cost more than what consumers are willing to pay (based on products in the relevant category). Some ideas will seem great, but will be too niche and will not have a large enough target audience to be successful. Once the ideas have been narrowed down, the best 3 to 5 ideas may be moved to the Formulation stage. In this stage, the product will be made on a small scale and consumer testing will be done to confirm interest. Then products will go through the second gate to determine which products have enough consumer interest to continue. During the Processing stage, 2 to 3 products are scaled up on larger equipment. This helps determine production costs and efficiency. Food safety and quality testing also are done to determine how to produce a safe and consistent product. Shelf-life testing is conducted at the end of the Processing stage to make sure the product will remain at an acceptable and safe quality long enough for the product to made, shipped, purchased, and consumed. The third gate evaluates production, food safety, quality, and shelf life to decide which products can actually be made efficiently and consistently. The Commercialization stage includes work to get the product ready to sell on the grocery store shelves. Typically this includes the final costing, additional consumer sensory testing, and package design. The final gate makes sure that no errors or significant drawbacks have been missed before the product is launched. Through the Stage and Gate process, 12 to 15 ideas may get narrowed down to 1 or 2 products. The Stage and Gate process allows many ideas to be considered efficiently. The more viable the idea, the more time and work is needed. When an obstacle is found at a gate, no more time or resources are committed to that idea.
Each company may work through the stages of product development a bit differently depending on resources, timelines, and product types being developed. In a product development course, a product is likely developed from start to finish, so more market, consumer, and product research will need to be done during the ideation stage to catch significant drawbacks.
Often the most difficult part of product development is coming up with the initial idea. Many food products exist in the marketplace, so coming up with a new food product that does not exist and consumers are interested in buying can be a challenge. It is best to simply jump in and start generating ideas. From there, concepts can be refined and narrowed down. Ideas can come from a variety of sources. Some ideas are for a brand-new product and some are for a line extension of an existing product. Once ideas have been generated, it is important to identify the target customer. Trends are followed closely to determine what is new and upcoming. Trends often spark ideas for new products. Trends change over time, so it is difficult to list current examples, but convenience products, comfort foods, and plant-based foods have been trending over the last few years.
Some issues with ideation include regional vs. global preferences and market size vs. target market. Flavors that are commonly known and liked in the Midwest may not sell well in other parts of the country. Consumers outside of the Midwest may not like those flavors or may simply be unfamiliar with the flavors. If your target market is a small part of a product category and the product category itself is small, there may not be a large enough market share for your product. It also can be a challenge to realize that just because you like something, many others may not. We tend to develop products we like, but sometimes you may have to develop a product for a target audience that does not include you.
Processing Key Questions:
Commercialization Key Questions:
After the launch of a new product:
It takes many roles to develop a new food product. A product development team can be very successful with all members contributing an expertise. The challenge is communicating effectively to make sure everyone is on the same page with the status and goals of the project. Key team members include product development, engineering, production, purchasing, quality, regulatory, marketing, sales, and upper management. Their typical roles are laid out below.
It is important to be able to ideate openly & creatively. However, ask yourself, “Does the product already exist?” and “What are our company’s new idea limitations?”. Below are common limitations for product development courses:
2
It is difficult to fit the whole product development process into a semester course, but the goal is to make the experience as real-world as possible while fitting in as much of the development process as possible. All components will be explained further in additional chapters. In general, though, each section of the course is described below. The semester is split fairly evenly between the three sections. It is important to hit the ground running in this course!
During this period your team will be responsible for ideating and selecting a formula for a new food product, determining consumer expectations, producing a gold standard, and evaluating your product through consumer and instrumental testing. At the end of this section, your team will have a gold standard product that will be able to be converted into a processable formula. A Formulation Board of Directors meeting will be scheduled for the end of the Formulation section.
During this period your team will be responsible for perfecting your processable formula made with industrial ingredients. You will scale up your formula in the laboratory and under plant conditions as applicable. Your team will be involved with processing and process development, food safety analysis, and measuring quality attributes.
During this final period, your team will address issues including consumer acceptance and instrumental testing of your product from your scaled-up process, shelf-life testing, nutritional labeling, and final package and label design. You will present your product and final shelf-ready package to the Board of Directors at the end of this section and will also share your new product with the department.
II
In order to be successful in product development, this course, plus your careers moving forward, there are a number of skills that are important to use and work to improve. This Required Skills section will cover creativity, resourcefulness, communication, teamwork, attention to detail, and best practices for product development.
3
Some of us are naturally creative. For others of us, it takes some work. Either way is okay as long as you are willing to work on your creative skills.
To start, let’s consider the definition of create:
Think about creativity in terms of looking at a problem or situation and thinking of all of the ways to solve the problem or move a situation forward. It may include thinking “outside the box” or asking questions that start in “what if” or “why not”. Use your imagination, too. Creativity is often a mix of dreaming and using logical thought to make the dream a reality.
If creativity does not come naturally to you, that is okay. Here are a couple of techniques that can help.
“Developed by Tony Buzan in 1972, mindmapping is a visual ideation technique that encourages you to draw connections between different sets of ideas or information. You’ll start by writing a keyword in the middle of the page (this could be a product category or the start of an idea). On the same piece of paper, you then surround this word with any and all ideas that come to mind (different flavors, forms, trends). Finally, you’ll think about how these ideas are connected, depicting said connections with lines and curves—resulting in a visual map.” (Stevens, 2020)
SCAMPER is a checklist that helps you to think of changes you can make to an existing product or solution to create a new one. This can be done in a list or table form. Developed by Bob Eberle (1996), the changes SCAMPER stands for are:
S – Substitute – components, ingredients, packaging size/materials, people (people could be the target audience).
C – Combine – mix, combine with other assemblies or food types, integrate.
A – Adapt – alter, change function or use, use part of another element.
M – Modify – increase or reduce in scale, change shape, modify attributes (e.g. color, flavor).
P – Put to another use (e.g. breakfast foods as snacks).
E – Eliminate – remove elements, simplify, reduce to the simplest component.
R – Reverse/Rearrange – turn inside out or upside down, or reverse the use of the food (soup in a sandwich, cheese inside a pretzel, etc.).
Start with a product category or specific product and then work through the SCAMPER list to see what possible products emerge. This method may be more effective for line extensions (think Starburst jelly beans or Reese’s peanut butter cups in holiday shapes), but it can also help with brand new product ideas. Almost all new food products come from a food/flavor/format that consumers already know and buy (otherwise it is hard to explain what the new product is). Examples of using SCAMPER are available online.
4
We do not spend enough time discussing resourcefulness, but we would argue that resourcefulness is one of the most important skills you can possess and use in this course and moving forward in your career. It is okay if you do not remember everything you ever learned; it is more important you can find and understand the information you need to successfully move a project forward.
Merriam-Webster defines resourcefulness as “able to meet situations, capable of devising ways and means.”
We would take that definition a step further and define resourcefulness as the ability to use instructions, examples, and given resources, plus search additional references as needed, to determine how to proceed with a project and solve problems that arise. This lab manual and additional references will allow you and your team to work through the product development process predominately independently. Faculty will be available to answer questions specific to your team’s product and project, but will not answer questions that can easily be found in provided references. The goal is to optimize time management, increase efficiency, and give you the power and ability to develop a new food product as a team. There are many different ways to be resourceful, but using this skill typically begins by asking yourself “How could I figure this out?” or “Where could I find a reference with that information?”
5
1. It is the student’s responsibility to submit assignments on time—points will be deducted from late assignments unless the student has communicated with faculty before the deadline.
2. Weekly reports and strategic objective reports should be written in complete sentences that are grammatically correct and free of spelling and typographical errors. You are expected to write clear and concise statements that express logical thinking and demonstrate professional quality and effort. If there are errors in your writing, it is easy to assume there are errors in your food science work, even if that is not the case.
3. Formatting of reports needs to be considered. Use headers and titles to make the components of the report easy to find and read. You are highly encouraged to follow the layout and order of report components given in the instructions.
4. Team reports should be edited for consistency among writers, at least enough that it is not obvious when a new writer starts. Make sure to use consistent terminology and have a team consensus on the results of the project.
5. Figure out what works best for you to produce professional written communication.
Some recommended practices include:
6
You are asked to work in teams often, so you are used to the idea. However, it is worth taking a step back and thinking about how best to work in a team.
What is the best team you have been a part of and why?
Think about how you can be a good team member. This can be in general and also based on your strengths. Communicating, active listening, resolving conflict, setting and meeting expectations, motivating others, staying organized and on task, and working with your team to reach a consensus are all beneficial attributes to bring to a team. Discuss best practices and expectations together as a team before you start your project. Being a good team member is not just about your intentions; it is also how you are perceived. Peer evaluations will be used to provide feedback and improve teamwork.
Babe Ruth said it well, “The way a team plays as a whole determines its success. You may have the greatest bunch of individual stars in the world, but if they don’t play together, the club won’t be worth a dime.”
Check out the team-building pyramid below adapted from Grow (2011). In order to build an effective and strong team, it is important to start from the bottom with vision, expectations, and then connectivity. Once a foundation has been laid, trust can be built and problem-solving can start. Too often teams start at the top. It is difficult to effectively communicate and make decisions if team members are not on the same page in terms of vision and expectations and have not built trust with each other.
Forming and maintaining an effective and successful team takes work. One of the challenges is how to allocate time and resources to balance getting things done and keeping the team cohesive and working well together. Below is an illustration of this challenge from Grow (2011) . It is a good idea to keep this balance in mind throughout the project. At times the scale may tip one way or the other, but it is important to keep both the project and team in mind as decisions are made.
7
Whether a project succeeds or fails is often in the details. Make sure to slow down and pay attention to the little things, plus record detailed observations in the lab notebook. Small changes in ingredients or processing steps can change the final product. If you think there may be a small problem with your project, make sure to discuss it. Small problems have a tendency to turn into larger problems down the line.
It is important to keep an accurate and legal lab notebook during the product development process. The format to follow is listed below.
8
Lab procedures have been modeled after typical plant GMPs. We will work under GMPs at all times. Do not be surprised by unannounced inspections. You will lose points for GMP violations. Products made not following GMPs will be tagged and possibly discarded.
III
Formulation will be the first section of the course and product development process. During this period your team will be responsible for testing to determine a gold standard formula for your new food product concept, determining consumer expectations, and evaluating your product through consumer and instrumental testing. At the end of this section, your team will have a standard product that will be able to be converted into a processable formula. A Formulation Board of Directors meeting will be scheduled for the end of the Formulation section.
9
It can be difficult to come up with a great new product idea right away. It is easier to work through a few steps, thinking about what is new and of interest to consumers throughout the process.
To get started coming up with a new product concept, it is important to understand current trends and the target markets for those trends. Search for and read through various trend materials. You are encouraged to do your own searching. Take notes on what trends are new flavors, new combinations of existing products (think Starburst jelly beans), new ingredients, and completely new products. This will be a good start in the brainstorming process.
It can be difficult to come up with the best new food product idea in a short amount of time, especially while in a new team. Great ideas take time. Starting to think about new ideas ahead of time will make deciding on a new food product concept easier.
Spend some time thinking about the trends you researched, the food you know and are interested in, and the food products you would like to buy in the grocery store but are currently unavailable. Then give ideation a try and come up with at least two new food concepts. You will not be tied to these ideas and you can continue to think about new ideas, but this will give you a couple of places to start.
10
Name:
Food Allergies/Intolerances:
Favorite 3 foods/beverages:
Favorite 2-3 foods/beverages you like making at home, describe as necessary:
One new food/beverage you have tried recently – describe it, where did you have it, would you have it again?
At least one food or beverage you wish was available in the grocery store now:
List four or five trends, why you find each trend interesting, and the source of each trend (a link is fine):
1.
2.
3.
4.
5.
Describe 2 new product ideas in detail.
New Product Idea #1.
New Product Idea #2.
11
Once you have a new product concept or two, dig into the market and grocery store research further. Some trend articles include market research such as how big a market is in terms of sales or who is the target audience of a trend. Use all of the information that is available. Do additional research as needed to answer the questions on the Market and Grocery Research worksheet.
It can be difficult to think about all aspects of market research, so it is helpful to break it down into segments. As research is done, the goal is to hone in and improve your new product concept.
Typically an internet search is a good place to start. Look for food business articles that include market data. It may take a bit of time to find what you are looking for, but it is worth being diligent.
To start:
To help in determining sales volumes and segment size, the below reference was created by experts in the grocery sales field in 2020. Use these indicators to evaluate the potential for a new food product.
Market Segment/Product Category | Size of Segment/ Sales Volume | Average Mark-Up Including Promotion | Product Turnover |
Cereal | 5 | 3 | 5 |
Chip/Snack | 5 | 3 | 5 |
Cookie/Crackers | 3 | 3 | 3 |
Granola Bars/Mixes | 3 | 3 | 2 |
Candy | 4 | 3 | 3 |
Prepackaged Baked Goods | 1 | 3 | 2 |
RTE Desserts/Puddings | 2 | 3 | 1 |
Bakery Dry Mix | 3 | 3 | 4 |
Fruit Snacks | 1 | 3 | 2 |
Peanut Butter & Jelly | 3 | 3 | 3 |
Salsas/Pickles/Dips | 3 | 4 | 2 |
Sauces/Dressings/Condiments | 4 | 3 | 2 |
Soups – Canned & Dry Mix | 3 | 2 | 4 |
Pasta, Boxed Dinners | 3 | 4 | 3 |
Refrigerated Sides & Salads | 3 | 3 | 3 |
Frozen Appetizers & Entrees | 4 | 4 | 3 |
Frozen Breakfast | 2 | 3 | 2 |
Yogurt | 4 | 3 | 5 |
Ice Cream | 5 | 2 | 5 |
Processed Meats/Deli Meats | 4 | 3 | 5 |
Fresh Meats | 5 | 2 | 5 |
Poultry | 3 | 3 | 4 |
Fish | 2 | 3 | 3 |
Tea/Coffee | 5 | 3 | 4 |
Soda | 5 | Not able to provide | 5 |
Juice | 3 | 3 | 3 |
Waters | 5 | 3 | 5 |
International Cuisine | 2 | 4 | 1 |
Gluten-Free Prepared Foods | 1 | 3 | 1 |
All grocery stores are laid out a little differently, but it is good to think about general layouts of grocery stores and where your new product would fit in the store.
Think about how items are placed in the grocery store. What does the grocer want the customer to do while in the store? It is greatly encouraged to visit local grocery stores. Often the in-person research will be more valuable than online research. If possible, visit 2 to 3 grocery stores or stores with a large grocery section. Typically, visiting at least one mainstream/large grocery store and one specialty grocery store is recommended to provide multiple perspectives and show the breadth of products and categories.
12
1. Please provide a brief description of your new product concept or concepts. Try to limit your team’s plans to not more than two ideas. The faster you decide on a single new product concept, the quicker you can get started with formulation. If you do want to pursue two ideas, you will need to provide market research on both.
2. What unique ingredients will you need, if any?
3. Will any of the ingredients be cost-prohibitive?
4. What unique equipment will you need for processing?
5. Any allergens of concern?
6. Any nutritional compositional concerns (fat, cholesterol, sodium, sugar, etc.)?
7. How will your new product concept fit with current trends? Does your new product concept fit a gap in the market? Please explain how your idea will be defendable based on consumer selling points.
8. What have you found in market research in terms of market size, sales, and growth?
9. Who is your target audience and why (be specific)?
10. What are your direct competitors?
11. What are your indirect competitors?
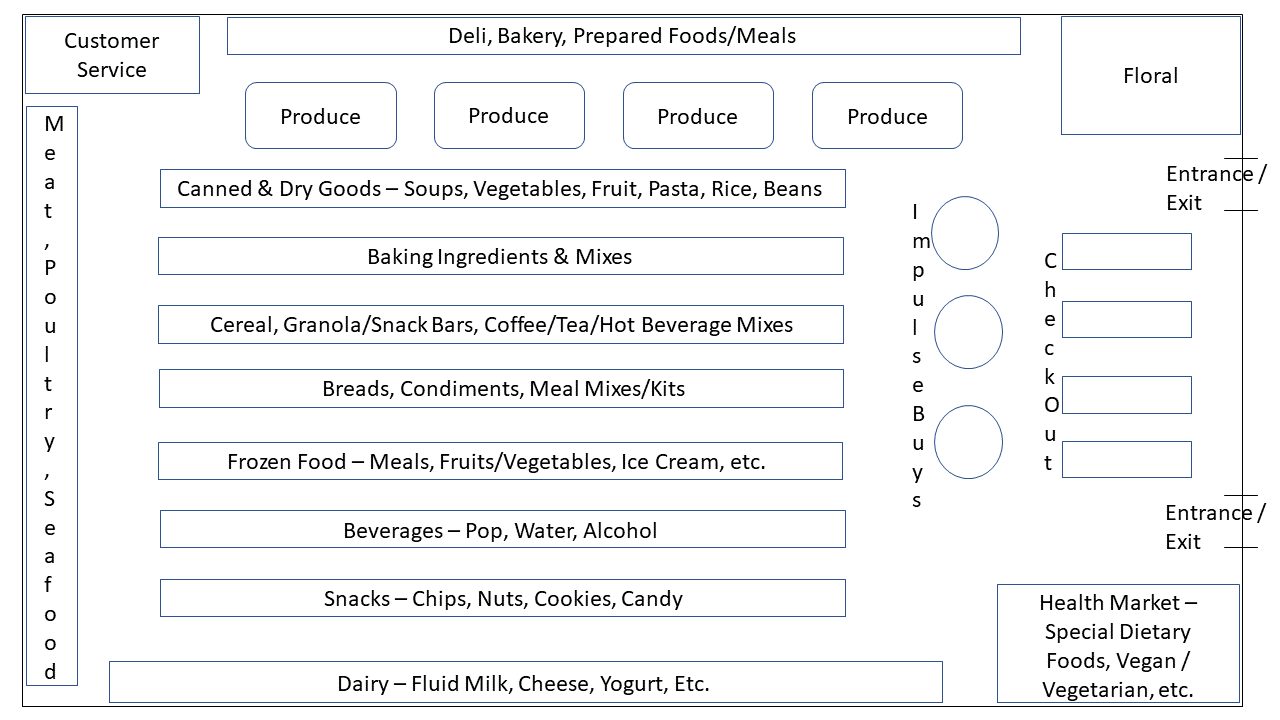
12. Before you conduct grocery store research, where do you think your new product be found in the grocery store (what aisle, with what products)?
Once the new product has been discussed with faculty, make a trip to one or two grocery stores to conduct research. In-person research is the best when possible. Online research is also valuable, especially in terms of finding regional products.
13. First, look in the grocery store location you envision your new product being sold and fill out the table below with the products you find. Be specific – include brands, flavors, sizes of containers, and prices. Taking photos of products can be very helpful.
Grocery Store: | Location in Store: | ||||
Brand | Flavor | Description | Size | Price | Additional Information |
Grocery Store: | Location in Store: | ||||
Brand | Flavor | Description | Size | Price | Additional Information |
Grocery Store: | Location in Store: | ||||
Brand | Flavor | Description | Size | Price | Additional Information |
Internet Site: | Location in Store: | ||||
Brand | Flavor | Description | Size | Price | Additional Information |
Internet Site: | Location in Store: | ||||
Brand | Flavor | Description | Size | Price | Additional Information |
14. Next look in other grocery store areas you think similar products could be found. Add a new location to the table and describe products you find in other pertinent parts of the grocery store.
15. Search the internet for similar products and add them to the table above. Then answer the following questions.
16. Did you find your product concept or something similar? If so, describe it and include the location.
17. After looking at various grocery store locations, does your product placement still make sense? If not, where would the new product placement be? Explain your answer.
18. Does the product category appear small, crowded, or somewhere in between? Justify your answer.
19. Does the product category appear inexpensive, varied, or premium? Explain your answer.
20. What else did you learn while conducting research in the grocery store and on the internet?
21. How does what you learned from the grocery store research modify your new product concept? Explain your answer in detail.
13
After you have come up with what you think is the best new food product concept, it is valuable to gather consumer data to confirm the brilliance of your idea and provide feedback to hone in your new product concept. Check out this chapter to learn how to write your own consumer concept test.
Numerous sensory tests are used in the development of new food products. These include Consumer Concept Tests, Attribute Tests (JAR Tests), Simple Difference Tests, and Home-Use Tests (HUT). Consumer Concept Tests gather information on consumer attitudes, likes and dislikes, trends, and consumer reactions to your proposed new product idea. Essentially, it is a way to find out if consumers like your new product concept plus get feedback on concept details.
14
It can be daunting to figure out where to start when taking a new product concept and making it a reality. Your team will need to be smart and use educated reasoning to maximize limited time and resources. This chapter will walk you through the process and help get you started.
First, review the formula and think about the function of each of the ingredients. Sometimes functions can be confusing. If this is the case, consider how the pancake would turn out without the ingredient added.
Pancake Ingredients | Percent by Weight | Ingredient Function |
All-purpose Flour | 30.8 | Gluten Structure (Minimal), Starch Gelatinization |
Baking Powder | 2.5 | Leavening |
Sugar | 2.1 | Sweetness, Tenderizing (Minimal), Maillard Browning |
Salt | 1.0 | Taste |
Milk, 2% | 52.7 | Hydrate Dry Ingredients, Flavor |
Egg | 8.5 | Hydrate Dry Ingredients, Structure, Maillard Browning |
Oil | 2.4 | Tenderizing, Flavor (Minimal) |
Total | 100.0 |
Now compare addition and substitution methods of adding fiber to the formula. The goal in this scenario is to add fiber to the recipe to get an excellent source of fiber per serving: (5.6 grams / 110 gram serving). Note that for simplicity we are assuming the fiber ingredient is 100% fiber. This is not normally the case but works best here to illustrate differences.
Option 1 – Addition (makes sense if the ingredient function is different than other ingredients already in the formula) | Option 2 – Substitution from similar ingredient(s) (makes sense if the ingredient is similar to another ingredient already in the formula) | |||
Pancake Ingredients | Weight (in grams) | Percent by Weight | Weight (in grams) | Percent by Weight |
All-purpose flour | 180.0 | 29.2 | 149.2 | 25.5 |
Fiber Ingredient | 31.4 | 5.1 | 29.8 | 5.1 |
Baking Powder | 14.4 | 2.3 | 14.4 | 2.5 |
Sugar | 12.0 | 1.9 | 12.0 | 2.1 |
Salt | 6.0 | 1.0 | 6.0 | 1.0 |
Milk, 2% | 309.0 | 50.1 | 309.0 | 52.8 |
Egg | 50.0 | 8.1 | 50.0 | 8.6 |
Oil | 14.0 | 2.3 | 14.0 | 2.4 |
Total | 616.8 | 100.0 | 584.4 | 100.0 |
In this scenario, deciding between addition and substitution will likely center around the fiber ingredient characteristics. If it is a fiber ingredient like wheat bran or oat bran, the fiber ingredient will function similarly enough to flour for substitution to make the most sense. If the fiber is soluble with low viscosity like inulin or resistant maltodextrin, the fiber ingredient does not have similar functionality to the ingredients listed and addition may make more sense.
15
After working through the material balance example in the previous chapter, you may be wondering why we care about tracking moisture through a process. There are a few reasons why, although tedious, tracking moisture is important.
Here is an example of tracking the moisture content of ingredients in order to convert from liquid ingredients to dry ingredients. Whenever you are doing formula calculations, it is very important to think through what you know and what you are trying to find. You may need to write it out or draw a picture to help yourself. Then use logic and stop and ask yourself “does that make sense” along the way. For this example, you may want to open your own Excel file and/or write out the calculations to think through the steps. Your layout may look a bit different than what is shown in Tables 1 and 2 and that is okay. Take it slow and make sure you understand each step along the way.
What you know (or can find out):
What you want (need) to know:
Logic and checkpoints – If you take the water out of the ingredient, you will need less of the dry ingredient.
There are a few ways to calculate a conversion from wet or fully-hydrated ingredients to dry ingredients. Here is an example of converting an omelet formula with fresh/wet ingredients to dry ingredients plus water.
Fresh Ingredients Formulation | |||||
---|---|---|---|---|---|
Ingredients | Batch in grams | % by Weight | Water Content % | Water Content in grams | Dry Weight in grams |
Egg | 150.0 | 60.0 | 75.8 | 113.7 | 36.3 |
Cheddar Cheese | 50.0 | 20.0 | 41.1 | 20.5 | 29.5 |
Skim Milk | 50.0 | 20.0 | 89.0 | 44.5 | 5.5 |
Total | 250.0 | 100.0 | n/a | 178.7 | n/a |
Converting to Dry Ingredients | |||||
---|---|---|---|---|---|
Ingredients | Batch in grams | % by Weight | Water Content % | Water Content in grams | Dry Weight % |
Dried whole egg powder | 40.3 | 16.1 | 10 | 4.0 | 90 |
Dried shredded cheese | 31.0 | 12.4 | 5 | 1.6 | 95 |
Nonfat dry milk | 6.1 | 2.4 | 10 | 0.6 | 90 |
Water | 172.5 | 69.0 | 100 | 0 | |
Total | 250.0 | 100.0 | n/a | 6.2 | n/a |
1. Fill out the batch weights and % by weight for your current formula.
2. Water or moisture content of each food can be found in the USDA food database, calculated from an ingredient Nutrition Facts Panel, or from an ingredient specification sheet. (If water is not listed, take the total grams & subtract fat, protein, & carbohydrates to find the water content in grams.)
3. Water content in grams = batch weight x water content %
4. Dry weight in grams = batch weight in grams – water content in grams
5. Convert to dry ingredients or to ingredients with a lower moisture content.
6. List new ingredients & find water content percent for each new ingredient.
7. Find the Dry Weight % for each ingredient = 100% – Water Content %
8. To find the new batch weights in grams, take the dry weight in grams of the original formula & divide by the dry weight % of the new formula.
9. Then find the water content in grams by multiplying the batch weight in grams by the water content %.
10. Find the sum of the water contents in grams. Then subtract the total from the water content in grams from the original formula.
178.7 grams total water minus 6.2 grams water from dry ingredients equals 172.5 grams water
11. Take the difference in water content and add that amount in grams of water to the new formula*.
12. Finish filling out the new formula % by weight and check your work.
*If the original formula contains more or less water than desired, it is okay to adjust the water level and overall moisture content.
Not all food products will need to track fat content changes, but it is still helpful to understand the process. The main application is for frying food. The other instance where tracking fat content is important is if meat is cooked and fat is rendered from the meat (think frying bacon or cooking ground beef or pork and skimming fat from the cooked meat). The importance of tracking fat changes is similar to that of tracking moisture changes. It explains what is happening through the processing steps and is also important for generating an accurate Nutrition Facts Panel in Genesis.
The example given here is for frying french fries. The difficult thing about tracking fat content through frying is that moisture is lost at the same time fat or oil is picked up.
Whenever you are doing formula calculations, it is very important to think through what you know and what you are trying to find. You may need to write it out or draw a picture to help yourself. Then use logic and stop and ask yourself “does that make sense” along the way. For this example, you may want to open your own Excel file and/or write out the calculations to think through the steps. Your layout may look a bit different than what is shown and that is okay. Take it slow and make sure you understand each step along the way.
Data Needed | Percent by Weight | Weight in Grams |
Moisture Content Before Frying – This can be determined by moisture content in the formula (calculated in an Excel file or on Genesis) and/or by measuring moisture content on the moisture balance. | ||
Moisture Content After Frying – This can be determined by measuring moisture content on the moisture balance and/or it can be calculated by fat content pickup weight lost through frying. | ||
Moisture Lost During Frying – Calculated by subtracting the moisture content after frying from the moisture content before frying | ||
Weight Before Frying (for the whole batch) – This can be determined by measuring the weights of a set amount of pieces or the whole batch. If the whole batch is used, account for processing loss (batter lost in the bowl, etc.). | ||
Weight After Frying (for the whole batch) – Again, this can be determined by measuring the weights of a set amount of pieces or the whole batch. If the whole batch is used, account for processing loss (batter lost in the bowl, etc.). Make sure the product has cooled before weighing. | ||
Weight Difference from Frying** (for the whole batch) Calculated by subtracting the weight after frying from the weight before frying | ||
Oil Pick Up = Moisture Lost During Frying – Weight Difference from Frying |
Data Needed | Percent by Weight | Weight in Grams |
Moisture Content Before Frying – USDA Food Database | 83.29% | 166.6 |
Moisture Content After Frying (measured by moisture balance) | 66.67% | 133.3 |
Moisture Lost During Frying | 16.63% | 33.3 |
Weight Before Frying (able to measure the whole batch for this example) | 100.00% | 200.0 |
Weight After Frying (able to measure the whole batch for this example) | 91.70% | 183.4 |
Weight Difference from Frying** | 8.30% | 16.6 |
Oil Pick Up = Moisture Lost During Frying – Weight Difference from Frying | 8.33% | 16.7 |
Your product may not calculate perfectly like the example above. Determining the values in multiple ways is a great way to verify the results. Weighing the frying pot and oil in the pot at the beginning and end of frying (after the oil is cooled) is a good way to measure oil pick-up for an entire batch.
**If you measure the weight of part of the batch being fried, use the percent difference X the batch weight to get your total moisture loss in grams.
16
Along with tracking ingredient levels and changes through testing, it is equally important to think about the order of ingredient addition and the function of each processing step.
Think through the processing steps to make a food. What is the function of each step? Does the order of the steps matter? To help answer these questions, think about what would happen if all of the ingredients were mixed together in one step. Need terminology to help describe the process? Check out the Common Processing Steps table below.
Processing Method | Definition | Example(s) |
Baked Products: | ||
Creaming | Mixing fat and sugar together vigorously to create an air-in-fat foam | Shortened Cakes and Cookies |
Beating | Very vigorous agitation of food mixtures using an electric mixer at high speed or a wooden spoon to trap air and/or develop gluten or an emulsion | Shortened Cakes, egg white foams like in Angel Food Cake |
Stirring/moderate mixing | The gentle blending of ingredients when trapping of air and development of gluten are not necessary | Muffins, various quick breads |
Folding | Very gentle manipulation used to bring batter up from the bottom of the mixing bowl while incorporating dry ingredients or another batter, all without releasing air from the foam | Angel food cake, soufflé, chiffon cake |
Cutting In | Process of cutting solid fats (generally mixed with flour) into small pieces using a pastry blender | Biscuits and Pastry |
Kneading | Folding over a ball of dough and pressing it with either the fingertips or the heels of both hands, depending upon the amount of gluten needing to be developed and the ratio of ingredients | Biscuits, Yeast Bread, Pizza Crust |
Size Reduction: | ||
Cutting/Chopping | Reducing the size of an ingredient to medium to small pieces | Fruits, Vegetables, Nuts |
Grinding/Milling | Reducing the size of a typically dry ingredient to a very small piece or powder | Grains, Nuts |
Processing or Blending | Reducing the size and mixing ingredients together, typically with a food processor or blender, to create a liquid or paste | Fruits, Vegetables, Juices, Nuts, Peanuts |
Shaping: | ||
Rolling/Laminating | Flattening a dough to a given thickness, potentially layering dough and fat layers together to laminate for a flaky baked product | Pizza crust, Biscuits, Fondant |
Cutting or Pressing Shapes | Using a set shape to form a dough, could use a cutter, press, or pan | Sugar cookies, Oreos, Tortilla Chips, Potato Chips |
Extruding | Pressing a dough or batter through a tube with a specifically shaped opening | Pasta, Spritz cookies, Sausage & Hot Dogs |
Molding | Using a specific 3-D shape to form a coating and/or dough | Candies with fillings such as peanut butter cups and peppermint patties |
Coating | Adding a layer to the outside of a food; the layer could be made up of dry ingredients, wet ingredients, or a melting coating that will set upon cooling | Cheetos, Peanut Butter Balls, M&Ms |
Mixing: | ||
Hydrating | Mixing of ingredients with the main purpose of water hydrating dry ingredients to get functionality from the dry ingredients | Hydrocolloids, Leavening, Gluten Development |
Shear / High-Speed Mixing / Emulsifying | Mixing of ingredients with the purpose of particle size reduction and/or emulsion formation | Salad Dressings |
Homogenizing | Processing a liquid under pressure with the goal of particle size reduction to inhibit separation | Milk, Beverages |
Water Separation: | ||
Dehydrating | Removal of water from a food, typically slowly using heat and forced air | Fruits & Vegetables |
Centrifuging | Separation of particles based on density, often a liquid separated from a semi-solid | Fruit Purees |
Physical Pressure | Using physical pressure to squeeze out free water, often using cheesecloth | Cheese, Vegetables |
Straining | Using a filter to remove solids from a liquid. The filter size affects the separation and can include cheesecloth and finer filter paper | Apple Cider, Tea, Coffee |
Physical/Chemical Reactions: | ||
Fermentation / Enzyme Reaction | Allowing beneficial bacteria, yeast, or enzymes to convert food through controlled breakdown, production of acid, alcohol, and/or carbon dioxide | Sauer Kraut, Yogurt, Yeast Bread, Soy Sauce |
Protein Coagulation | Adding an enzyme, salt, acid, physical agitation, or heat to cause proteins to change shape and become less soluble | Cheese, Tofu, Egg White Foams, Cooked Eggs, Cooked Meat |
Heating: | ||
Cooking | Heating with a direct heat source, often with a liquid present, typically on the stovetop in a conventional kitchen | Soups, Gravies, Pudding |
Baking | Heating in an oven, typically referring to baked products | Cookies, Brownies, Cake |
Roasting | Heating in an oven, dry heat method | Chicken, Nuts |
Frying | Heating in liquid oil for efficient heat transfer | French Fries, Chicken Nuggets, Funnel Cakes |
Cooling/Freezing: | ||
Refrigerating | Cooling a food product to under 40 degrees Fahrenheit | Various |
Freezing | Cooling a food product to ~ 0 degrees Fahrenheit, converting water to ice in the food, speed of freezing affects product quality | Various |
Next think about where the water is added or removed in the system and what ingredients need to be hydrated to function fully in the food (gums, gluten proteins, leavening, protein powders, etc.).
Once the processing steps have been determined and tested with parameters set (time, temperature, speed, etc.), your team will construct a flow diagram based on the processing steps (not necessarily the equipment). This is helpful as a transition step to processing to determine larger pieces of processing equipment.
As an example, consider the processing steps needed to make a chocolate chip cookie. Here is a typical set of instructions for a chocolate chip cookie recipe modified from Nestle Toll House :
Step 1.
Preheat oven to 375° F.
Step 2.
Combine flour, baking powder, and salt in a small bowl. Beat butter, granulated sugar, and brown sugar in a large mixer bowl until creamy. Beat in eggs and vanilla extract. Gradually add in flour mixture. Stir in chocolate chips. Drop by rounded tablespoon onto ungreased baking sheets.
Step 3.
Bake for 9 to 11 minutes or until golden brown. Cool on baking sheets for 2 minutes; remove to wire racks to cool completely.
Think about the flow diagram that would be constructed from the processing steps for the cookie. Then read through the flow diagram shown below. Do you see how the recipe instructions were converted to a flow diagram? From here, you can construct a flow diagram for your new food product.
17
Generating a Nutrition Facts Panel is a great way to analyze the macronutrient, micronutrient, and calorie content of your new food product. The Genesis software program (and any other Nutrition Facts Panel program) is only as good as the information that is inputted, so it is important to pay attention to detail and be as accurate as possible on ingredient composition, moisture change, and possibly fat change.
18
Numerous sensory tests are used in the development of new food products. These include Consumer Concept Tests, Attribute Tests (JAR Tests), Simple Difference Tests, and Home-Use Tests (HUT). Attribute Tests gather information on the acceptability of individual attributes for optimization of your formula for your new product.
19
Here is an explanation of why we start with grocery store ingredients and then convert them to industrial ingredients. Industrial ingredients are requested from food companies and not purchased from the grocery store. Some industrial ingredients are quite similar to grocery store ingredients. Other industrial ingredients have variations in composition, moisture content, and functionality. It is important to understand the differences and that converting to industrial ingredients takes time and planning.
20
The sooner you submit the worksheet, the quicker industrial ingredients can be sourced.
Current Ingredients | Current Batch Weight (in grams) | Current Percent by Weight | Functionality of Ingredient | Proposed Industrial Ingredient & Source (Company, product name, etc.) |
IV
It is important to acknowledge that there are a variety of components covered in Processing. Those components are not necessarily linear steps and can be grouped into the following categories:
During this period your group will be responsible for perfecting your processable formula. This will include moving to (more) industrial ingredients. You will scale up your formula in the laboratory and under plant conditions. Your group will be involved with processing and process development, food safety and quality research and testing, effects of storage, and issues pertaining to handling, packaging, and shipping.
21
Processing can be broken into three main parts. These parts overlap and may need to happen simultaneously during processing, so it is helpful to start on each part and plan tasks accordingly.
Details of many of the components are included below as a reference. Keep in mind that you may not work in the order listed. This is meant to give you a scope of the tasks in an order that could likely be used.
22
The purpose of analytical testing is to reduce the number of sensory panels needed by measuring sensory attributes with equipment and to measure attributes needed for product specifications. Analytical testing also can be used to determine shelf life and shelf stability parameters. Make a plan for analytical testing based on key product characteristics/attributes.
A Note on Microbial Testing – Often food labs do not have microbial testing capabilities and rely on available research and knowledge to set kill steps in-process and finished product specifications. If specific microbial testing is needed for a new product, teams can inquire with related food microbiological labs on campus to see if testing can be conducted.
Product Characteristic | Testing Method/ Equipment | Testing Parameters | What the method actually tests | Number or Amount of Samples needed | Sample time (s) | Sample conditions |
Ex. Chewiness | Texture Analyzer | 3 Point Bend Rig + Knife | Downward force and distance | At least 10 per variable or iteration | Same day as baked – for gold standard and scale-up product. Test 1st (then use the broken product for other sampling) | Whole, 6-7 cm in diameter |
| ||||||
| ||||||
| ||||||
| ||||||
|
23
While the actual scale-up will only be one or two lab periods, it will take weeks to plan. A successful Processing section is tied to detailed and thorough planning. Your team must work through equipment selections, preventative controls, and scale-up planning documents including GMPS, SOPs, and a batch sheet. Testing industrial ingredients and new equipment also will need to be done resulting in a final industrial formula with specific processing parameters. It is also important to plan where and how to store your scaled-up product before you start.
You are really only going to get one chance to scale up in the course, and you may only get once or twice to be able to scale up in a large processing facility, as well. This is especially the case if you have to stop the line or stop production of a day-to-day product to test run your new product. That time could be very limited so making sure all of the pre-work is done with attention to detail and potential problems or setbacks have been considered are critical to make that scale-up time count.
The amount of product made during scale-up will be the amount needed for the Home Use Test, analytical testing, and shelf-life/product abuse testing. If your product has a 6-week shelf life or greater, more product will be made for the final board meeting and poster presentation. The amount needed for scale-up will vary based on the product but is typically still going to be a lab-scale amount. The goal is to make a bigger batch than what your team has previously made with equipment that has the same or very similar functions as the large-scale plant equipment.
Each time you go up in the size of equipment and each time you change the type of equipment and what controls you have over that equipment, your product characteristics have the potential to change. During scale-up it is likely that your team will not have as much processing control as with previous small batches. You will learn how that changes your product (possibly more waste, less uniformity, etc.). Most of the changes are not going to be significant, but some may be and it is important to know and understand these changes. For instance, if the moisture content of a cracker increases from 8% with small-scale processing to 12% with scale-up processing, the texture of the cracker could change significantly. A crisp cracker could become stale and tough with just this small moisture change. The processing parameters would have to be adjusted to produce an acceptable, lower moisture cracker. Knowing what characteristics are critical for your product will allow you to make quick changes while scaling up.
Here is a checklist of items that need to be completed and approved before you will be ready to scale up.
24
The goal is to think about the process which includes the function of each step (why is the step in the process and how does it affect the ingredients) and what equipment is needed to perform that function. Each time equipment is scaled to a different size (kitchen equipment, lab equipment, pilot plant equipment, plant equipment), the equipment will function slightly differently, which can have small or large effects on the finished product. These effects can be due to small differences in how the equipment works, how full the equipment is, differences in volume to surface area ratios, and more. It is best to be prepared for changes and adjustments when scaling up equipment.
The core thought process when updating the flow diagram and choosing equipment should be the function of the processing steps.
To keep the functionality of each step in mind, start with the flow diagram from the Formulation stage. Update the flow diagram once the formulation is converted to industrial ingredients (this may need to be updated more than once while working through other processing steps). These updates may be minimal or considerable depending on the ingredient changes (wet ingredients to dry ingredients, real ingredients to flavors, etc.). See the Food Safety Preventative Controls Alliance Preventative Controls for Human Food manual page A3-5 for a flow diagram example.
You will be in charge of designing your processing line on a large plant scale. This may look similar to the small-scale equipment, just with larger pieces of equipment, or it may look considerably different based on small equipment available to you and changes encountered when converting to a continuous process (as opposed to a batch process).
For more information, check out the article, Overview of Food Processing Equipment. The content above is adapted from the same article by Romina Ronquillo.
Match the function of the large-scale equipment to small processing equipment available for lab scale-up. Think through the processing steps and functions of equipment chosen for plant production. Then consider the small processing equipment available. Make the best fit matches of functions of steps to equipment available to scale-up. When your team is ready, review your large-scale and small-scale equipment with faculty. Then test the small-scale equipment to determine the effectiveness and optimal run parameters (time, speed, temperature, etc.).
It is important to note that choosing lab-scale equipment is not necessarily about what is the easiest or most convenient. It is about matching functions of the equipment so that the lab scale-up is as close as possible to large-scale production.
25
Read through the Current Good Manufacturing Practices in the Code of Federal Regulations Title 21 Part 117. Then write Good Manufacturing Practices for your product and process. Focus on the GMPs that are most relevant. Frame your GMP to fit a plant-scale operation. Your GMPs also will need to be followed as close as possible during scale-up in the lab.
26
Standard Operating Procedures (SOPs) and Sanitation Standard Operating Procedures (SSOPs) are written and implemented to provide instructions for tasks that are done regularly as part of food receiving, storage, production, and testing. These instructions are needed to make sure there is consistency in production and to reduce hazard risks.
Using the reference examples given, list all of the SOPs your product and process would need. Include a short one- to two-sentence description for each SOP in the list.
Then write one full SOP in detail with the format given below (this could be making one component of your product or one unit operation depending on how complex the process is). You can think about an SOP like a detailed recipe that includes the ingredients and amounts (materials) and step-by-step instructions of how the food is made (procedure of how the task is performed). Just add a few more details and the SOP is developed. The one full SOP should be written in enough detail that it could be handed off to another person and that person could successfully complete the task and/or make your product.
27
It is a document used in plants to monitor processes to ensure that the process is being carried out correctly. A batch sheet is the documentation used to explain if a process does not go as planned.
An SOP provides detailed instructions for a process. Batch Sheets are needed to record exactly what happened during the process. A process rarely goes exactly as planned. Ingredient weights may be off of the formula weights slightly. Equipment conditions, speeds, temperatures, etc. can vary based on batch size or the given day of operation. The batch sheets are the first documents to be reviewed if the finished product does not meet specifications, so the detail and accuracy of the batch sheets are very important.
Unit Operation | Ingredient | Formula Weight (units) | Actual Weight (units) | Equipment & Conditions | Process Specification | Unit Operation Conclusion, including any variation from your SOP |
28
The purpose of setting ingredient specifications is to make sure you get safe and consistent quality ingredients to produce a safe and consistent final product. Your team should have an SOP detailing what to do with an ingredient if it arrives out of spec. Examples include if an incoming ingredient contains an allergen that was not listed on the specification, arrives outside of temperature spec (too hot or too cold), or arrives in dirty or broken boxes or bags, leaking containers, etc.
For example, a warehouse employee calls after receiving a pallet of apples that are in rings instead of being diced. They ask, “You did not get what you ordered, what do I do with this stuff?” You need to have an answer.
Ingredients in formulation need to be represented in the following or similar table:
Ingredient | Required Attributes | Preferred Supplier | Microbial Specifications, Concerns | Receiving – Storage Conditions | Potential Allergens or Labeling Concerns |
Guar Gum | Moisture 10-15% Viscosity 4000-6000cp Color – creamy white | APC < 2500 CFU/g Yeast/Mold < 200 CFU/g Total coliform < 3 CFU/g E. coli< 3 CFU/g Salmonella neg. / 25 g. S. aureus < 50 CFU/g | Cool (70 degrees F or below) & dry (<40% Relative Humidity) environment 50 lbs. bags | None | |
Honey Powder | Powder Moisture 5-15% Honey solids 45-50% Cream color, mild honey flavor | APC < 5,000 CFU/g, Yeast & Mold < 20 CFU/g, Coliform < 10 CFU/g E. coli < 3 CFU/g Salmonella neg. / 25 g. | Cool (70 degrees F or below) & dry (<40% Relative Humidity) environment 50 lbs. bags | None |
29
It really boils down to what needs to happen to make sure a safe product is made the vast majority of the time. It is hard to plan for everything that could go wrong, but it is important to consider all relevant reasonable risks. You know you can produce a safe food product because your team has done it through the Formulation stage. Now it is time to consider how to ensure that same safety when transitioning to industrial ingredients and a large plant-scale operation.
Start with a general conversation in your team about what will be your main hazards or food safety concerns. Then work through the Preventative Controls Hazard Analysis form. As you work through the form, research hazards to determine which are likely enough to be considered.
V
Commercialization is your last strategic objective for product development. This section is about bringing all of the pieces together and making your product ready to sell on grocery store shelves. Commercialization can be tedious with lots of details to document, but these details are important and are needed to ensure success.
30
During Commercialization, your team will prepare your product for grocery store launch by completing the following objectives.
___ Consumer acceptance test (Home Use Test or HUT)
___ Shelf Life/Abuse Testing
___ Final product specifications including packaging materials and specs.
___ Final package with approved Nutrition Facts Panel. All labels and final packages must be approved.
___ Ingredient costs: Determine your ingredient costs and calculate a theoretical SRP based on information provided (model costing including manufacturing costs, packaging, marketing/advising, company profit, grocery store mark-up, etc.) and compare your predicted SRP with a chosen competitive product(s).
____ Professional oral presentation – needs to be reviewed and approved during the lab period before the presentation
____ Notebooks: completed with detailed table of contents – due Finals Week
Week 1. Finishing processing scale-up and report, getting home use test written/approved/sent out, and getting shelf-life testing/abuse testing and analytical testing started. Submit ingredient list for pricing.
Weeks 2 & 3. Work on items not yet complete, plus work on final product specifications, packaging materials, and the product label.
Week 4. Work on the final product label, package, pricing, and presentation.
Week 5. Get the final presentation approved and present to the board. Work on the commercialization report.
31
Home Use Tests (HUT) are the last sensory evaluation done before your product will be launched in the grocery store. It is important to check the liking of attributes and the overall product, along with the willingness to purchase and the price consumers would be willing to pay.
Numerous sensory tests are used in the development of new food products. These include Consumer Concept Tests, Attribute Tests (JAR Tests), Simple Difference Tests, and Home-Use Tests (HUT). Home-Use Tests provide valuable information on product performance in a natural environment before marketing and launch.
Questionnaires must be approved by faculty before distribution. Your product must average a 7 out of 9 or better in overall acceptability.
32
In this chapter, you will learn how to test your product to determine the shelf life and/or how much abuse your product can take.
Shelf life is the period of time under defined conditions of storage, after manufacture or packing, for which a food product will remain safe and be fit for use. During this period of shelf life, the product should:
All foods deteriorate, often in different ways and at different rates. Types of shelf life are shown below.
For some products, it is fairly straightforward to determine the mode of failure. For other, especially new products, it may be less clear. Performing accelerated and real-time shelf life testing will be needed to confirm the mode or modes of failure, but it can be helpful to think through the intrinsic and extrinsic factors of your product to start with an educated guess.
This is not a perfect system and works better for some products than others.
Abuse testing is done to simulate the conditions food products will go through between production and consumption. In some instances, especially for this course, abuse testing is used instead of accelerated shelf-life testing.
The type and duration of abuse are dependent on the product characteristics and size. For frozen products, the idea is for the product to be temperature abused with some surface melting, but not completely melt or come to room temperature during the abuse. Refrigerated products can sit out at room temperature for abuse, but the lengths of time may be longer than the frozen products. Below is an example of the 7 cycles of abuse. All 7 samples are abused, then all samples are evaluated together to determine the mode of failure and the cycle that the product was no longer acceptable.
State how you chose your testing, what the predicted mode of failure is, and if the product fails after only one or two abuse cycles, what steps you would take to improve the resiliency/shelf life of the product. If abuse testing is used, it will be helpful to look up the shelf life of other similar products to set the shelf life specification.
Cereal Foods World – Not Your Mentor’s Shelf Life Methods (pdf)
Italian Journal of Food Safety – Experimental Accelerated Shelf Life Determination of Ready-To-Eat Processed Foods (pdf)
33
Final product specifications are set to make sure a safe and quality product is consistently made. Specifications set the quality and safety parameters of the finished product along with information regarding packaging and storage. Specifications are used to determine product characteristics that would be out of spec or unacceptable to sell and how that product will be handled.
For attributes that you were unable to measure in the lab, research values for similar products to yours. This will likely be the case for microbiological specifications.
See the chapter on Shelf Life and Abuse Testing for more information.
34
Consider your food’s characteristics and what function(s) packaging needs to provide. Packaging functionality is diverse, but typically includes:
Packaging Material content adapted from Essentials of Food Science (Vaclavik et al., 2014)
Does the packaging for your product need to provide an additional function? Examples include:
35
Designing a label is a blend of detail and creativity. Think about all of the components needed on the label before you start designing the label. Also, consider packaging layout and size. This will be important for determining what goes where and how much space you have for the design. Then get creative on how you want to make your package stand out on the grocery store shelves.
Here is a label (from England) that stands out on a crowded snack shelf.
36
Cocoa Dry Mix | Batch Wt. | % by wt. | Weight/Box (8 – 26 gram servings) | Weight/Box in pounds. | $/pound | $/Box |
Sugar | 288 | 41.9 | 87.0688 | 0.19178150 | 0.41 | 0.07863041 |
Cocoa | 80 | 11.6 | 24.1904 | 0.05328282 | 0.89 | 0.04742171 |
Non-fat Dry Milk | 225 | 32.7 | 68.0160 | 0.14981498 | 0.99 | 0.14831683 |
Vanilla Powder | 20 | 2.9 | 6.0528 | 0.01333216 | 20.00 | 0.26664317 |
Marshmallows | 75 | 10.9 | 22.6720 | 0.04993833 | 0.85 | 0.04244758 |
688 | 100.0 | 208.0000 | 0.45814978 | 0.58345970 |
Ingredient Cost per Box | $0.583 | ||
---|---|---|---|
Manufacturing Cost | $0.583 x 70% = $0.408 | + $0.583 = | $0.991 |
Marketing & Advertising | $0.991 x 4% = $0.0396 | + $0.991 = | $1.031 |
Company Profit | $1.031 x 40% = $0.412 | + $1.031 = | $1.443 |
Store Markup | $1.443 x 35% = $0.505 | + $1.443 = | $1.948 |
The model shows a suggested retail price of $1.95 per box of 8 servings of hot cocoa mix. That seems about right based on current grocery store prices. The SRP will likely fluctuate based on ingredient and transportation costs.
1
You have now developed a product from start to finish. This is an accomplishment to celebrate. It is also a point to stop and reflect on what you have learned. Think back to where you started at the beginning of the semester. Likely ideation and deciding on your product concept feels like a long time ago. Formulation was exciting and likely nerve-racking as your team figured out how to make your product and found out if consumers were interested in buying. Processing brought new challenges and lots of documentation as your team planned for scale-up and researched how to produce a safe and consistent product. Commercialization just finished but may have felt like a whirlwind finalizing product details. As you reflect, answer the following questions.
Your responses may range from the funny to the more observant. Examples include “food scientists need to know how to do everything” and “just because it should work, does not mean it will” to “what I have learned in this experience will help me get my first job”.
Your experience developing a product can be applied moving forward. In the product development process, your job is not quite done after the product has launched. Typically there are maintenance and improvement tasks including completing real-time shelf-life studies, monitoring issues with production, quality, and distribution, and possibly making changes based on consumer feedback. As you complete this course, you can double-check your career plans. What parts of the development process interested you the most? Are there components you thought you would like, but really did not enjoy? Was your interest sparked somewhere that surprised you? Spending some time with these questions will give you confidence in your job search as you plan for the future.
There is always more to learn, but do not forget your creativity, resourcefulness, communication, teamwork, and attention to detail. Those skills will serve you well in any career path you choose.