
Exercise 1: Significant Figures and Titration
Do 2, 2.0, or 2.00 all mean the same? No, significant figures (sometimes called significant digits) indicate the level of precision of a measurement or result. The concept of significant figures is important for determining how many digits should be used to report a result. It tells the reader the precision of the number.
The accuracy of a set of observations is the difference between the average of the measured values and the true value of the observed quantity. The precision of a set of measurements is a determination of the range of values found; that is, a determination of the reproducibility of the measurement.
Precision vs. Accuracy
Scientists often use the words precision and accuracy when describing their data. Precision is the extent to which the measurements are close to one another; that is, how scattered are the values derived from repeated observations of the same phenomenon. Accuracy is the extent to which the measurements indicate the true value.
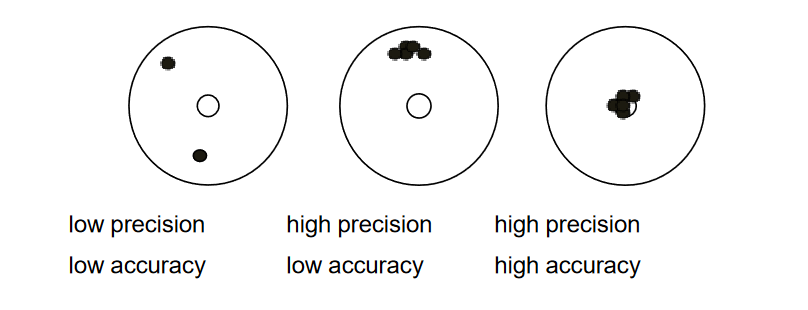
Assume the below figure represents five shots from a rifle at a target. The left target has low precision and low accuracy (where are the other three shots?). The middle target has high precision but low accuracy. The right target has high precision and high accuracy. High precision and high accuracy is the goal in soil testing.
What are significant figures?
From Analytical Chemistry (Skoog et al., 7th edition): “Significant figures in a number are all the certain digits and the first uncertain digit; with zero surrounded by other digits as always significant.” There are three main rules for remembering what to do with significant figures (or digits): 1) All non-zero digits are significant, 2) All zeroes between significant digits are significant, and 3) All zeroes which are both to the righto of the decimal point and to the right of all non-zero significant digits are themselves significant.
How does one determine significant figures in a result?
Only significant figures should be used in calculating and recording analytical results. Significant figures in a number are those digits that are known with certainty, plus the first uncertain digit (usually the last digit to the right). For example, 0.134, 1.34, 13.4, and 134 all contain three significant figures; the 1 and 3 are certain, and the 4 is uncertain in each number, respectively.
Zeros within a number can cause confusion. Initial zeros are not significant (0.00089 has two significant figures). Zeros within a number are always significant (3305 and 20.01 contain four significant figures). Zeros following a number that aren’t needed to hold the decimal point are significant (7.00 has three significant figures). Zeros within a number that do nothing but set the decimal point are ambiguous. Thus, 670,000 has at least two significant figures (and maybe more but one can’t tell by this writing), whereas 6.700 x 10³ has four significant figures. If using zeros to hold a decimal point, it is best to use scientific notation to correctly indicate significant figures.
How does one determine absolute uncertainty?
Let’s assume that one measures a length as 10,100 meters. The absolute uncertainty of this number as written is considered to be ±1 m (last digit); the absolute uncertainty of 1.01 x 10⁴ would then be ±1 x 10² or ±100 m. Note: Absolute uncertainty carries the unit of measurement; in this example, the unit of measurement is meters (m).
Absolute uncertainty may be determined from a single result. In the absence of qualifying information, it should be assumed that the last digit is uncertain by ± 1 of the unit of measurement.
How does one determine relative uncertainty?
Relative uncertainty is calculated from absolute uncertainty but is based on a relative value compared with the absolute value. It is a number without units. Relatively uncertainty is generally expressed as parts per hundred (pph) (%), parts per thousand (ppt), parts per million (ppm), etc.
For example, let’s say the absolute uncertainly of a 10.0 cm measurement is ± 0.1 cm. The relative uncertainty is absolute uncertainty divided by the measured number, or 0.1/10.0, which equals 0.01 or 1%. There are no units expressed with relative uncertainty.
Addition and Subtraction
The proper use of significant figures in addition and subtraction involves a comparison of only the absolute uncertainties of the numbers. The rule is to retain only as many digits to the right of the decimal in the answer as the number with the fewest digits to the right of the decimal. Round the last retained digit up if the discarded digit is greater than or equal to 5; retain the last digit unchanged if the discarded digit is less than 5.
Example: These are three separate measurements taken in meters (absolute uncertainty of the result is + 0.1 m):
| Incorrect | Correct |
| 90.7* | 90.7 |
| 8.81 | 8.8 |
| 0.551 | 0.06 |
| 100.061 | 100.1 |
*Numbers are the same in both columns and represent the fewest digits to the right of the decimal, controlling the answer in the correct column.
Multiplication and Division
For multiplication and division, the result should have as many significant digits as the measured number with the smallest number of significant digits (6.2 m × 8.75 m by computation is 54.25, but 6.2 has only 2 significant digits so the answer needs to be rounded to 54 m2). When performing a calculation, keep more digits than are significant and then round the final answer. This is to prevent rounding errors caused during calculations.
- For addition and subtraction, use as many decimal places as the value with the smallest number of decimal places.
- For multiplication and division, use as many significant digits as the value with the smallest number of significant digits.
Normality vs. Molarity
In chemistry courses, students often have studied molarity more than normality, but the two are related. The normality of a solution is the gram equivalent weight (eq wt) of a solute per liter of solution. A gram equivalent weight or equivalent (eq) is a measure of the reactive capability of a compound. Molarity refers to the number of moles of a substance in a liter of solution: a 1 M solution contains 1 mole (6.02 x 10²³ molecules or particles) in 1 liter of solution. Normality is useful when describing the reactivity of solutions. For example, with sulfuric acid, H2SO4: a 1 M solution contains one mole of H2SO4 in 1 liter of solution, but if you titrate the solution with base, you will find that it contains two moles of acid coming from the H+ ion because a single molecule of H2SO4 contains two acidic protons. Thus, a 1 M solution of H2SO4 will be 2 N.
One disadvantage in using normality is that the reactive capability of a compound may vary based on the reaction involved. Normality is a concentration unit that is reaction dependent. Thus, one needs to understand the chemistry (especially in oxidation-reduction reactions where the number of electrons that an oxidizing or reducing agent can accept or donate can vary based on the reaction) when assigning the normality of a solution. As explained above, however, with most acid-base reactions, the calculations are straight forward. With a correct understanding of the chemistry, one equivalent of acid or base always reacts with or replaces one equivalent of base or acid. Thus, one equivalent of H2SO4 will react with one equivalent of NaOH. A milliequivalent (meq) is 1/1000th of an equivalent.
Titration
Titration is commonly used in chemical laboratories to determine the amounts of acidity or alkalinity present in solutions. Often a colorimetric indicator is used to determine when endpoints have been reached.
The procedures that follow are designed to give the student practice in using significant figures, correctly reporting weights, precisely reading a burette, determining an endpoint, and calculating the strength of an unknown solution.
Procedure
- Weigh in duplicate 0.50 ± 0.01 g (record exact weight) of previously dried potassium hydrogen phthalate (molecular formula KHC8H4O4 and commonly known as KHP). Quantitatively transfer each replicate into a clean 250-mL Erlenmeyer flask. Record the exact weight of each replicate to the correct number of significant figures.
Potassium hydrogen phthalate is a primary acid standard used to determine the normality of a base. It releases one mole of H+ in solution and has a formula mass of 204.228 g. Thus, one millimole of KHC8H4O4 weighs 0.204228 g (204.228 mg). It has been dried in an oven at 105 °C, cooled, and stored in a desiccator to avoid picking up moisture from the air. So, 1 milliequivalent (meq) of KHC8H4O4 weighs 204.228 mg.
KHC8H4O4 ⇔ H+ + K+ + C8H4O42-
- Add approximately 100 mL of distilled water to each flask and swirl slowly until the solid dissolves completely.
Because we are titrating the quantity of H+ and the distilled water is neutral, the quantity of water added will not affect the results. It does affect the concentration of the solution but not the quantity of H+ ions present. Therefore, we can add this water with a graduated cylinder.
- Add 5 drops of phenolphthalein indicator.
Phenolphthalein is a common indicator for titration of a strong acid with a strong base or vice versa. It has a sharp endpoint that is colorless in acid solution and turns pink when H+ ions have been neutralized by OH– ions.
- Carefully titrate the acidity in the KHC8H4O4 to a permanent, faint pink endpoint using the unknown NaOH solution.
This is a very sensitive titration. When one nears the endpoint, the NaOH or base titrant should be added drop-wise causing the solution to change from colorless to pink until the pink color becomes permanent even after stirring the contents. In quantitative analysis laboratories, a partial drop is allowed to accumulate at the burette tip and is washed off with distilled water. If the solution does not permanently change color before the partial drop but does after the partial drop, the endpoint has been reached.
H+ + C8H4O42-(aq) + NaOH(aq) ⇔ C8H4O42-(aq) + Na+(aq) + H2O(l)
- After the endpoint is reached, record the volume of NaOH consumed in mL. Use the correct number of significant figures.
Since the burette is graduated to 0.1 mL, you will read the burette to the nearest 0.01 mL. The second digit to the right of the decimal is an estimate (this is a last digit in significant figures). You should read the liquid level at the bottom of the meniscus. To aid in reading the meniscus, place a white index card behind the burette. Also to avoid parallax error, when an object appears to differ when viewed from different positions, be sure you are reading the burette at a 90o angle from the bottom of the meniscus (not looking upward or downward at the meniscus). The circles that completely surround the bore of the burette will help you align your eye perpendicular to the bottom of the meniscus.
If the endpoint is overshot, one can back-titrate with a standardized HCl solution. Just subtract the milliequivalents of acid used. Remember: milliequivalents = N x mL.
- Calculate the normality of the NaOH solution.
To determine the normality of NaOH standardized against KHC8H4O4, use the following relationship (remember, milliequivalents of KHC8H4O4 = milliequivalents of H+). A milliequivalent is the amount of a substance that will react with (or replace) one millimole of H+. Since, milliequivalents of base = milliequivalents of acid, we can calculated the NNaOH by:
NNaOH × mLNaOH = meq of acid (sample wgt (mg)/204.228)
Once NaOH is standardized (its normality is known), it can be used to standardize acidic solutions such as hydrochloric acid (HCl). This is known then as a secondary standard. To do this, a measured volume of HCl is placed in a flask, phenolphthalein indicator added, and the solution is titrated with NaOH to its endpoint. The following relationship is used to calculate the normality of HCl:
NHCl = meq of OH–/mL of HCl
Name____________________
Date____________________
Section____________________
Unknown NaOH solution number ________
| Replicate 1 | Replicate 2 | |
| Weight of potassium hydrogen phthalate (g) | ||
| meq of acid | ||
| Volume of unknown NaOH solution (mL) | ||
| Normality of unknown NaOH solution | ||
| Average normality | ||
| Absolute uncertainty | ||
| Relative uncertainty (%) | ||
Notes or comments:
