
Exercise 12: Corn Stalk Nitrate Test
Studies have shown that the nitrogen (N) status of a corn crop can be assessed by measuring nitrate concentrations in the lower portion of cornstalks at the end of the growing season. This tissue test is called the “end-of-season cornstalk test” and can be used to evaluate N management practices in any field in any year. The interpretation of the results does not allow for fine tuning N management for the current growing season, instead it provides insight into better N management options for the future.
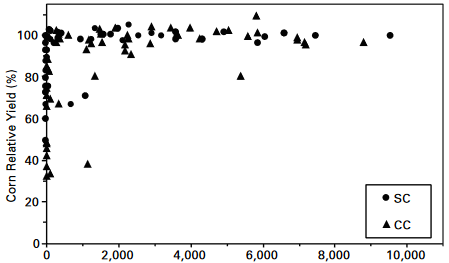
Corn plants deficient in nitrogen move N from the lower cornstalks and leaves during the grain-filling period. Corn plants that have more N than needed to attain maximum yields, however, accumulate the extra nitrate in their lower stalks at the end of the season.
In Iowa and many parts of the country, cornfields were found to receive substantially more fertilizer N than is economically optimal. This means that many corn producers can increase their profits by identifying these fields and reducing rates of N fertilization accordingly. Additionally, it can help reduce environmental pollution by reducing nitrate-N loss from soil into surface and ground water. The underlying reason for over-fertilization is that corn plants show no visual symptoms that enable producers to recognize when above-optimal rates of N have been applied. This causes producers to apply too much N year after year and never suspect a problem with their N management. The end-of-season cornstalk test makes it possible for producers to avoid this pitfall. Many producers associate a dark green plant with optimal rates of fertilization, and they fertilize to maintain dark green plants late in the growing season. The end-of-season cornstalk test, therefore, helps producers distinguish between fertilizing to maximize greenness and fertilizing to maximize profits.
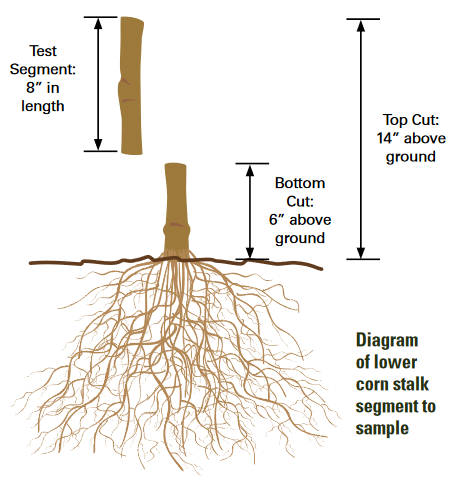
Stalk samples are collected between one and three weeks after black layers have formed on about 80% of the kernels of most ears. The portion of each plant sampled is the 8-inch segment of stalk found between 6 and 14 inches above the soil (Figure 2). Fifteen 8-inch segments should be collected to form a single sample to be sent for analysis. Areas differing in soil types or management histories should be sampled separately. One composite sample from each of several small areas (less than an acre) that seem to be representative of larger areas within a field must be collected. Samples should be placed in paper (not plastic) bags to enable some drying and minimize growth of mold and should be sent to a laboratory for analysis as soon as possible after collection.
Generally, all corn producers should consider using the test on a few fields each year. 1) Those who learn that their fields usually test in the optimal range need not make larger investments in time or money. 2) Those who learn that they usually apply too much N to some or all of their fields will find it profitable to adjust rates of application. 3) All producers who grow corn on manured soils should use the stalk test. Recent studies indicate that most producers greatly underestimate the amount of N supplied by animal manures and apply unneeded fertilizer. 4) All producers who grow corn after alfalfa should use the stalk test. Recent studies indicate that most producers greatly underestimate the amount of N supplied by alfalfa and apply unneeded fertilizer. And 5) Producers comparing alternative management practices should use the test.
The method quantifies the concentration of nitrate-nitrogen (NO3-N) in plant tissues by extraction with an aluminum sulfate [Al2(SO4)3] solution and subsequent determination by ion-selective electrode (ISE) (Baker and Thompson, 1992). The ISE determines NO3-N by measuring an electrical potential developed across a thin layer of water-immiscible liquid of by a porous membrane. The ISE is susceptible to interferences of chloride (Cl -), bicarbonate (HCO3-2), and sulfate (SO4-2) anions and is sensitive to changes in solution ionic strength (i.e. high salt). Generally, the method of detection limit is approximately 200 mg/kg (sample dry basis) and is generally reproducible to within ±18.0%.
Reagents:
- Deionized water
- Extracting Ionic Strength Adjusting Solution [0.01M Al2(SO4)3, 0.02M H3BO3, 0.01M Ag2SO4, and 0.02M NH2HCO3]: dissolve 67 g aluminum sulfate [Al2(SO4)3], 12 g boric acid (H3BO3), 20 g silver sulfate (Ag2SO4) and 19 g sulfamic acid (NH2HCO3) in water and dilute to 10 liters.
- Standard Nitrate Solutions: to a 1,000 mL volumetric flask, add 0.7221 g oven dry potassium nitrate (KNO3) and make up to volume with Extracting Solution. This yields a solution containing 100 ppm of NO3-N. Prepare calibration standards from extraction solution of 5.0, 10.0, 15.0, 20.0, 30.0, and 50.0 mg NO3-N per mL.
Procedure
- Weigh 500.0 ± 1.0 mg air-dried plant tissue and place in 50-mL extraction centrifuge tube.
- Add 25.0 ± 0.2 mL extracting solution and place on reciprocating mechanical shaker for 30 minutes. Include a method blank.
- Filter extract. Re-filter if filtrate is cloudy and retain for analysis.
- Calibrate ISE millivolt meter using standard calibration solutions and operate instrument in accordance with manufacturer’s instructions. Develop calibration curve for the ISE using standards.
- Determine nitrate concentration of plant sample and record results as mg/L NO3-N in extraction solution.
Notes:
- Plant tissue must be ground to pass 1mm sieve in order to ensure adequate homogeneity.
- Sample mass may be adjusted in accordance with expected analyte concentrations. For materials containing <500 mg NO3-N / kg, increase sample size to 1000 mg.
- Check Repipet dispensing volume, calibrate using an analytical balance.
- Routinely check ISE calibration every third sample using a mid-range standard.
- Samples having NO3 concentrations exceeding the highest standard will require dilution and reanalysis.
Calculations:
Report mg of NO3-N in sample to the nearest 10 mg/kg.
[latex]mg / kg = \frac{NO_{3} - \text{N extract} - \text{method blank }(mg/L) \times \text{volume of extracting solution }(mL)}{\text{Sample Weight }(mg)}[/latex]
Interpretations:
| Low | Optimum | Excess | |
| Stalk Nitrate-N concentrations (mg/kg) | <700 | 700–1200 | >2000 |
- Low = Greater availability of N would have resulted in higher yields.
- Optimal = N availability was within the range needed to maximize profits for the producer.
- Excessive = N availability was greater than required for maximizing profits for producers.
After appropriate consideration is given for weather conditions, fertilization rates should be increased for areas that usually test in the low range and decreased on areas that usually test in the excess range.
For more information:
Baker, W. H. and Thompson, T. L. 1992. Determination of nitrate-nitrogen in plant samples by selective ion electrode, pp. 25-31. IN: C.O. Plank (Ed.), Plant Analysis Reference Procedures for the Southern Region of the United States. Southern Cooperative Series Bulletin 368. University of Georgia, Athens.
Sawyer, J. E. and Mallarino, A. P. 2018. Use of the End-of-Season Corn Stalk Nitrate Test in Iowa Corn Production. Iowa State University Extension and Outreach Publication – Crop 3154.
EXERCISE 12: DETERMINATION OF CORN STALK NITRATE
Name___________________
Date____________________
Section__________________
Plant Tissue Number _________
| Sample 1 | Sample 2 | |
| Weight of plant tissue (g) | ||
| Amount of extracting solution added (mL) | ||
| mV reading | ||
| Regression equation | ||
| Nitrate in solution (mg/L) | ||
| N in tissue (mg/kg) | ||
| What is the interpretation category | ||
| What is the likely response to added N fertilizer |
Notes or comments (may continue on back or use separate page):
