
Exercise 7: Determination of Soluble Salts and Sodium in Soils
Soluble salts
Soluble salts are essential to plant growth and exist in at least small amounts in all soils (plants absorb nutrients from the soil as soluble salts). But, some soils contain sufficient soluble salts to reduce yields. Even though yields are reduced, low soil fertility is often not the major factor limiting crop yields in these soils.
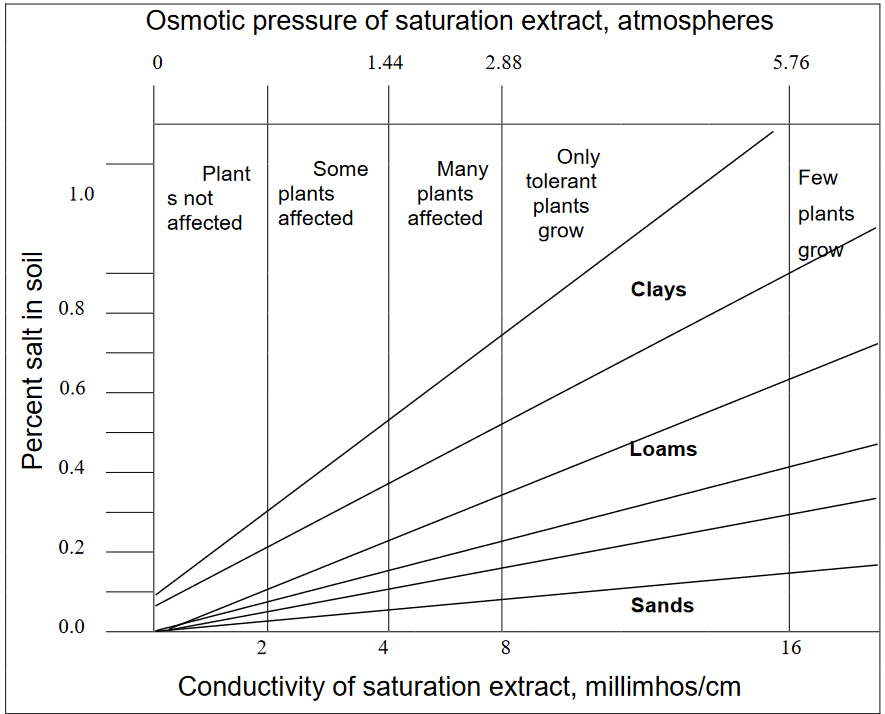
A soil that contains enough soluble salts to reduce crop yields is called a saline soil. This practical definition is technically defined in terms of the electrical conductivity of the liquid that can be extracted from a saturated soil. A conductivity of more than 4 mmhos/cm (deciSiemens/meter) indicates a saline soil, but certain sensitive plants (mainly horticultural crops) are adversely affected by readings greater than 2 mmhos/cm (Table 2). Some researchers therefore use 2 mmhos/cm as the division between saline and nonsaline soils but we will use the more traditional 4 mmhos/cm as the dividing point. In sandy soils, crops may be injured at a total salt concentration of 1000 µg/mL. In clay soils, the same crops may not be seriously injured until the salt concentration reaches 3000 µg/mL. Total soluble salt and type of salt present are both important in crop tolerance. Osmotic pressure and electrical conductivity also vary with these same factors as shown in Figure 2.
Saline soils may occur where evaporation equals or exceeds infiltration. The most likely conditions are arid areas with seepage, areas with large amounts of livestock waste applied, greenhouse soils, potted-plant soils, or soils where poor-quality irrigation water is used. The soluble salts are composed primarily of sodium (Na+), calcium (Ca2+), magnesium (Mg2+), and potassium (K+) cations and chloride (Cl-), sulfate (SO42-), and bicarbonate (HCO3-) anions. The pH is usually between 7.0 and 8.5 and free (solid-phase) calcium carbonate (CaCO3) is frequently present.
Salts depress plant growth and crop yields through (1) reduced water availability resulting from high osmotic tensions in soil solutions and (2) induced disturbances in metabolic and nutritional functions of the plants. Nutritional imbalance in the crop can be caused by the large amounts of any number of ions in the soil solution.
Soluble salts are rarely distributed uniformly in the soil. High salt concentrations are found where high evaporation rates occur; for example, along ridges a few inches high between furrows.
The international unit of measurement is seimen/m (S/m) and these units are found in most scientific journals. Many soil testing laboratories continue to use mmhos/cm. One mmho/cm is equal to 0.1 S/m or 1.0 dS/m.
New techniques allow rapid in situ measurements of electrical conductivity by a terrain conductivity meter, which is pulled over the soil surface. This measures electromagnetic conductivity and relates these readings to soil conductivity. Several soil variables affect the readings, however, and the readings need to be calibrated for soil conditions in individual fields.
Some laboratories used a screening test for salinity that involves a 1:1 mixture of soil:water (volume:volume basis) (the suspension also can be used for soil pH). Results from this test are then interpreted based on soil texture to determine if a saturation paste is warranted (Table 3). The saturated paste method is used to determine the amount of salt present to plan a corrective program.
The saturation paste extract that can be obtained from a saturated soil paste represents a soil moisture content approximately double that of field capacity. The percentage of water in the saturated paste is texture dependent. As a result, compensation for the salt dilution that results from the higher water-holding capacity of fine-textured soils is automatically achieved. One of the difficulties of this procedure is separating the extract from the soil, but this method remains the accepted standard for determining salinity.
| Electrical conductivity of saturated extract (mmhos/cm or dS/m) |
Plant response |
| 0–2 | Salinity effects usually negligible |
| 2–4 | Yield of very salt-sensitive crops may be restricted |
| 4–8 | Yield of salt-sensitive crops restricted |
| 8–16 | Only salt-tolerant crops yield satisfactorily |
| > 16 | Only a few very salt-tolerant crops yield satisfactorily |
| Texture | Degree of salinity: Non-saline | Degree of salinity: Slightly Saline | Degree of salinity: Moderately Saline | Degree of salinity: Strongly Saline | Degree of salinity: Very Strongly Saline |
| mmhos/cm or dS/m | |||||
| 1:1 Method | |||||
| Coarse to loamy sand | 0–1.1 | 1.2–2.4 | 2.5–4.4 | 4.5–8.9 | 9.0+ |
| Loamy fine sand to loam | 0–1.2 | 1.3–2.4 | 2.5–4.7 | 4.8–9.4 | 9.5+ |
| Silt loam to clay loam | 0–1.31 | 1.4–2.5 | 2.6–5.0 | 5.1–10.0 | 10.1+ |
| Silty clay loam to clay | 0–1.4 | 1.5–2.8 | 2.9–5.7 | 5.8–11.4 | 11.5+ |
| Saturated paste method | |||||
| All textures | 0–2.0 | 2.1–4.0 | 4.1–8.0 | 8.1–16.0 | 16.1+ |
Sodium
Soil high in salt also may be high in sodium. High levels of sodium in a soil are particularly troublesome because of adverse effects on soil physical properties (poor tilth and low permeability). The hydrated sodium ion is large and only carries a single positive charge (review its position in the lyotropic series). Not enough of the positively charged ions can get near the negative charge of the soil clays to neutralize the negative charge. Thus, the clays are repelled from one another and the soil is dispersed (no soil structure). Water infiltration is extremely slow and the soils often are barren of vegetation. Soil pH is often greater than 8.5.
There are two measurements used to determine the effects of sodium on soil properties:
Exchangeable sodium percentage (ESP) is the milliequivalents of sodium on the cation exchange sites expressed as a percentage of total milliequivalents of CEC. Although ESP can be measured directly, it is an involved process and is more often calculated from the sodium adsorption ratio.
Sodium adsorption ratio (SAR) is the relationship between soluble sodium and soluble divalent cations (Ca and Mg) in a soil-water solution (often a saturated paste extract). An equilibration is established between ions on the exchange sites and ions in solution. SAR is the most common way of expressing the amount of sodium in a soil. Also, SAR is commonly used to test sodium contents of irrigation water to predict whether using the water will create sodic soils.
The U.S. Salinity Laboratory has determined that a SAR of 13 is equivalent to an ESP of 15 (percentage of Na+ on cation exchange sites). The U.S. Salinity Laboratory developed this relationship using 51 American soils.
[latex]ESP = \frac{100(-0.0126 + 0.01475 \times SAR)}{1 + (-0.0126 + 0.01475 \times SAR)}[/latex]
SAR is calculated from:
[latex]SAR = \frac{NA^{+}}{\sqrt{Ca^{2}+Mg^{2+}/2}}[/latex]
where Na+, Ca2+, and Mg2+ are the concentrations in meq/L of sodium, calcium, and magnesium ions in the soil solution. To determine meq/L, mg/L as measured by atomic absorption spectrophotometry must be converted. The meq wt of Na+ = 23; Ca2+ = 20, and Mg2+ = 12 mg/meq. Thus, for example, 200 mg/L Ca2+ (200 mg/L) equals 10 meq/L.
Let’s work through a SAR calculation where these values were obtained from a saturated paste extract: Ca2+ = 80 ppm, Mg2+ = 24 ppm, and Na+ = 575 ppm. These values convert to Ca2+ = 4 meq/L, Mg2+ = 2 meq/L, and Na+ = 25 meq/L. The numerator in the above equation is 25. The denominator is the square root of (4 + 2)/2 or square root of 3, which is 1.7. Thus, the equation becomes 25/1.7 = 14.7. This soil has a SAR (>13) that indicates sodium problems.
Procedure
Note: We will use a saturated paste for determination of saline/sodic soil and to determine available nutrients in a greenhouse mix (Exercise 9). The setup is similar but interpretation of results is different.
- 1.Place approximately 125 mL of a possible saline/sodic soil in a 250-mL beaker so water can be added. Do the same with a greenhouse mixture in a separate beaker.
A volume basis is used because of the large variation that may occur in bulk densities. The exact weight of soil is not critical.
- Obtain 100 mL of deionized water in a graduated cylinder. Add the water to the soil in small increments until the soil is saturated.
Stir the soil with a spatula as the water is added. When saturated, the paste glistens, flows slightly when the beaker is tipped, and slides freely and cleanly off the spatula (for all soils except clays). After standing, free water should not collect on the soil surface. If the paste stiffens or loses its glisten, add more water and remix. If free water is on the surface after standing, add more soil and remix.
- Allow the mixture to stand 1 hr, then recheck for saturation. Take note of the volume of water used to attain saturation of the sample.
Some time must be allowed for the soluble salts to dissolve and diffuse through the added water.
- Filter as directed by your laboratory instructor.
The equipment must be dry to avoid dilution of the extract. A portion of this extract could be used to determine water-extractable nutrients in solution in greenhouse tests.
- Immerse the conductivity cell or probe of the conductivity meter into the soil extract.
One type of conductivity cell is simply dipped into the solution (it must go deep enough to cover the electrodes). Another type is filled by means of a suction bulb. The cell should be rinsed once with deionized water and, if there is enough extract, once with the extract. Smaller amounts of extract can be tested by filling the cell, then releasing the extract into its container, and refilling the cell again. Do not leave the conductivity cell empty—store in a beaker of deionized water when not in use.
- Determine the electrical conductivity of the extracts.
| Ion | Chemical symbol | Relative flocculating power |
| Sodium | Na+ | 1.0 |
| Potassium | K+ | 1.7 |
| Magnesium | Mg2+ | 27.0 |
| Calcium | Ca2+ | 43.0 |
- Pipette 1.00 ± 0.01 mL of the extract into an Erlenmeyer flask and add 99.0 ± 0.1 mL of deionized water. Stopper the flasks and mix their contents thoroughly by inverting and shaking them several times.
Thorough mixing is essential so that a small sample of the diluted extract will be representative of the whole.
- Determine Ca2+, Mg2+, K+, and Na+ contents by AAS. Report in mg/L of each element in solution.
- Calculate Ca2+, Mg2+, K+, and Na+ contents in mg/L of the extract (note that it was diluted 100 fold before being analyzed.
One method of calculating concentrations in dilution problems is to use the following formula: C1V1 = C2V2
where
- C1 = initial concentration of a solution
- V1 = initial volume of a solution
- C2 = final concentration of a solution
- V2 = final volume of a solution
For example, if 1 mL of solution was diluted into 200 mL and the final concentration was 6 mg/L, then the initial concentration could be calculated by using the above formula and solving for C1.
where
- C1 = initial concentration of a solution
- V1 = 1 mL
- C2 = 6 mg/L
- V2 = 200 mL
The initial concentration of the solution is calculated to be 1200 mg/L.
- Calculate SAR of the soil.
EXERCISE 7: DETERMINATION OF SOLUBLE SALTS AND SODIUM IN SOILS
Name____________________
Date_____________________
Section__________________
| Answer | |
| Volume of soil (mL) | |
| Volume of water for saturation (mL) | |
| Electrical conductance (mS/cm or mS/cm) | |
| Ca concentration (mg/L) in solution analyzed | |
| Dilution factor for Ca | |
| Soluble Ca2+ in extract (mg/L) | |
| Mg concentration (mg/L) in solution analyzed | |
| Dilution factor for Mg | |
| Soluble Mg2+ in extract (mg/L) | |
| Na concentration (mg/L) in solution analyzed | |
| Dilution factor for Na | |
| Soluble Na+ in extract (mg/L) | |
| K concentration (mg/L) in solution analyzed | |
| Dilution factor for K | |
| Soluble K+ in extract (mg/L) | |
| meq Ca2+ per L | |
| meq Mg2+ per L | |
| meq Na+ per L | |
| meq K+ per L | |
| SAR (please show math below) | |
| Degree of salinity (Table 3) | |
| Is this soil sodic (yes or no) |
Calculations/notes (may continue on back or use separate sheet):
- Data from https://extension.arizona.edu/sites/extension.arizona.edu/files/pubs/az1413.pdf (verified 6/27/2024) ↵
