
Chapter 2 Exercises
Step-by-Step Exercises
First, find the high and low points.
Question 1
Marbury Corporation compiled the following data from last year:
|
|
Units | Cost |
|---|---|---|
|
January |
25,000 | 325,000 |
|
February |
27,000 | 315,000 |
|
March |
35,000 | 378,000 |
|
April |
50,000 | 450,000 |
|
May |
33,000 | 407,000 |
Find the high and low points.
Question 2
Johnson Company compiled the following data from last year:
|
|
Units | Cost |
|---|---|---|
|
April |
2,700 | 52,000 |
|
May |
3,950 | 67,400 |
|
June |
1,500 | 35,980 |
|
July |
1,470 | 37,640 |
|
August |
3,900 | 70,530 |
Find the high and low points.
Question 3
Madison, Inc. gathered the following data from their first five years:
|
|
Units | Cost |
|---|---|---|
|
Year 1 |
500,000 | 1,905,000 |
|
Year 2 |
520,000 | 1,810,000 |
|
Year 3 |
490,000 | 1,722,500 |
|
Year 4 |
510,000 | 1,700,000 |
|
Year 5 |
530,000 | 1,832,500 |
Find the high and low points.
Next, find the variable cost per unit.
Question 4
The high point is (20,000, $400,000), and the low point is (15,000, $350,000).
Find the variable cost per unit.
Question 5
When sales were at their highest at 500,000 units, total costs were $750,000. When sales were at their lowest at 200,000 units, total costs were $420,000.
Find the variable cost per unit.
Question 6
At their lowest, sales units were 500; at that point, total costs were $17,000,000. At their highest, sales units were 1,300; at that point, total costs were $41,000,000.
Find the variable cost per unit.
Next, find the total fixed cost.
Question 7
The variable cost per unit is $500. The high point is (1,200, $700,000), and the low point is (700, $450,000).
Find the total fixed cost.
Question 8
The variable cost per unit is $6. When sales were at their highest at 750,000 units, total costs were $6,500,000. When sales were at their lowest at 500,000 units, total costs were $5,000,000.
Find the total fixed cost.
Question 9
The points used to build the high-low function are (6,000, $2,500,000) and (10,000, $3,300,000). The variable cost per unit is $200.
Find the total fixed cost.
Next, build the firm’s cost function.
Question 10
Variable cost per unit is $7, and total fixed costs are $100,000.
Build the firm’s cost function.
Question 11
Variable cost per unit is $37, and total fixed costs are $320,000.
Build the firm’s cost function.
Question 12
Variable cost per unit is $450, and total fixed costs are $3,000,000.
Build the firm’s cost function.
Next, determine whether the cost function can be used at the predicted volume.
Question 13
The low volume is 10,000 units, and the high volume is 40,000 units. The company is predicting sales of 41,000 units next year.
Determine whether the cost function can be used at the predicted volume.
Question 14
The high point is (4,000, $5,200,000) and the low point is (2,000, $3,400,000). The company hopes to sell 3,500 units next year.
Determine whether the cost function can be used at the predicted volume.
Question 15
The lowest number of units the firm has sold in one period was 400,000, and the highest was 750,000. The firm believes they can sell 800,000 units next period.
Determine whether the cost function can be used at the predicted volume.
Finally, use the firm’s cost function to predict future costs.
Question 16
Sutherland Enterprises is trying to estimate total costs for next month, when they expect to sell 300,000 units. In the past, Sutherland has experienced unit volumes ranging from 320,000 units to 700,000 units. Their cost function, estimated using past data, is as follows:
Total cost = $15 × Units + $5,000,000
Use the firm’s cost function to predict future costs.
Question 17
McCullough Corporation wants to estimate total costs for next year, when they expect to sell 2,500 units. Their cost function, based on sales ranging from 1,500 units to 5,000 units, is as follows:
Total cost = $3,000 × Units + $10,000,000
Use the firm’s cost function to predict future costs.
Question 18
Vaughn Company built this cost function using a low point of 20,000 units and a high point of 40,000 units:
Total cost = $250 × Units + $1,750,000
Vaughn expects sales of 30,000 units next month.
Use the firm’s cost function to predict future costs.
Complete Problems
Question 19
Bunner Corporation wishes to estimate costs for next year, when they project unit sales to be 300,000. Bunner gathered the following data from the past 5 years:
|
|
Units | Cost |
|---|---|---|
|
Year 1 |
210,000 | 800,000 |
|
Year 2 |
260,000 | 853,000 |
|
Year 3 |
190,000 | 832,000 |
|
Year 4 |
280,000 | 903,000 |
|
Year 5 |
370,000 | 931,000 |
Estimate Bunner’s cost function and use it to predict costs for next year.
Question 20
Baylee Company had the following results for the last year:
|
|
Units | Cost |
|---|---|---|
|
January |
2,100 | 70,000 |
|
February |
2,120 | 73,100 |
|
March |
2,130 | 72,600 |
|
April |
1,590 | 61,700 |
|
May |
1,300 | 49,500 |
|
June |
1,030 | 50,600 |
|
July |
1,650 | 63,250 |
|
August |
1,610 | 62,560 |
|
September |
1,590 | 61,900 |
|
October |
1,430 | 59,200 |
|
November |
2,110 | 71,300 |
|
December |
2,100 | 71,800 |
Baylee wishes to estimate what their total costs would be if they sold 1,750 units, 2,000 units, and 2,250 units.
Estimate Baylee’s cost function and use it to predict costs at all three cost levels.
Question 21
Burntwood, Inc. is a small company that has been operating for seven months, during which they had the following unit sales and total costs:
|
|
Units | Cost |
|---|---|---|
|
Month 1 |
610 | 260,000 |
|
Month 2 |
720 | 260,800 |
|
Month 3 |
680 | 260,500 |
|
Month 4 |
600 | 259,000 |
|
Month 5 |
630 | 257,000 |
|
Month 6 |
700 | 262,000 |
|
Month 7 |
710 | 260,750 |
Burntwood has projected that sales for Month 8 will be 690, for Month 9 they will be 715, and for Month 10 they will be 730.
Estimate Burntwood’s cost function and use it to predict costs for the next three months.
Question 22
Juniper Company has been in business for five years, and they anticipate that next year unit sales will be 27,000. Their unit sales and total costs for each of those five years are as follows:
|
|
Units Sold | Total Costs |
|---|---|---|
| Year 1 | 15,000 | 600,000 |
| Year 2 | 17,000 | 598,000 |
| Year 3 | 28,000 | 990,000 |
| Year 4 | 25,000 | 950,000 |
| Year 5 | 26,000 | 1,010,000 |
Estimate Juniper’s cost function and use it to predict costs for next year.
Assignment Problem
Note: Check figures are not provided for assignment problems so your instructor may use them for homework.
Question 23
Carthage Corporation wants to estimate their total costs for next year, when they plan to sell 40,000 units. They have gathered the following data from the past ten years:
| Year | Units | Total cost |
|---|---|---|
|
1 |
34,000 | 1,380,000 |
|
2 |
25,000 | 1,225,000 |
|
3 |
43,000 | 1,492,000 |
|
4 |
42,000 | 1,520,000 |
|
5 |
39,000 | 1,452,000 |
|
6 |
53,000 | 1,701,000 |
|
7 |
27,000 | 1,263,000 |
|
8 |
36,000 | 1,404,000 |
|
9 |
51,000 | 1,870,000 |
|
10 |
30,000 | 1,210,000 |
Estimate Carthage’s cost function using the high-low method and predict total costs for next year.
Challenge Problem
Question 24
Some of the records at Russell Company were destroyed in a fire, and the company is trying to reconstruct their cost function from the data available. They had used the high-low method to estimate their cost function last year, and the firm’s cost accountant remembered that fixed costs were estimated to total $4,000,000 but could not remember the variable cost estimate. The partial records remaining are as follows:
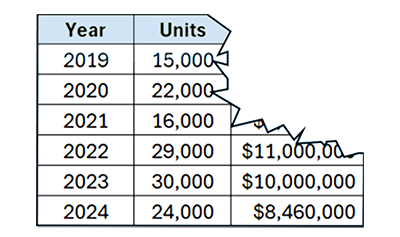
Long description:
A partially obscured table displaying units produced and total cost for selected years from 2019 to 2024. In 2019, 15,000 units were produced. In 2020, the company produced 22,000 units, and in 2021, 16,000 units were produced. The total cost values for these three years are not visible. In 2022, 29,000 units were produced with a total cost of $11,000,000. In 2023, 30,000 units were produced with a total cost of $10,000,000. In 2024, production was 24,000 units, with a total cost of $8,460,000.
Estimate Bunner’s cost function and use it to predict costs for next year.
Pre-Assessment Problem
Use this problem to check whether you are fully prepared for the assessment. Work the problem under assessment conditions – don’t use any notes or other materials!
Question 25
Sparkfield Company pulled records for the last five years to help understand its cost behavior. Its unit sales and total costs for each of those five years are as follows:
|
|
Units Sold | Total Costs |
|---|---|---|
|
Year 1 |
30,000 | 750,000 |
|
Year 2 |
24,000 | 580,000 |
|
Year 3 |
32,000 | 740,000 |
|
Year 4 |
29,000 | 700,000 |
|
Year 5 |
25,000 | 550,000 |
Estimate Sparkfield’s cost function and use it to predict costs for a year in which 31,000 units are sold. Then use it to predict total costs for a year in which 22,000 units are sold.
- Cost function: An algebraic expression of a firm’s costs, which splits the firm’s typical costs into variable and fixed portions
- Relevant range: The range of unit volumes in which a cost function is applicable; limited to the range of unit volumes that have occurred in the past
