
14 Process Costing
- Explain what kinds of companies use process costing
- Explain the purpose of process costing
- Calculate the value of goods completed and transferred out, abnormal spoilage, and ending work-in-process inventory using the weighted average method of process costing

The Theory
Firms that use process costing manufacture products that are intended to be identical to one another and are often mass-produced. Examples of products manufactured by a firm using process costing include soft drinks, pens, baseball caps, wrapping paper—basically, any product available in a large discount retail store.
Process costing can be calculated using different inventory assumptions. We will learn the weighted average method of process costing in this chapter, in which both prior period costs and current period costs are averaged over all units worked on during the current period.
Because each unit is presumably identical, the goal of process costing is to assign an identical cost to each unit. In the most basic case, you can accomplish this goal by dividing total manufacturing costs by the number of units to arrive at an average cost per unit.
However, the presence of work-in-process inventory (WIP) complicates matters. If a unit is only half complete at the end of the period, does it count as a unit in the denominator or not? How do you include the costs from work done in the previous period on beginning work-in-process inventory (BWIP)? To address these questions, firms using the weighted average method of process costing do the following:
- Calculate an average cost per equivalent unit (EU), which counts partially complete units as partial units in the denominator.
- Assign prior period costs by averaging them over all units worked on during the current period.
The result is an average cost per equivalent unit for each kind of cost involved in manufacturing the goods, which the company can use to compute the value of goods completed during the period, goods that are abnormally spoiled, and goods in ending work-in-process inventory (EWIP).
A separate cost per equivalent unit is calculated for three kinds of costs:
- Transferred-in costs (T-in), which are costs incurred in previous processes that are attached to the goods when they are transferred to subsequent processes.
- Direct materials (DM), which are usually added at specific points during each manufacturing process.
- Conversion costs (CC), which consist of direct labor and manufacturing overhead, and which are usually applied evenly throughout each manufacturing process.
Two kinds of spoilage occur in process costing: normal and abnormal.
- Normal spoilage is an expected part of the production process. The cost of normally spoiled units should be included in the cost of the units that turn out good, because some spoilage is simply a normal cost of manufacturing good units. The number of units that can be counted as normally spoiled is calculated as a percentage of good units.
- Abnormal spoilage is simply spoilage that was unexpected, regardless of the reason it arises. Any spoiled units that are not counted as normal spoilage are counted as abnormal spoilage. The cost of abnormal spoilage should be transferred to a loss account.
If you’re wondering about customer-related spoilage, it doesn’t arise in process costing systems because the goods are mass-manufactured, so the customer has no say in the manufacturing process.
Although spoilage can arise at any point in the production process, for costing purposes, assume all spoilage is 100% complete.
The Method
Begin by figuring out how many units physically went through the process during the current period and breaking down that total in two ways: by how they started and by how they ended up.
- Units can start out partially completed from the prior period (beginning work-in-process inventory) or they can be started during the current period.
- Units can end up as completed and transferred out, normal spoilage, abnormal spoilage, or incomplete (ending work-in-process).
Next, use the breakdown of how the units ended up to calculate equivalent units (EUs).
- Calculate EUs separately for each kind of cost (transferred-in, direct materials, and conversion) because units may be more complete for one cost than another.
- Count all progress made to date in the equivalent unit calculation. EUs for units completed and transferred out and spoilage should be equal to physical units: units completed and transferred out are 100% complete, and spoiled units are assumed 100% complete. EUs for any units in ending work-in-process inventory should be calculated by multiplying physical units by the progress made to date, which may differ between cost categories.
Next, calculate cost per equivalent unit for each cost category.
- Add up all costs incurred to date.
- Divide by equivalent units.
Finally, find the total value of goods completed and transferred out, goods in ending work-in-process inventory, and abnormal spoilage.
- Multiply equivalent units for each category by the cost per equivalent unit for that category.
- For completed goods, include both CTO and normal spoilage equivalent units.
Organizing this information using a format such as the one shown in Figure 14.2 can be extremely helpful. This format can help you see the relationship between the different pieces of information and help you perform the calculations more easily. Figure 14.3 in the Illustrative Example section shows you this format including numbers from the example.
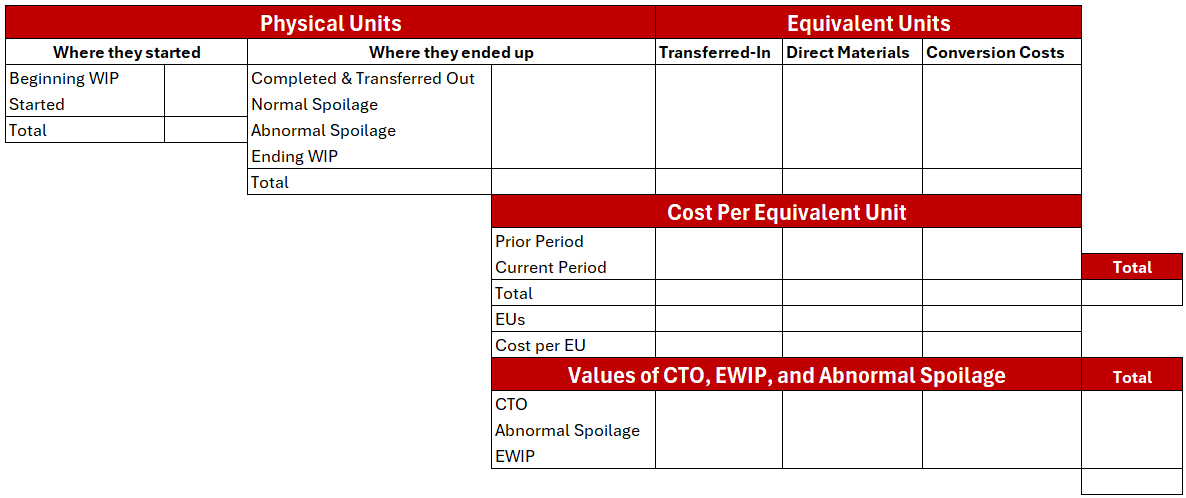
Long description for image:
A process costing worksheet divided into three main sections. The top section, titled “Physical Units,” shows where units started (Beginning WIP and Started) and where they ended up (Completed & Transferred Out, Normal Spoilage, Abnormal Spoilage, and Ending WIP), with a Total row at the bottom. The middle section, titled “Equivalent Units,” includes columns for Transferred-In, Direct Materials, and Conversion Costs, aligned with the same output categories. The third section, titled “Cost Per Equivalent Unit,” shows costs from the prior and current periods, total costs, equivalent units (EUs), and cost per equivalent unit. The final section at the bottom, titled “Values of CTO, EWIP, and Abnormal Spoilage,” displays the calculated dollar values for units completed and transferred out (CTO), abnormal spoilage, and ending work-in-process inventory (EWIP), with a total column on the right.
Illustrative Example
Parkway Products manufactures teddy bears in three processes: cutting, sewing, and finishing. In the sewing process, the pieces necessary to assemble each bear arrive in a packet from the cutting process, so all direct materials are added at the beginning of the sewing process. Conversion costs are applied evenly throughout the sewing process.
Last period, 350 bears were in beginning work-in-process inventory in the sewing process, and they were, on average, 30% complete. Nine hundred bears were transferred to the sewing process from the cutting process; $300 in cutting costs were attached to these bears already. A total of 1,100 bears were completed during the period, 100 of which were spoiled. Normal spoilage is typically 8% of good output. At the end of the period, work still in process was, on average, 60% complete.
Prior period costs for the sewing process consisted of $100 in transferred-in costs, $350 in direct materials costs, and $250 in conversion costs. During the current period, the sewing process incurred $1,000 in direct materials costs and $1,773 in conversion costs.
First, calculate total units, how they started, and how they ended up:
| Units from beginning WIP: | 350 |
|---|---|
| Units started during the period: | 900 |
| Total units worked on during the period: | 1,250 |
Units completed and transferred out 1,000 (1,100 – 100 spoilage):
| Normal spoilage | 80 | (8% x 1,000) |
|---|---|---|
| Abnormal spoilage | 20 | (100 – 80) |
| Ending work-in-process inventory | 150 | (1,250 – 1,000 – 80 – 20) |
| Total units worked on during the period | 1,250 | (Same as total from above) |
Next, calculate equivalent units for each kind of cost. Units completed and transferred out, normal spoilage, and abnormal spoilage should be equal to physical units. For ending work-in-process inventory:
- Transferred-in costs are complete at the beginning of the process, so the process is 100% complete when it comes to transferred-in costs. 100% x 150 = 150 EUs.
- Direct materials are added at the beginning of the process, so the process is 100% complete when it comes to direct materials costs. 100% x 150 = 150 EUs.
- Conversion costs are incurred evenly, and the process is 60% complete. 60% x 150 = 90 EUs.
|
|
Transferred-in costs |
Direct materials costs |
Conversion costs |
|---|---|---|---|
|
Completed and transferred out, |
1,000 |
1,000 |
1,000 |
|
Normal spoilage, |
80 |
80 |
80 |
|
Abnormal spoilage, |
20 |
20 |
20 |
|
Ending work-in-process, |
150 |
150 |
90 |
|
Total |
1,250 |
1,250 |
1,190 |
Next, calculate cost per equivalent unit for each cost category:
|
|
Transferred-in costs |
Direct materials costs |
Conversion costs |
|---|---|---|---|
|
Costs incurred last period |
$100 |
$ 350 |
$ 250 |
|
Costs incurred this period |
$300 |
$1,000 |
$1,773 |
|
Total costs |
$400 |
$1,350 |
$2,023 |
|
Equivalent units (from above) |
÷ 1,250 |
÷ 1,250 |
÷ 1,190 |
|
Total |
$0.32 |
$ 1.08 |
$ 1.70 |
Finally, use the cost per equivalent unit to find the value of units completed and transferred out, ending work-in-process inventory, and the loss caused by abnormal spoilage:
Units completed and transferred out (include EUs for CTO and normal spoilage):
| Transferred-in costs | 1,080 × $0.32 = $345.60 |
|---|---|
| Direct materials costs | 1,080 × $1.08 = $1,166.40 |
| Conversion costs | 1,080 × $1.70 = $1,836.00 |
| Total cost | $3,348.00 |
Loss caused by abnormal spoilage:
| Transferred-in costs | 20 × $0.32 = $6.40 |
|---|---|
| Direct materials costs | 20 × $1.08 = $21.60 |
| Conversion costs | 20 × $1.70 = $34.00 |
| Total cost | $62.00 |
Ending work-in-process inventory:
| Transferred-in costs | 150 × $0.32 = $ 48.00 |
|---|---|
| Direct materials costs | 150 × $1.08 = 162.00 |
| Conversion costs | 90 × $1.70 = 153.00 |
| Total cost | $363.00 |
To check whether the math was done correctly, add up the three total values: $3,348 + $62 + $363 = $3,773. This should be the same as the total costs incurred both this period and last period: $400 + $1,350 + $2,023 = $3,773.
Figure 14.3 shows this information organized into the format shown in Figure 14.2.
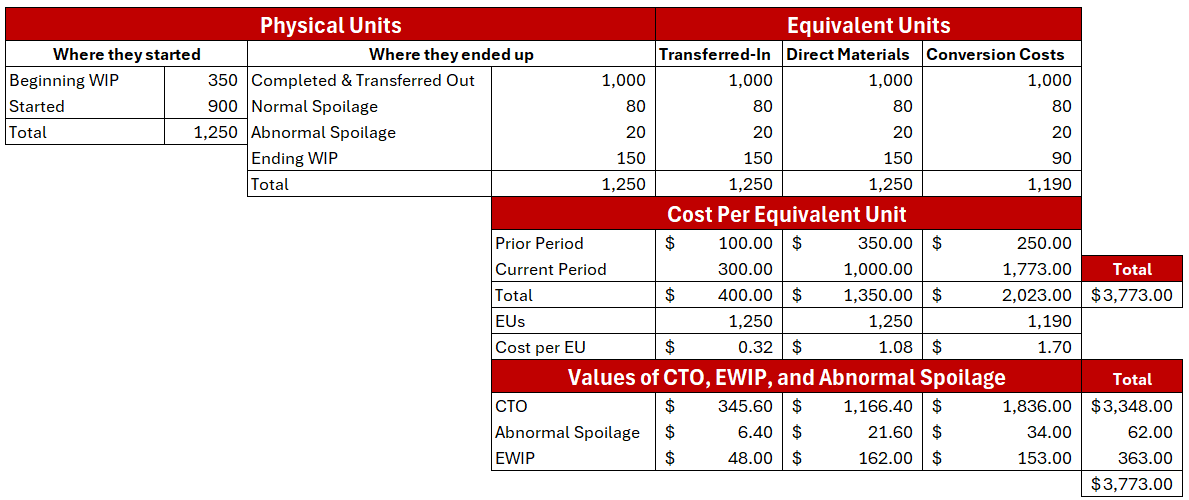
Long description for image:
A completed process costing worksheet showing numerical values. The figure is divided into three main sections: “Physical Units,” which tracks units from where they started to where they ended up; “Equivalent Units,” which calculates equivalent units for Transferred-In, Direct Materials, and Conversion Costs; and “Cost Per Equivalent Unit,” which shows prior and current period costs, total costs, equivalent units, and cost per equivalent unit. The final section displays the dollar values assigned to completed and transferred out units (CTO), abnormal spoilage, and ending work-in-process inventory (EWIP). This figure illustrates a worked example of process costing using the weighted average method.
Curbin, Inc. produces widgets in two departments: Assembly and Finishing. In March, 5,000 units were transferred from Assembly to Finishing, to which $10,000 of Assembly costs had been attached. At the beginning of the period, 750 units were already in process in the Finishing department, which had $1,300 in Assembly costs, $1,000 in direct materials costs, and $2,000 in conversion costs attached to them. They were 80% complete. At the end of the period, 500 units were still in process in the Finishing department, 40% complete. During the period, $6,000 in direct materials costs (materials are added halfway through the Finishing process) and $15,000 in conversion costs (conversion costs are added evenly throughout the Finishing process) were added in the Finishing department. After goods were completed, they were inspected, and it was found that 250 units had been spoiled. Normal spoilage in the Finishing department is 5% of good output.
Assign costs to goods completed and transferred out, ending work-in-process inventory, and loss caused by abnormal spoilage for the Finishing department.
- First, calculate total units, how they started, and how they ended up.
- Next, calculate equivalent units for each kind of cost.
- Next, calculate cost per equivalent unit.
- Finally, use the cost per equivalent unit to find the value of units completed and transferred out, ending work-in-process inventory, and the loss caused by abnormal spoilage.
Lecture Example
The Finishing department at Mass Manufacturing, Inc. began March with 400 units in WIP (40% completed), costing $20,000 in DM and $80,000 in conversion, and with $40,000 in transferred-in costs. They started work on 1,600 units and ended with 500 units in WIP (20% completed). Two hundred units were spoiled. Normal spoilage is 10% of good units. Costs added during the period were $160,000 in transferred-in costs, $100,000 in DM, and $500,000 in conversion. Direct materials are added 25% of the way through the Finishing process, and conversion costs are added evenly throughout the Finishing process.
- Assign costs to goods completed and transferred out, ending work-in-process inventory, and loss caused by abnormal spoilage for the Finishing department.
A costing system used in firms that mass-manufacture products; the goal is to assign an identical cost to each unit
A method of process costing in which prior period costs and current period costs are averaged over all units worked on during the current period
The number of units that could have been completed given the amount of work that went into physical units, calculated by multiplying the number of physical units by their completion percentage
