
10 Variance Analysis
- Given a static budget, prepare a flexible budget based on actual sales
- Given production standards and actual results, calculate the standard price of actual quantity for all variable manufacturing costs
- Calculate the components of a four-column chart, including a static budget, flexible budget, standard price of actual quantity, and actual results
- Using the components of a four-column chart, calculate budget variances that capture the effect on profit due to changes in sales price, sales volume, efficiency of direct materials use, direct materials price, efficiency of direct labor, direct labor wage rate, efficiency of variable overhead cost allocation base use, variable overhead spending, and fixed cost spending
- Determine the favorability of each budget variance

The Theory
A variance compares an actual amount (of revenue, cost, or profit) to a budgeted amount and expresses the effect on profit due to the difference. Budgeted costs are calculated using standards: a standard cost represents how much a unit should cost, and it is used as a benchmark for comparing to actual cost. Standard costs can be broken down into the standard input allowed for one unit (such as hours for direct labor or pounds for direct materials) and the standard price per input unit (such as the wage rate per hour or the cost of materials per pound).
Variances are favorable (F) if they have a positive impact on income and unfavorable (U) if they have a negative impact on income. In this chapter, we will cover the following variances:[1]
Revenue sales price variance (RSP)
- Arises because the price charged for goods differs from standard
- Used to evaluate how well the firm set sales price
Direct materials efficiency variance (DME)
- Arises because the materials used per unit differ from standard
- Used to evaluate how efficiently the firm used direct materials
Direct materials price variance (DMP)
- Arises because the price paid for materials differs from standard
- Used to evaluate how good the direct materials price was
Direct labor efficiency variance (DLE)
- Arises because labor efficiency differs from standard
- Used to evaluate how efficiently labor worked
Direct labor price variance (DLP)
- Arises because the wage rate differs from standard
- Used to evaluate how good the wage rate was
Variable overhead efficiency variance (VOhE)
- Arises because allocation base usage differs from standard
- Used to evaluate how efficiently the firm used the cost allocation base
Variable overhead spending variance (VOhS)
- Arises because variable overhead spending differs from standard
- Used to evaluate how well the firm controlled variable overhead cost
Contribution margin sales volume variance (CMSV)
- Arises because the quantity of goods sold differs from standard
- Used to evaluate how well the firm did at generating sales
Fixed cost spending variance (FCS)
- Arises because fixed cost spending differs from budgeted
- Used to evaluate how well the firm controlled fixed cost
The Method
The following chart shows all the variances we will cover:
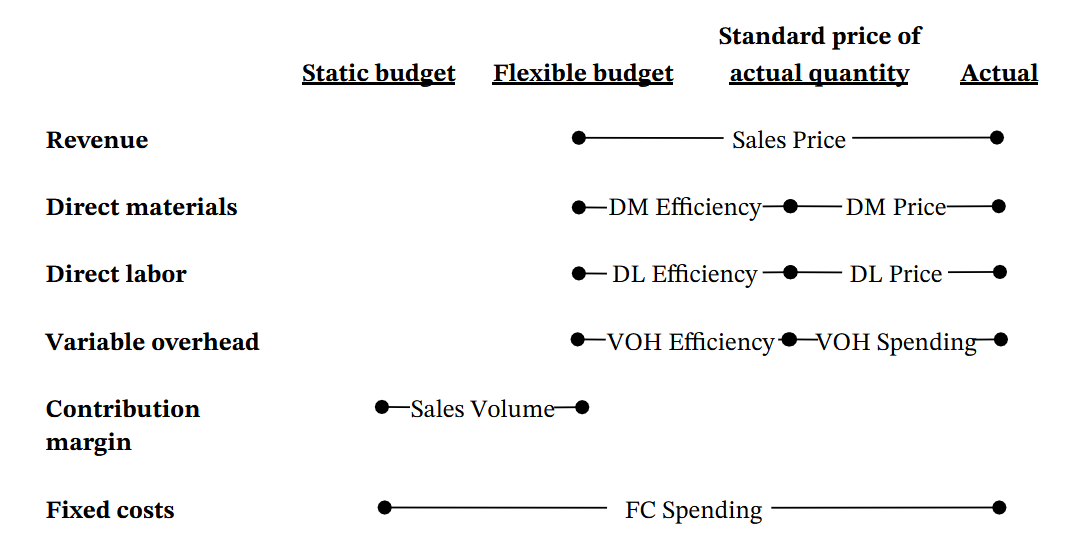
First, fill in the amounts in each column.
- The static budget is the standard cost of the budgeted sales volume. It is essentially just the amount that appears on the operating budget for the period.
- The flexible budget is the standard cost of the actual sales volume. It is calculated similarly to the flexible budgets we calculated in Chapter 8, except that it would be calculated at the end of the period, using the actual sales volume achieved during the period.
- The standard price of actual quantity is the standard price of the actual quantity of materials used (in pounds, gallons, etc.) for direct materials, the standard price of the actual labor hours used for direct labor, and the standard price of the actual allocation base (which will differ from case to case) used for variable overhead.
- Actual amounts are simply the actual results.
- Each of these amounts could also be broken down as follows:
|
|
Static |
Flexible |
Standard price of |
Actual |
|---|---|---|---|---|
|
Units |
Budgeted |
Actual |
Actual |
Actual |
|
modifier |
× |
× |
× |
× |
|
Input per unit |
Standard |
Standard |
Actual |
Actual |
|
modifier |
× |
× |
× |
× |
|
Price per input |
Standard |
Standard |
Standard |
Actual |
Next, calculate the variances by finding the difference between the columns indicated by dots, and label each variance as favorable or unfavorable.
- Notice that columns more to the left on the chart are “more budgeted,” and columns to the right are “more actual.” It is useful to think of the amounts this way.
- If the “more actual” amount would result in higher income than the “more budgeted” amount, the variance is favorable.
- For revenue and contribution margin variances, if the “more actual” amount is higher than the “more budgeted” amount, then the variance is favorable.
- For cost variances, if the “more actual” amount is lower than the “more budgeted” amount, then the variance is favorable.
- If the “more actual” amount would result in lower income than the “more budgeted” amount, then the variance is unfavorable.
- For revenue and contribution margin variances, if the “more actual” amount is lower than the “more budgeted” amount, then the variance is unfavorable.
- For cost variances, if the “more actual” amount is higher than the “more budgeted” amount, then the variance is unfavorable.
Finally, double-check the accuracy of the variance calculations by ensuring that their net equals the difference between budgeted and actual income.
Illustrative Example
Bloomgarden, Inc. has developed the following production standards:
- Direct materials: Each unit requires 2 pounds, at $10 per pound
- Direct labor: Each unit requires 0.25 hour, at $17 per hour
Variable manufacturing overhead is applied at a rate of $10 per direct labor hour, and fixed costs are budgeted at $75,000. Bloomgarden budgeted to sell 120,000 units at $30 each, but actually sold 110,000 units at $31 each. Bloomgarden spent $2,200,000 on 230,000 pounds of material, spent $560,000 for 35,000 hours of direct labor, spent $225,000 for variable manufacturing overhead, and spent $74,000 for fixed costs.
Calculate all nine variances and indicate whether they are favorable or unfavorable.
First, fill in the amounts in each column.
- The static budget amounts are calculated by multiplying budgeted units by the production standards for each item except fixed overhead, which is given.
- Revenue: 120,000 × $30 = $3,600,000
- Direct materials: 120,000 × 2 × $10 = $2,400,000
- Direct labor: 120,000 × 0.25 × $17 = $510,000
- Variable overhead: 120,000 × 0.25 × $10 = $300,000
- So, contribution margin = $3,600,000 – $2,400,000 – $510,000 – $300,000 = $390,000.
- Fixed costs: $75,000
- The flexible budget amounts are calculated by multiplying actual units by the production standards for each item.
- Revenue: 110,000 × $30 = $3,300,000
- Direct materials: 110,000 × 2 × $10 = $2,200,000
- Direct labor: 110,000 × 0.25 × $17 = $467,500
- Variable overhead: 110,000 × 0.25 x $10 = $275,000
- The standard price of actual quantity amounts are calculated by multiplying actual quantities of inputs by standard prices for each item.
- Direct materials: 230,000 × $10 = $2,300,000
- Direct labor: 35,000 × $17 = $595,000
- Variable overhead: 35,000 × $10 = $350,000
- Actual amounts are given for all items except revenue, which is calculated by multiplying the actual units sold by the actual sales price.
- Revenue:110,000 × $31 = $3,410,000
- Direct materials: $2,200,000
- Direct labor: $560,000
- Variable overhead: $225,000
- Fixed costs: $74,000
The complete chart:
|
|
Static budget |
Flexible budget |
Standard price of |
Actual |
|---|---|---|---|---|
| Revenue | 3,600,000 | 3,300,000 | 3,410,000 | |
| Direct materials | 2,400,000 | 2,200,000 | 2,300,000 | 2,200,000 |
| Direct labor | 510,000 | 467,500 | 595,000 | 560,000 |
| Variable overhead | 300,000 | 275,000 | 350,000 | 225,000 |
| Contribution margin | 390,000 | 357,500 | 425,000 | |
| Fixed costs | 75,000 | 75,000 | 74,000 | |
| Income | 315,000 | 282,500 | 351,000 |
Next, calculate the variances by finding the difference between the columns, and label each variance as favorable or unfavorable.
- Revenue sales price variance
- $3,410,000 – $3,300,000 = $110,000
- “Actual” revenues are higher than “budgeted,” so it is favorable
- Direct materials efficiency variance
- $2,300,000 – $2,200,000 = $100,000
- “Actual” cost is higher than “budgeted,” so it is unfavorable
- Direct materials price variance
- $2,300,000 – $2,200,000 = $100,000
- “Actual” cost is lower than “budgeted,” so it is favorable
- Direct labor efficiency variance
- $595,000 – $467,500 = $127,500
- “Actual” cost is higher than “budgeted,” so it is unfavorable
- Direct labor price variance
- $595,000 – $560,000 = $35,000
- “Actual” cost is lower than “budgeted,” so it is favorable
- Variable overhead efficiency variance
- $350,000 – $275,000 = $75,000
- “Actual” cost is higher than “budgeted,” so it is unfavorable
- Variable overhead spending variance
- $350,000 – $225,000 = $125,000
- “Actual” cost is lower than “budgeted,” so it is favorable
- Contribution margin sales volume variance
- $390,000 – $357,500 = $32,500
- “Actual” contribution margin is lower than “budgeted,” so it is unfavorable
- Fixed cost spending variance
- $75,000 – $74,000 = $1,000
- “Actual” cost is lower than “budgeted,” so it is favorable
Finally, double-check the accuracy of the variance calculations by ensuring that their net equals the difference between budgeted and actual income.
- Favorable: $110,000 + $100,000 + $35,000 + $125,000 + $1,000 = $371,000
- Unfavorable: $100,000 + $127,500 + $75,000 + $32,500 = $335,000
- Net = $371,000 – $335,000 = $36,000 favorable
- Budgeted versus actual income: $315,000 – $351,000 = $36,000 favorable
Middletown Corporation has set the following standards for production:
- Direct materials: 5 pounds at $3 per pound
- Direct labor: 2 hours at $18 per hour
Middletown applies variable overhead at a rate of 70% of direct labor cost and has budgeted fixed costs at $4,000,000. This period, Middletown budgeted to produce 350,000 units and actually sold 370,000 units. Middletown actually spent $5,250,000 on 1,800,000 pounds of materials, $15,000,000 on 750,000 hours of direct labor, $11,000,000 on variable overhead, and $4,100,000 on fixed costs. Middletown’s product was budgeted to sell for $90 per unit. Actual revenue was $32,930,000.
Calculate all nine variances and indicate whether they are favorable or unfavorable.
Lecture Examples
The following were included in Matthews Manufacturing’s budget:
- Produce and sell 10,000 units for $15 each
- Use 2 pounds of direct materials to produce each unit, costing $3 per pound
- Use 0.25 hour of direct labor per unit, costing $10 per hour
- Spend $4 per direct labor hour on variable manufacturing overhead
- Spend $40,000 on fixed costs
During the period, Matthews actually:
- Produced and sold 9,800 units, for revenue of $156,800
- Purchased and used 20,500 pounds of direct materials at $3.10 per pound
- Used 2,520 labor hours costing $24,696
- Spent $10,450 on variable manufacturing overhead
- Spent $38,000 on fixed costs
-
- Calculate all nine variances and indicate whether they are favorable or unfavorable.
- Now assume that Matthews applies variable overhead at a rate of 40% of direct labor cost. Recalculate the variable overhead efficiency and spending variances.
- These variances are not the only variances that can be calculated for a firm, and some of these variances may be calculated differently by different firms. For example, a firm using standard costing would calculate a fixed overhead production volume variance, which arises because capacity is used to a different extent than what was planned. In addition, if a purchasing manager is to be evaluated based on the direct materials price variance, it should be calculated using the quantity of materials purchased, not used. This chapter takes the approach of reconciling the budgeted income statement to the actual income statement, which requires omitting the fixed overhead production volume variance and calculating the direct materials price variance based on the quantity of materials used in production. ↵
The difference between an actual amount (of revenue, cost, or profit) and a budgeted amount, expressed as the effect on profit of that difference, and a label indicating whether the effect is favorable or unfavorable
How much a unit should cost
How much of an input such as pounds, gallons, hours, or cost allocation base should be used per unit
How much a unit of input should cost
The standard cost of the budgeted sales volume
The standard cost of the actual sales volume
The standard price of the actual quantity of input used
