
3 Properties and Function of an Enzyme
Following this week’s lab, students will be able to:
- Describe what an enzyme is and how it works
- Describe the effect of enzyme concentration on the rate of a chemical reaction
- Develop a hypothesis, perform an experiment, and analyze and display experimental data regarding enzyme activity
- Describe how one or more environmental conditions affects enzyme function
Contribution Points:
 Consult with your TA to receive a stamp at the end of your lab period.
I have completed the necessary tasks required during this week’s lab to earn Contribution Points. I am aware that I may have point(s) deducted from my Contribution Points if my workspace is not appropriately clean at the conclusion of lab.
Resources
- Freeman et al. 2024. Biological Science (8th ed.), pp. 84–97 (Chapter 3)
- Enzyme videos (provided in lab and on Canvas).
- Canvas Resources
Background
Enzymes play an important role as biological catalysts, lowering the amount of activation energy necessary to carry out a reaction. They are utilized to control the chemical reactions that are carried out within cells, making sure that these reactions are not random events, but are instead carefully orchestrated to allow the cell to carry out its function.
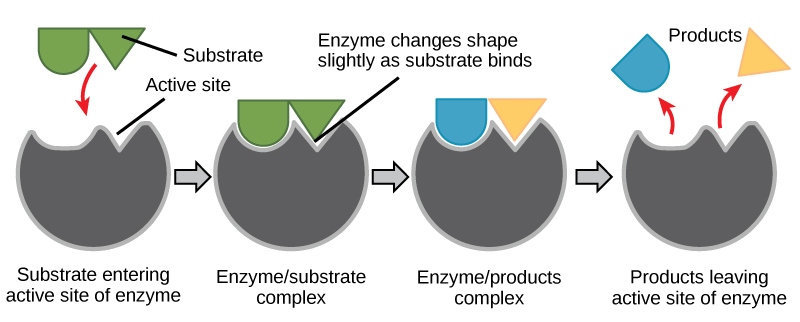
Enzymes have specialized shapes determined by their amino acid sequences. The specific shape of each enzyme provides it with an active site – a location where only a specific molecule can bind. This specific molecule is called the substrate. When the enzyme binds to the substrate, the bonding process triggers a chemical change in the substrate that changes it into a new molecule (or molecules), called the product. While the substrate is changed during this reaction, the enzyme itself is not. This allows the enzyme to bind to another substrate molecule and continue the reaction cycle. This process is often demonstrated using a lock and key model, as illustrated in Figure 3.1.
There are a number of environmental factors that can affect the ability of the enzyme to catalyze reactions. Factors such as changes in temperature and pH can affect the rate at which an enzyme can function. Each enzyme has a set of “optimal” conditions under which it will function at its highest rate. Changes in those conditions will result in a change in the rate of its function.
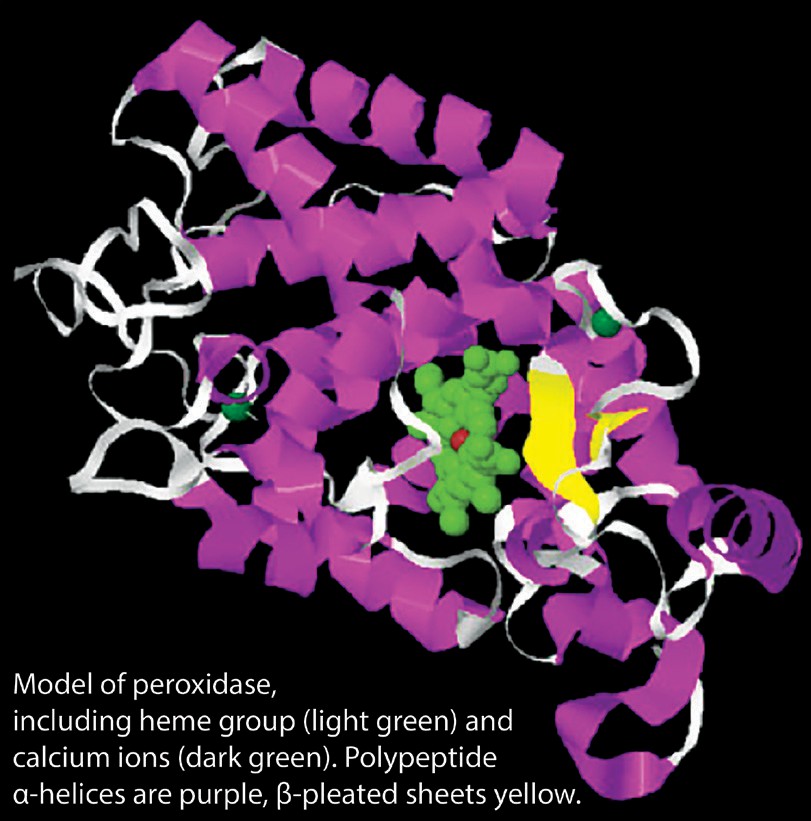
For today’s lab, we will be exploring enzyme function by utilizing peroxidase. Peroxidase, depicted in Figure 3.2 is an enzyme that is found in a wide variety of organisms (from bacteria to humans). Hydrogen Peroxide (H2O2) is often one of the byproducts when an organism utilizes oxygen in redox reactions. However, hydrogen peroxide is toxic to cells, so a build-up of H2O2 can result in cell death. The function of peroxidase is to break down hydrogen peroxide into byproducts that are no longer toxic to the cell.
In the natural world, peroxidase is utilized by plants to help them defend against pathogens. It can cause a color change and reduce the shelf life of frozen vegetables, which is why many of these vegetables are briefly submerged in boiling water (blanched) before they are frozen to denature the peroxidase and keep it from causing a color change. In animals, peroxidase provides an important function in the immune system – it can produce free radicals that are used by some immune
system cells to destroy invaders, damaged cells, and cancer cells. Peroxidase has also performed an important function in investigating neurobiology and developmental biology. Because it can be taken up by neurons and transported through the cytoplasm, it has been used to trace branches of these cells to visualize contacts with other cells. Horseradish peroxidase (the same enzyme utilized in lab today) is responsible for much of our knowledge about the nervous system architecture.
Peroxidase has found its way into manufacturing and industrial uses as well. We utilize peroxidase to help treat industrial wastewater (it aids in the removal of harmful phenols), it can be used to help convert toxic materials (like dyes) into less harmful substances and has been used in some manufacturing processes.
The normal function of peroxidase is to reduce toxic hydrogen peroxide, which can be produced in certain metabolic reactions, into water and another harmless compound shown in the equation below:
[latex]H_{2} O_{2} + R H_{2} \overset{\text{peroxidase}}{\leftrightarrow} 2 H_{2} 0 + R[/latex]
In this equation, R stands for another molecule that acts as an electron donor, even though it does not bind to the enzyme active site. Some molecules that can act as electron donors change color when they are oxidized in this reaction, and the color change can be used to follow the progress of the reaction. We use the dye guaiacol, which turns brown when oxidized. The reaction sequence is:
[latex]4 H_{2} O_{2} + 4 \text{guaiacol }(\text{colorless}) \overset{\text{peroxidase} }{\leftrightarrow} 4 H_{2} 0 + \text{tetraguaiacol }(\text{oxidized})\text{ }(\text{brown})[/latex]
In lab today, we will use the color change caused by the oxidation of guaiacol to determine the rate of the peroxidase reaction. The peroxidase we use in lab is a standardized horseradish peroxidase, which means it has been purified. We can reliably determine how much of the enzyme is in a given sample. However, as the video tutorial demonstrates, peroxidase can be extracted easily from turnips.
Experiment 1: Standardizing the Amount of Enzyme
Background
In this activity, you will adjust the concentration of peroxidase while keeping the concentration of the substrates and pH constant. Looking back to the peroxidase enzyme reaction equation above, what do you think will happen to the reaction rate (speed) as you increase the concentration of peroxidase? Why?
Following this protocol will not only help you understand the basics of enzyme function but will also give you practice in measuring enzyme activity which will aid in designing your own experiment later in lab.
Protocol
- Choose a spectrophotometer station for your workstation. You will be using 7 test tubes for this experiment. Label each test tube with a piece of masking tape and number them from 1-7.
- Fill each test tube with the reagents described in Table 3.1. All of the reagents will be in repeating pipettes around the classroom. The repeating pipettes have already been set to a specific volume. Do not change the pipette volumes. You will notice that there are two test tubes for each treatment. This separates the reactants from the enzyme. The reaction will only occur once the test tubes are mixed.
| Tube # | Buffer pH 5 (mL) | Hydrogen Peroxide (mL) | Peroxidase (mL) | Guaiacol (mL) | Total Volume (mL) |
|---|---|---|---|---|---|
| 1 (Blank) | 5.0 | 2.0 | 0.0 | 1.0 | 8.0 |
| 2 | 0.0 | 2.0 | 0.0 | 1.0 | 3.0 |
| 3 | 4.5 | 0.0 | 0.5 | 0.0 | 5.0 |
| 4 | 0.0 | 2.0 | 0.0 | 1.0 | 3.0 |
| 5 | 4.0 | 0.0 | 1.0 | 0.0 | 5.0 |
| 6 | 0.0 | 2.0 | 0.0 | 1.0 | 3.0 |
| 7 | 3.0 | 0.0 | 2.0 | 0.0 | 5.0 |
- Adjust your spectrophotometer to 470 nm and zero (or blank) it using the contents of Tube 1. If you need a refresher on how to do this, watch the Spectrophotometer video tutorial posted on the lab laptop computers from Week 1. Why do you need to use the contents of this tube and not another solution, such as water, to zero the spectrophotometer?
- After you zero the spectrophotometer, assign one member of your group as a timekeeper, another as mixer, and the third as the recorder.
- When ready, have your mixer combine the contents of tubes 2 and 3. Your timekeeper should start the timer immediately once the two solutions have touched. Mix the contents by pouring the solution from one tube to the other 2-3 times. As quickly as possible, pour the solution into a cuvette, cap it, wipe off the exterior, and place it in the spectrophotometer. Put the used test tubes in the wash bucket in the sink.
- Your recorder should record the absorbance every 20 seconds for two minutes in Table 3.2. Note: If you are getting negative values, you may need to set the blank again.
- Once you have collected all the required measurements, discard the contents of the cuvette down the drain and rinse the cuvette out with distilled water from your squirt bottle.
- Repeat steps 5–7 for tubes 4 and 5. You do not need to re-zero the spectrophotometer.
- Repeat steps 5–7 for tubes 6 and 7.
| Treatments | 40 seconds | 60 seconds | 80 seconds | 100 seconds | 120 seconds |
|---|---|---|---|---|---|
| Tubes 2 & 3: 0.5 mL Peroxidase |
|
|
|
|
|
| Tubes 4 & 5: 1.0 mL Peroxidase |
|
|
|
|
|
| Tubes 6 & 7: 2.0 mL Peroxidase |
|
|
|
|
|
- When you have completed the experiment, remove the tape labels from the test tubes and wash the tubes thoroughly using the soap and brushes provided. Place the tubes upside down in the test tube rack to drain.
- After you have cleaned up your station, return to your student desk. Your TA will discuss the class data and will analyze the class data during a presentation.
Experiment 2: Create Your Own Experiment
As discussed in the background information for this lab, a number of environmental factors may affect enzyme function and reaction rate. You have already determined how changing the amount of peroxidase enzyme effects the reaction rate. In this part of the lab, you will further test how enzyme function and reaction rates are affected by a variety of different factors. Each group should investigate one of the following 2 factors to test. Your TA may assign your group a factor to test:
- Changing the pH of buffer
- Changing temperature of the reaction
Once you have been assigned the factor that you will test, go to the TA bench to find the instruction and tip sheet folder that corresponds to your chosen factor. Read it over, and then answer the questions below. Make sure you get approval from your TA before you start your experiment.
- BEFORE STARTING, work with your group to develop a hypothesis of how peroxidase is affected by your chosen (or assigned) variable and a method to test it. You must have at least four experimental treatments or treatment levels for approval. Receive approval from your instructor (marked on your assignment) for each of these steps before proceeding.
- State the hypothesis that your group will test. Explain your reasoning that supports your hypothesis.
Hypothesis and methods: Receive approval for your hypothesis and necessary tables from the instructor.
- Define the independent variables you will manipulate and the dependent variables you are testing.
- What will you use as a control or reference standard?
- As you complete your experiment, record your data in Table 3.3 below. Make sure you fill in the treatments for your individual experiment.
| Treatments | 40 seconds | 60 seconds | 80 seconds | 100 seconds | 120 seconds |
|---|---|---|---|---|---|
| Tubes 2 & 3 Treatment: __________ |
|
|
|
|
|
| Tubes 4 & 5 Treatment: __________ |
|
|
|
|
|
| Tubes 6 & 7 Treatment: __________ |
|
|
|
|
|
| Tubes 8 & 9 Treatment: __________ |
|
|
|
|
|
- Once you have collected your data, you will need to input your measurements from Table 3.3 into the Week 3 Excel template located on Canvas. Graph this data in a single graph that includes a scatter plot of data from each of your treatments. Your independent variable should be on the x-axis and dependent variable should be on the y-axis. Fit “best-fit lines” to each treatment using the information provided in Interchapter 4: Using Excel for Data Analysis and Graphing on page 51. The slopes of each line will represent the rate of enzyme activity for each treatment. This Excel file should be uploaded to Canvas and submitted as part of your Week 3 post-lab assignment.
- Once you have your slopes (reaction rates) for each treatment, add them to the appropriate table in the template. Use this to create a derivative plot (rate comparison graph) comparing these treatments by following the appropriate instructions in Interchapter 4: Using Excel for Data Analysis and Graphing on pages 51–55. Your table and graph file will need to be uploaded to Canvas as part of your Week 3 post-lab assignment. The file submitted on Canvas will need to be in Excel format. Remember that each student must create and submit their own Excel data file. Sharing of electronic files would be considered academic dishonesty.
Week 3 Post-Lab Assignment
An Excel file containing the following tables and graphs will need to be submitted on Canvas as part of your Week 3 post-lab assignment.
Tables showing raw data for Experiment 2 (create your own).
Graph showing the raw data (with best-fit lines) for your Experiment 2.
Derivative graph for your Experiment 2.
- Look at your data and briefly summarize your results. Did your results support your hypothesis? If not, why?
- Based on your findings, how does the variable you tested affect the reaction rate of peroxidase? Which of your conditions produced the fastest reaction rate? Which of your conditions limited the reaction rate the most?
- Based on your findings, how could you improve your experiment or what additional experiments could you perform to better understand your results? Why? Answers such as “collect more data” or “use better equipment” will generally be considered insufficient for full credit.
