
4 Fermentation
After this week’s lab, students will be able to:
- Develop a hypothesis and design an experiment to test how environmental conditions affect the rate of fermentation
- Present the results of an experiment on fermentation rates appropriately and accurately in a graph
- Describe how one or more environmental conditions affect fermentation rates
Contribution Points:
 Consult with your TA to receive a stamp at the end of your lab period.
I have completed the necessary tasks required during this week’s lab to earn Contribution Points. I am aware that I may have point(s) deducted from my Contribution Points if my workspace is not appropriately clean at the conclusion of lab.
Resources
- Freeman et al. 2024. Biological Sciences (8th ed.) recommended reading sections 9.1, 9.2, and 9.6 for overview of cellular respiration and fermentation (for a more complete look, read the whole chapter, pp. 201–220).
- Canvas resources.
Background
Cellular respiration and fermentation involve the oxidation of organic molecules, usually carbohydrates or lipids, releasing energy that allows cellular function. Cellular respiration includes many reactions catalyzed by many enzymes, but we can measure the rate of cellular respiration using the following principles:
- identify the inputs (reactant molecules) and outputs (product molecules) of the entire set of reactions
- measure the rate at which one reactant is used or one product is produced
The respiration rate of all the cells in an organism is that organism’s metabolic rate.
Oxidation and Reduction
In chemistry, oxidation refers to the transfer of electrons from one molecule to another. The molecule that accepts electrons is reduced, and the molecule that gives up electrons is oxidized. A general name for such reactions is redox reactions. When electrons are transferred from a higher to a lower energy state in a redox reaction, energy is released that can be used to drive other reactions, like
the synthesis of ATP. Oxidation does not necessarily require oxygen to proceed; oxidation reactions were named because oxygen is a powerful and convenient oxidizing agent, so redox reactions with oxygen (like fire) were the first to be studied.
C6H1206 + 602 → 6 CO2 + 6 H20 + 29 ATP
Cellular respiration can be either anaerobic (molecular oxygen is not involved) or aerobic (molecular oxygen is used). These processes are shown in Figure 4.1.
Anaerobic respiration and fermentation involves 10 – 11 (depending on the organism and the end products) enzyme-catalyzed steps—the reactions of glycolysis. End products of anaerobic respiration vary between organisms, but can include ethanol, organic acids (lactate, fatty acids), methane, and CO2. In yeast, the principal end products are ethanol and CO2, so we can use ethanol or CO2 production to estimate anaerobic respiration. The reactions of anaerobic respiration occur in a cell’s cytoplasm, so anaerobic ATP production is immediately available to drive cytoplasmic reactions (like muscle contraction), even though much of the energy in a sugar molecule cannot be used.
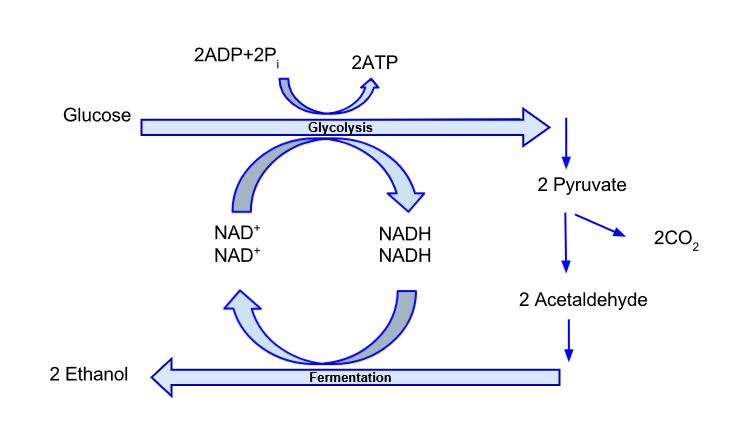
In ethanol fermentation, ~95% of the energy in the fuel molecules (sugars) remains in the ethanol end products, so the ATP yield is low (2 ATP/glucose). That is why we can feed yeast with corn sugar and extract ethanol containing enough energy for biofuels. Currently, a single bushel of corn (25.4kg of shelled kernels) can produce 10.6L of ethanol; however, researchers are investigating methods to increase this yield to 11.4 or more liters per bushel in response to the Renewable Fuel Standard enacted by congress in 2005 and updated in 2007. The standard requires that fuel companies in the U.S. increase the amount of biofuels they mix with non-renewable fuels each year until 2022, at which point the original goal was to use approximately 136 billion liters of biofuels a year. That goal is unlikely to be met, however. In 2019, only ~62 billion liters/year were used. In 2020, due to COVID-19, the amount consumed is estimated to be even lower.
Aerobic respiration involves about 30 enzyme-catalyzed steps—the reactions of glycolysis, the citric acid cycle, and oxidative phosphorylation. In aerobic respiration, a much higher proportion of available energy can be captured in ATP (about 25–36 ATP/glucose) than in anaerobic respiration. Aerobic respiration requires the presence of O2 to serve as the final electron acceptor so we could measure the rate of aerobic respiration by measuring O2 consumption. The end products of aerobic respiration are CO2 and H2O, so we could also measure its rate by measuring CO2 or water production; however, water production is difficult to measure as respiration water is a miniscule fraction of the total water in a cell. The reactions of aerobic respiration take place not in the cytoplasm, but in mitochondria, so it takes more time to increase rates of aerobic ATP production than anaerobic ATP production.
In the following lab you will compare ethanol fermentation by yeast under different environmental conditions. As ethanol fermentation produces CO2 without consuming O2, you can measure fermentation based on the net change in gas within an enclosed space, such as a respirometer.
MEASURING FERMENTATION LAB GUIDE
Materials
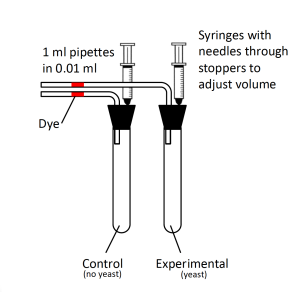
- Respirometers (Figure 4.2)
- Different yeast strains
- Baker’s yeast (Saccharomyces cerevisiae)
- Champagne yeast (S. bayanus)
- White wine yeast 1 (S. cerevisiae)
- White wine yeast 2 (S. cerevisiae)
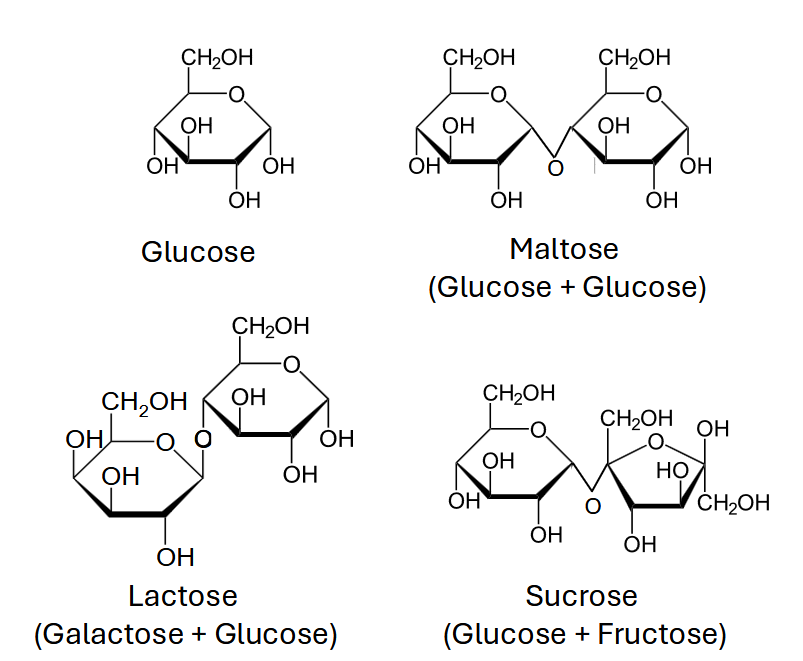
- Sugar stock solutions available for dilution (Figure 4.3)
- pH buffers (pH 3, pH 5, pH 7, pH 9)
- Salt (NaCl) solution available for dilution
Procedure
- BEFORE STARTING, work with your group to develop a hypothesis of how ethanol production via fermentation is affected by a variable of your choice and a method to test it. You must have at least four experimental treatments or treatment levels for approval. Receive approval from your instructor (marked on your assignment) for each of these steps before proceeding.
- State the hypothesis that your group will test and explain your reasoning behind it:
-
- Define the independent variable you will manipulate and the dependent variable you are testing for your experiment with. Is the variable you are testing continuous or discrete? Think about how that will affect the way you display your results.
-
- What will you use as a control or reference standard?
-
- Outline a BRIEF protocol for how you will test your hypothesis in lab:
- Fill each of your experimental test tubes with the following solutions for a total of 35 mL of solution per test tube and fill in Table 4.1 accordingly:
- 10 mL yeast solution (required for all tubes)
- 10 mL sugar solution (required for all tubes)
- Unless you are manipulating the type of sugar used as part of your experiment, use glucose as your default sugar solution.
- 15 mL (total) of the following solutions (you may, but are not required to, mix these solutions as necessary for your experiment; for example: 5 mL of pH buffer, 5 mL of salt solution, and 5 mL water):
- More sugar solution (for a total of ≤ 25 mL)
- pH buffer
- Salt solution
- Water
| Test tube | Yeast strain (10 mL) | Sugar type (10 mL) | Additional Solution (list what is used and how much) (15 mL) | Total volume (35 mL) | Notes |
|---|---|---|---|---|---|
| 1 | 35 mL | ||||
| 2 | 35 mL | ||||
| 3 | 35 mL | ||||
| 4 | 35 mL | ||||
| 5 | 35 mL |
- Mix the solutions in each test tube thoroughly with the wooden stick provided at your station before capping with a rubber stopper and sealing with a Parafilm wax strip. Make sure the plunger in the syringe is set around the half-way mark so you have room to adjust your dye as your experiment progresses. Set your test tubes standing upright in your test tube rack.
- Two factors will change the air pressure within your test tubes: CO2 produced through fermentation will increase the total amount of gas in the test tube and changes in external air pressure due to weather or temperature will change the density of this gas. To control for changes in external air pressure, you will need to construct a thermobarometer, a device used to measure such changes. To do this, prepare an additional tube as in step 2, but using 35 mL of water instead of the various solutions listed. Any change in air pressure within the thermobarometer will be due to changes unrelated to your experiment and can be subtracted from your measurements to calculate the actual amount of CO2 produced in your experimental test tubes. Note: The thermobarometer is a way for you to monitor changes in air pressure that may happen during your experiment. It is not an experimental control, which would be based on the independent variable you are testing.
- After setting up your experiment, wait 10 minutes before starting to allow conditions to reach equilibrium. If you attempt to collect data before this time, you may not get meaningful results.
- As your measurements will consist of a volume of gas, you must adjust for factors that affect gas volume: air pressure and temperature. These adjustments are critical to compare results collected at different times or places. For example, consider how the volume of air in a balloon would change moving from Ames to Mt. Everest, or as a low pressure weather system approaches. You will adjust your data for these factors later, but first record the room temperature and pressure in the space below before you begin collecting data.
- Lab temperature (Tmeas): ________°C
- Lab air pressure (Pmeas): ________ inHg
- Use a long-tipped pipette to place a small bead of dye in the pipette extending from the stopper in each test tube (Figure 4.2). You do not need to place the dye exactly at 0 mL at this point; you will be able to adjust the location at the start of your experiment later using the syringe in the stopper.
- Set the dye in the pipette to 0 mL using the syringe: pull up on the plunger to move the dye toward the test tube and press down to move it away from the test tube.
- Read the position of the dye in the pipettes every two minutes for at least 14 minutes and record these values in Table 4.2. If you do not see any change in this time, or if you see a change of less than 0.05 mL, consult with your TA before proceeding.
- NOTE: The pipettes are marked in major units of 0.1 mL (large marks) and minor units of 0.01 mL (small marks). Estimate the location of the dye bead to the nearest 0.005 mL.
- If you are concerned about the dye in your pipettes falling out, use the syringe to move the dye back to 0 and add its previous progress to its new position. For example, if you moved the dye to 0 when it reached 0.6 mL and at the next time point the dye is at 0.1 mL, then the total CO2 production up to that point is 0.6 mL + 0.1 mL = 0.7 mL.
- The changes you observed in the test tubes containing yeast are the result of two factors: the production of CO2 by the yeast and changes in air pressure and temperature. To control for changes in air pressure and temperature, subtract your thermobarometer readings from your treatment readings in Table 4.2.
| Treatment | 0 min | 2 min | 4 min | 6 min | 8 min | 10 min | 12 min | 14 min | |
|---|---|---|---|---|---|---|---|---|---|
| Yeast (Y) | |||||||||
| Thermobarometer (TB) | |||||||||
| Corrected (Y-TB) | |||||||||
| Yeast (Y) | |||||||||
| Thermobarometer (TB) | |||||||||
| Corrected (Y-TB) | |||||||||
| Yeast (Y) | |||||||||
| Thermobarometer (TB) | |||||||||
| Corrected (Y-TB) | |||||||||
| Yeast (Y) | |||||||||
| Thermobarometer (TB) | |||||||||
| Corrected (Y-TB) | |||||||||
| Yeast (Y) | |||||||||
| Thermobarometer (TB) | |||||||||
| Corrected (Y-TB) | |||||||||
Clean-Up
- Dump the contents of your test tubes down the drain, wash them with soap and water, and set them upside down in your test tube rack to dry.
- Rinse the dye out of the pipettes with tap water. Dry the inside of your pipettes using the compressed air hose at designated stations in the lab while keeping the pipette pointed into the trash receptacle at the drying station. Please wear the safety goggles available in lab while completing this task. Make sure you wipe up any dye that you spill.
- Return any additional supplies to their correct location and throw away any garbage generated.
Analysis
- Utilize the instructions in the Excel Inter-Chapter (pages 51–55) to complete the graphs required for this week’s assignment.
- Use Excel to plot your data from Table 4.2 in a single graph that includes scatter plots of CO2 produced as a function of time for each of your treatments and fit straight lines (in Excel, use the ‘Trendline’ tool) to each dataset. The slopes of these trendlines are your Vmeas values and they represent the fermentation rates (mL of CO2 produced/min) in each treatment. Attach your graph to the assignment.
| Treatment | Vmeas (mL CO2/min) |
|---|---|
- As mentioned previously, the temperature and air pressure in the room can affect your results, which is why a thermombarometer is used to detect any changes in these values over the course of the experiment and to be able to correct for them. The specific values of temperature and external air pressure during your experiment would also make it difficult to compare your results to those of other experiments unless the values are standardized. Before you can fully analyze your results, you must standardize your data so that researchers at different times and locations can compare their results to your own (see step 6 in the procedure above). To do this, you must convert your measurements to standard temperature and pressure (STP), or the volume that the gas would occupy at 760 Torr (the average atmospheric pressure at sea level) and 273 degrees Kelvin (0 °C). If you have not already done so, record the temperature and air pressure in lab in the space provided above. Once you have these values, convert the fermentation rates (mL of CO2 produced/min) you calculated in your raw data plot (Vmeas) to standard temperature and pressure (VSTP, see equation below). Fill out Table 4.3 in the assignment.
NOTE: Before you use this equation, Tmeas and Pmeas must be in units of degrees Kelvin (K) and torr (Torr), respectively. If you need to convert your measurements you can do so with the following equations:
Tmeas = K = ____ °C + 273.15
torr = 25.40 × ____ in Hg
[latex]V_{meas} \times \frac{273 K}{T_{meas}} \times \frac{P_{meas}}{760 Torr} = V_{stp}[/latex]
A tutorial video is posted on Canvas to help you understand how to complete this conversion.
- Use Excel to plot a derivative (rate of change) graph illustrating how the rate of CO2 production (STP-adjusted values) changes with treatment. You should use the VSTP values (last column of Table 4.4) in your derivative graph. If you used a continuous variable for your treatment, include a trendline that best describes the relationship between the net rate of CO2 production and your treatment variable. You will need to upload your Excel file to Canvas for submission.
RESULTS
- Upload your graph plotting the raw data from Table 4.2 with associated trendlines to the Week 4 post-lab assignment on Canvas.
- Fill in Table 4.4 below, converting the raw slopes for each of your treatments to standard temperature and pressure using the formula in excel.
| Treatment | Vmeas (mL/min) | 273 K/Tmeas | Pmeas/760 Torr | VSTP (mL@STP/min) |
|---|---|---|---|---|
- Upload your derivative (rate of change) plot to the Week 4 post-lab assignment on Canvas.
What was your hypothesis? Was it supported or refuted? Why? What evidence can you show from your experiment to support your statement?
