
5 Investigating Photosynthesis
Following this week’s lab, students will be able to:
- Describe the function and absorption spectrum of chlorophyll
- Develop a hypothesis and design an experiment to test how the rate of photosynthesis varies under different conditions
- Present the results of an experiment on photosynthetic rates appropriately and accurately in a graph
- Describe how one or more environmental conditions or plant characteristics affect the rate of photosynthesis
Contribution Points:
 Consult with your TA to receive a stamp at the end of your lab period.
I have completed the necessary tasks required during this week’s lab to earn Contribution Points. I am aware that I may have point(s) deducted from my Contribution Points if my workspace is not appropriately clean at the conclusion of lab.
Resources
- Overview of the anatomy, physiology, and types of photosynthesis: Freeman et al. 2024. Biological Science (8th Ed.). Chapter 10, pp. 222–241.
- Canvas resources.
PART I: Absorption Spectrum
Background
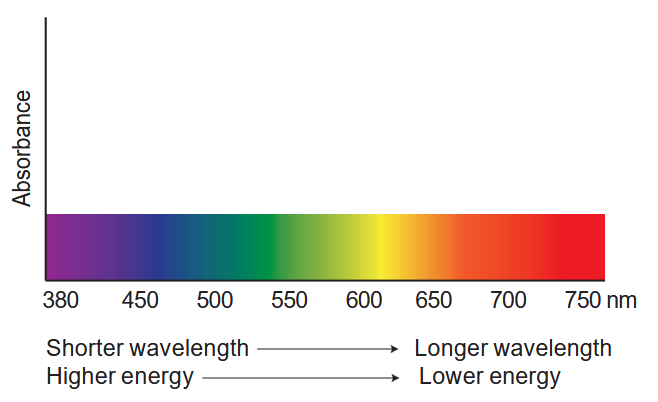
In this exercise you will determine the light absorption properties of chlorophyll. The porphyrin head of a chlorophyll molecule absorbs some wavelengths of light for use in photosynthesis while reflecting others. Using a spectrophotometer to measure absorbance of chlorophyll at different wavelengths, you will determine the absorption spectrum for this compound. Before you begin, you should make some predictions about the absorbance properties of chlorophyll.
Pigments in Photosynthesis
- What should the absorption spectrum (plot of absorbance vs. wavelength) of chlorophyll look like?
- Make a sketch to illustrate your answer below.
Procedure
- Zero the spectrophotometer using petroleum ether as a blank.
- Work with your group to measure the absorbance of the chlorophyll extract at 20 nm intervals beginning at 400nm, recording your observations in Table 5.1. Each group member should take a turn to measure and record a subset of the values. If there are three members of your group, each student should measure and record a third of the values in Table 5.1. You should then pool your results so that everyone has a complete table. Remember to zero the spectrophotometer with the petroleum ether blank for each new wavelength before measuring the absorbance of chlorophyll.
- At each wavelength, record the color of light used in the spectrophotometer. You can do this by inserting a narrow strip of white paper into the sampling chamber and looking at it with your hands cupped to block out light from the lab. Record the color you see at each wavelength in Table 5.1. NOTE: If you are using the Genesys30 Spectrophotometers, you will need to blank the spectrophotometer at each wavelength before you will be able to view the light color.
Analysis
- Use Excel to plot your light absorption spectrum for chlorophyll (include title, units of measurement and axis labels). Attach your graph to the assignment. Follow the instructions for “standard curve” that you utilized in the Week 2 Quantitative Techniques chapter.
- Compare your graph of the absorbance spectrum for chlorophyll with the prediction you made earlier in lab. Was your prediction close? Why or why not?
- At what wavelengths do you predict photosynthesis would be more productive? Now look at the action spectrum of photosynthesis in the Freeman textbook (page 219). Does the action spectrum support your prediction?
| Wavelength (nm) | Light color | Absorbance |
| 400 | ||
| 420 | ||
| 440 | ||
| 460 | ||
| 480 | ||
| 500 | ||
| 520 | ||
| 540 | ||
| 560 | ||
| 580 | ||
| 600 | ||
| 620 | ||
| 640 | ||
| 660 | ||
| 680 |
Part II: Photosynthetic Rate
Materials
- Respirometers
- Plants (Figure 5.1)
- NaHCO3 solution available for dilution
- Portable lights
- Measuring tape/meter sticks
- Photometers
Background
[latex]6CO_{2} + 12H_{2}0 \xrightarrow[\text{Chlorophyll}]{\text{Light + }} C_{6}H_{12}O_{6} + 6H_{2}0 + 6O_{2}[/latex]
Carbon dioxide + Water → Light + Chlorophyll → Glucose (sugar) + Water + Oxygen
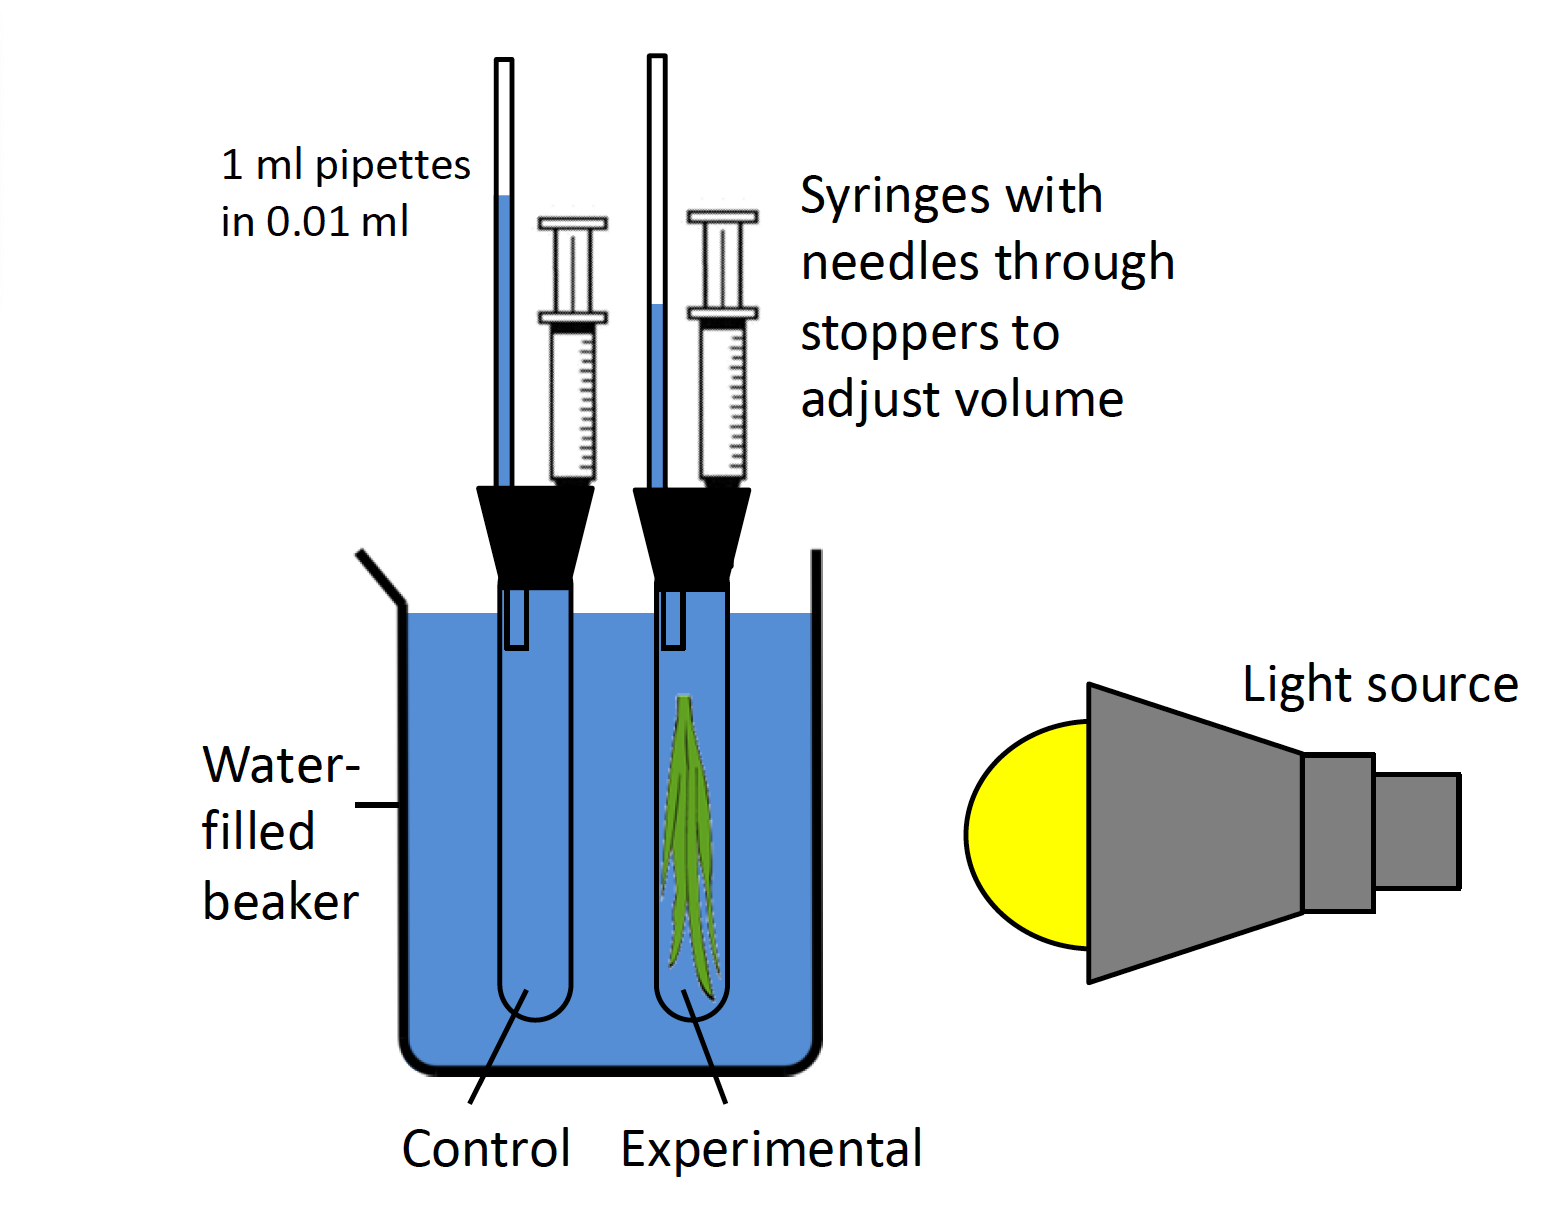
You will test how photosynthetic rates change under different conditions using one or more of the aquatic plants available in lab. All of these plants use CO2 that has dissolved into the water, emitting O2 as a by-product of photosynthesis. As O2 is less soluble than CO2, small bubbles of O2 will form on the plants. When enclosed in a container like the respirometers you used in the respiration lab, these bubbles displace water and force it to move through a pipette, allowing you to measure O2 production (see Figure 5.2).
Procedure
- BEFORE STARTING, work with your group to develop a hypothesis of how photosynthesis is affected by a variable that is available in lab and a method to test it. You must have at least four experimental treatments or treatment levels for approval. Receive approval from your instructor for each of these steps before proceeding.
- State the hypothesis that your group will test. Explain your reasoning for this hypothesis:
-
- Define the independent variable you will manipulate and the dependent variable you are testing for your experiment with. Is the variable you are testing continuous or discrete? Think about how that will affect the way you display your results.
-
- Outline a BRIEF protocol for how you will test your hypothesis in lab:
- Obtain a piece of an aquatic plant 5−6 inches long, cutting the basal end and placing the shoot in a test tube, cut end up. If the shoot is so large that it must be forced into the test tube it will shade itself and reduce the rate of photosynthesis.
- Fill the test tube with sodium bicarbonate solution (the source of CO2 for the plants) and cap the tube with a rubber stopper holding a curved pipette. Do not use water to fill your tubes, unless explicitly addressed in your experimental design. The end of the pipette in the test tube should be submerged in the solution or else you will not be able to measure O2 production. Dry the outside of the tube and seal the top of the tube with Parafilm. If the tube is not sealed or if the stopper moves, you will not get good measurements. Make sure the plunger in the syringe is set at about the half-way point so it can be used.
- Prepare a second tube as in step 2–3, but without a plant, to serve as the thermobarometer (a control tube used to detect changes in temperature and pressure). Fill this tube with sodium bicarbonate unless you change the type of solution used in the test tube with the plant. If that is the case, you will need to adjust your solution in the thermobarometer so as to maintain an appropriate control. Note: The thermobarometer is a way for you to monitor changes in air pressure that may happen during your experiment. It is not an experimental control, which would be based on the independent variable you are testing.
- Suspend both tubes in a beaker filled with water from a clamp rod. As this beaker will buffer the test tubes from changes in temperature during your experiment, it is very important that you submerse the tubes as far as possible. If there are any markings on your test tubes, turn them so the markings face away from the light source to avoid shading.
- After setting up your experiment, wait ten minutes before starting to allow conditions to reach equilibrium. If the fluid in the pipettes moves during this time, you can reset it to zero using the syringes. NOTE: You should keep your light o! during the equilibration period. You can place any tubes that you have set up but are not currently using at the equilibration station while you are waiting.
- After reaching equilibrium, record the room temperature and pressure below.
- Room Temp: _____________°C
- Pressure: ______________inHg
- Turn the light on and read the position of the fluid in the pipettes every two minutes for at least ten minutes and record these values in Table 5.2. If you do not see any change, or if you see a change of less than 0.05 mL, consult with your TA before proceeding.
- The changes you observed in the test tube containing the plant are the result of two factors: the production of O2 by the plant and changes in air pressure and temperature. To control for changes in air pressure and temperature, subtract your thermobarometer readings from your plant readings in Table 5.2.
- Repeat steps 2−9 for your other treatments.
- When you are finished with a plant, gently pat it dry and measure its mass before returning it to the appropriate tank. DO NOT RUB PLANTS DRY as this may damage or kill the plant. Record plant mass below and in Table 5.3.
| Test tube* | Treatment** | Plant Species | NaHCO3 concentration | Notes |
|---|---|---|---|---|
| 1 | ||||
| 2 | ||||
| 3 | ||||
| 4 | ||||
| 5 |
*Note: Depending on your independent variable, it may be better to use the same test tube/plant for each treatment. If that is the case for your variable, make a note of it.
**Depending on your independent variable, this column may be duplicated by one of the other columns in this table.
| Treatment | Category | 0 min | 2 mins | 4 mins | 6 mins | 8 mins | 10 mins |
|---|---|---|---|---|---|---|---|
| Plant (P) | |||||||
| Thermobarometer (TB) | |||||||
| Corrected (P – TB) | |||||||
| Plant (P) | |||||||
| Thermobarometer (TB) | |||||||
| Corrected (P – TB) | |||||||
| Plant (P) | |||||||
| Thermobarometer (TB) | |||||||
| Corrected (P – TB) | |||||||
| Plant (P) | |||||||
| Thermobarometer (TB) | |||||||
| Corrected (P – TB) | |||||||
| Plant (P) | |||||||
| Thermobarometer (TB) | |||||||
| Corrected (P – TB) |
| Plant | Mass (g) |
|---|---|
Measuring Light Intensity (Optional)
You may need to measure light intensity as an experimental variable for your experiment. If so, the following procedure will help you through this process.
- Measure light intensity using a Quantum light meter (photometer). These meters measure light intensity as photosynthetic photon flux (PPF), or the number of photons of photosynthetically active light, per unit area, per unit time. The units of this measurement are micromoles of photons per square meter per second (µmol m-2*s-1) for photosynthetically active radiation (PAR) in the range of 400 to 700 nm.
- To make a reading, turn the meter on. The sensor is the white dome at the top end of the meter. Position the sensor dome at the spot where the plant will be located during the measurement, and point it directly at the light source. Due to variation in lights and reflections from the desktop and sink, light intensity is not uniform at all heights. Therefore, measure light intensity at three different heights above the tabletop—about 5 cm, 9 cm, and 13 cm above the table (Figure 5.3), and take the average of those three measurements to represent light intensity. You may use the wood blocks to set the light meter at the appropriate height.
- The light meters are very sensitive to the direction of the incoming light and need to be pointed directly at the light source. Aiming them a few degrees away will underestimate light intensity from your lamp.
- Do not put the photometer in water. Mark the position where the plant will be during the photosynthesis measurements using a piece of tape, move the water bath and plant, measure the light intensity, and move the plant back into position. Record your data in Table 5.5, and use the average at each distance for your analysis. When you finish measuring light intensity, move the water bath and plant back into the light path.
| Treatment | Height = 5 cm | Height = 9 cm | Height = 13 cm | Average |
|---|---|---|---|---|
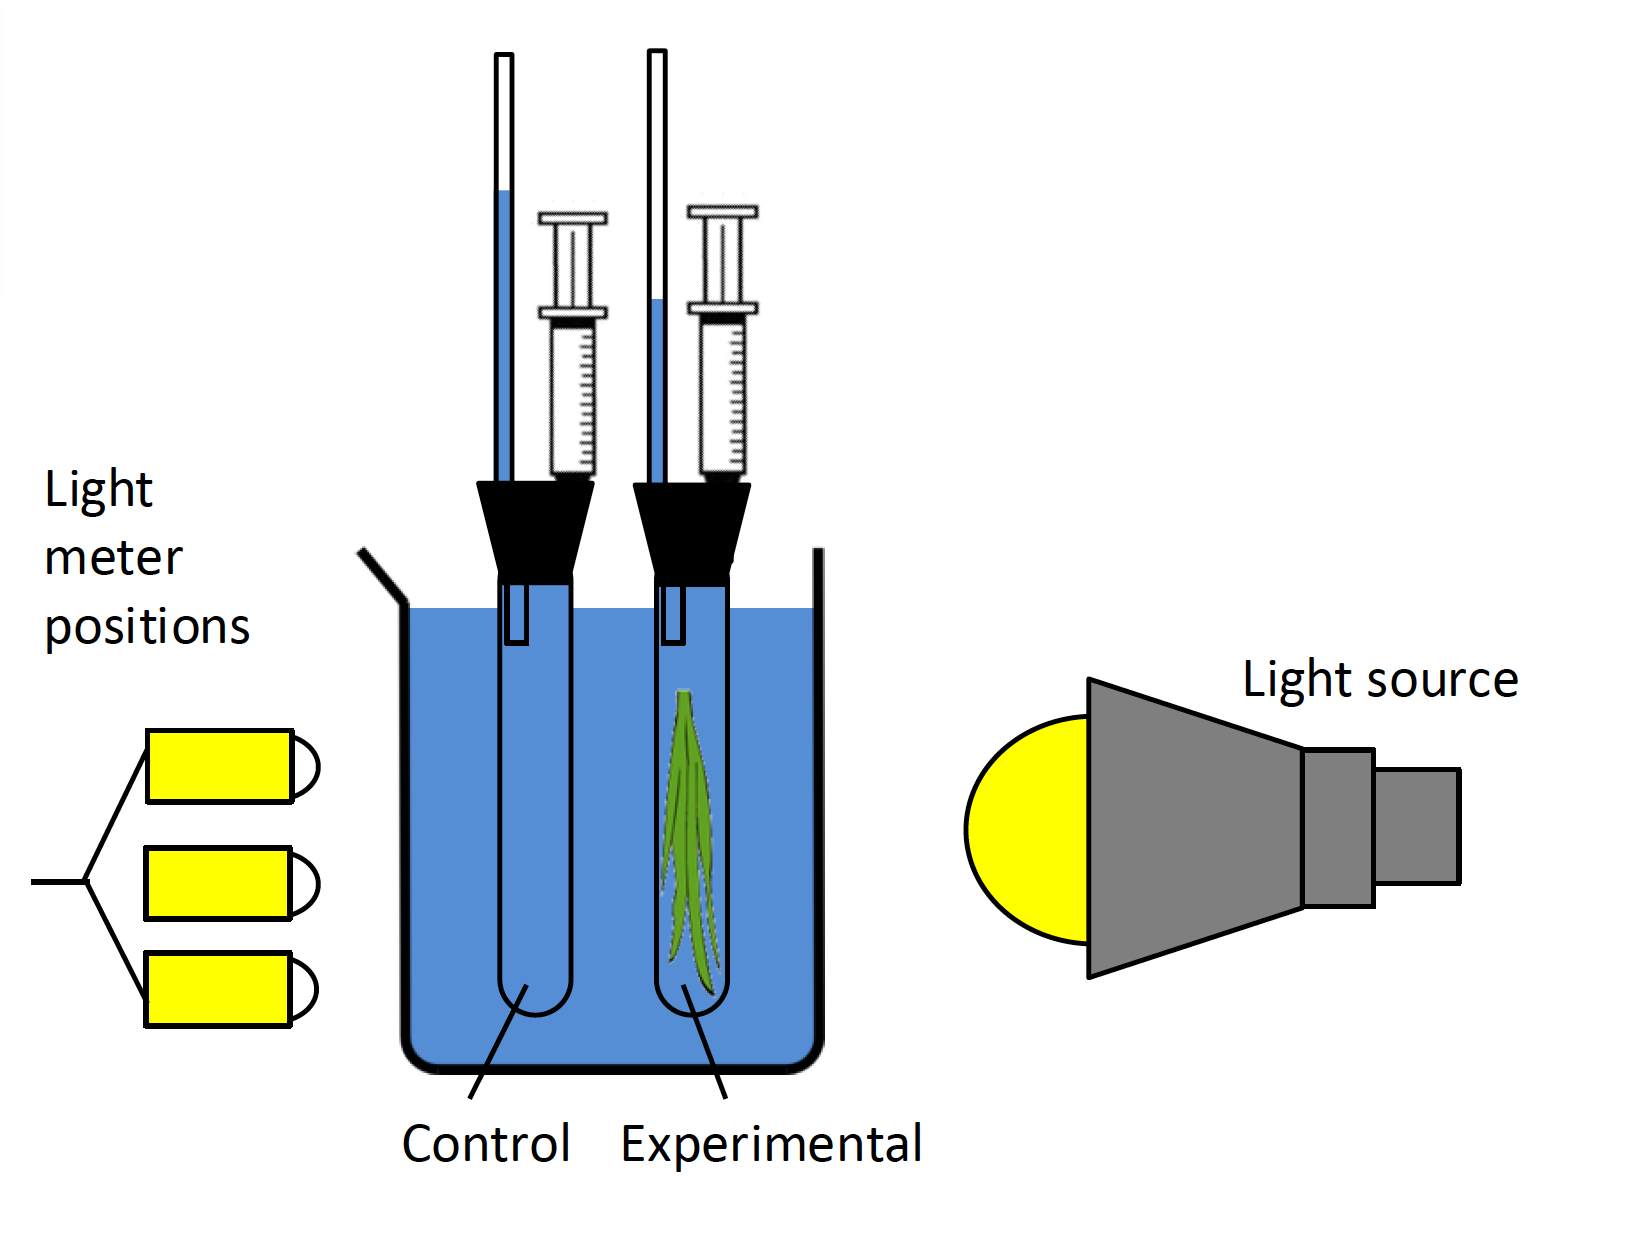
NOTE: Do not place your light meter in the water! The illustration above shows where you should take light intensity readings.
Analysis
- To complete this part of the lab activity, please read through the Using Excel for Data Analysis and Graphing Interchapter for instructions (pages 51–55).
- Use Excel to plot your data from Table5.3 in a single graph that includes scatter plots of oxygen production as a function of time for each of your treatments and fit straight lines (use the ‘Trendline’ tool) to each dataset. Attach your graph to the assignment. The slopes of these lines provide you with Vmeas values.
| Treatment | Vmeas (mL O2/min) |
|---|---|
- Record the temperature and air pressure in lab and convert the raw slopes from the previous step (rates of oxygen production, Vmeas) for each of your treatments to standard temperature and pressure (VSTP, see equation below). Divide the STP slope by the plant mass to find the mass- specific STP slope. Fill out Table 5.6 in the assignment for this lab for full credit.
NOTE: You may need to convert some of your values before using this equation.
[latex]V_{meas} \times \frac{273 K}{T_{meas}} \times \frac{P_{meas}}{760 Torr} = V_{STP}[/latex]
Lab temperature (Tmeas):
Lab air pressure (Pmeas):
NOTE: Before you use this equation, Tmeas and Pmeas must be in units of degrees Kelvin (K) and torr (Torr), respectively. If you need to convert your measurements you can do so with the following equations:
K = _____ °C + 273.15
torr = 25.40 × ____ inHg
- Use Excel to plot a derivative (rate of change) graph illustrating how the rate of oxygen production (mass-specific, STP’adjusted values) changes with treatment. You should use mass-specific VSTP values (last column of Table 5.7) in the derivative graph. If you used a continuous variable for your treatment, include a trendline that best describes the relationship between the net rate of oxygen production and your treatment variable. You will need to upload your Excel file to Canvas for submission. Read the Excel Inter-Chapter for more information on how to construct a derivative plot.
Results: Part I: Absorption Spectrum
- Upload your graph of light absorption spectrum for chlorophyll to the Week 5 post-lab assignment on Canvas.
- Use this plot to predict the color(s) of light that is/are most active in stimulating photosynthesis. Write your prediction, and explain in writing how your data justify your prediction below.
Results: Part II: Photosynthetic Rate
- Upload your graph plotting data from Table 5.2 with associated trendlines to the Week 5 post-lab assignment on Canvas.
- Fill Table 5.7 below, converting the raw slopes for each of your treatments to standard temperature and pressure. Divide the STP slope by the plant mass to find the mass-specific STP slope.
| Treatment | Vmeas (mL/min) | 273 K/Tmeas | Pmeas/760 Torr | VSTP(mL@STP/ min) | Plant mass (g) | Mass- specific VSTP (mL@STP/min/g) |
- Upload your derivative (rate of change) plot to the Week 5 post-lab assignment on Canvas.
- Was your hypothesis supported or refuted by your data? Why?
