
11 Circulatory System
Following this week’s lab, students will be able to:
- Identify structures and describe the function of the mammalian circulatory system
- Recount the pathway that blood flows through the heart and the major vessels in the mammalian circulatory system and state at which points blood is oxygenated and deoxygenated
- Identify blood cell types and describe their functions
- Measure human heart rates and blood pressures and explain how these values relate to human health
- Demonstrate proper dissection technique and respect for animal specimens and dissection tools
Contribution Points:
 Consult with your TA to receive a stamp at the end of your lab period.
I have completed the necessary tasks required during this week’s lab to earn Contribution Points. I am aware that I may have point(s) deducted from my Contribution Points if my workspace is not appropriately clean at the conclusion of lab.
Your TA will check that you have attempted to complete the dissections associated with this week’s lab activity.
Resources
- Dissection Interchapter 6 “Dissection Techniques and Terminology” (pp. 137–140)
- Fetal pig dissection tutorial video (tutorial video on Canvas)
- Fetal pig dissection guide, Smith and Schenk 2011 (provided in binders for use in lab)
- Biological Science, Freeman et al. 2024 (8th edition)
- Circulatory System (42.5)
- Internet and Canvas resources
![]() This icon represents a question meant to test your understanding. Answering these questions in the space provided as you go through the lab will help you better understand the topic and study more effectively. Use your text or e-book, pig dissection guide, and the internet to help you.
This icon represents a question meant to test your understanding. Answering these questions in the space provided as you go through the lab will help you better understand the topic and study more effectively. Use your text or e-book, pig dissection guide, and the internet to help you.
Part 1: Blood Pressure and Heart Rate Lab Activity
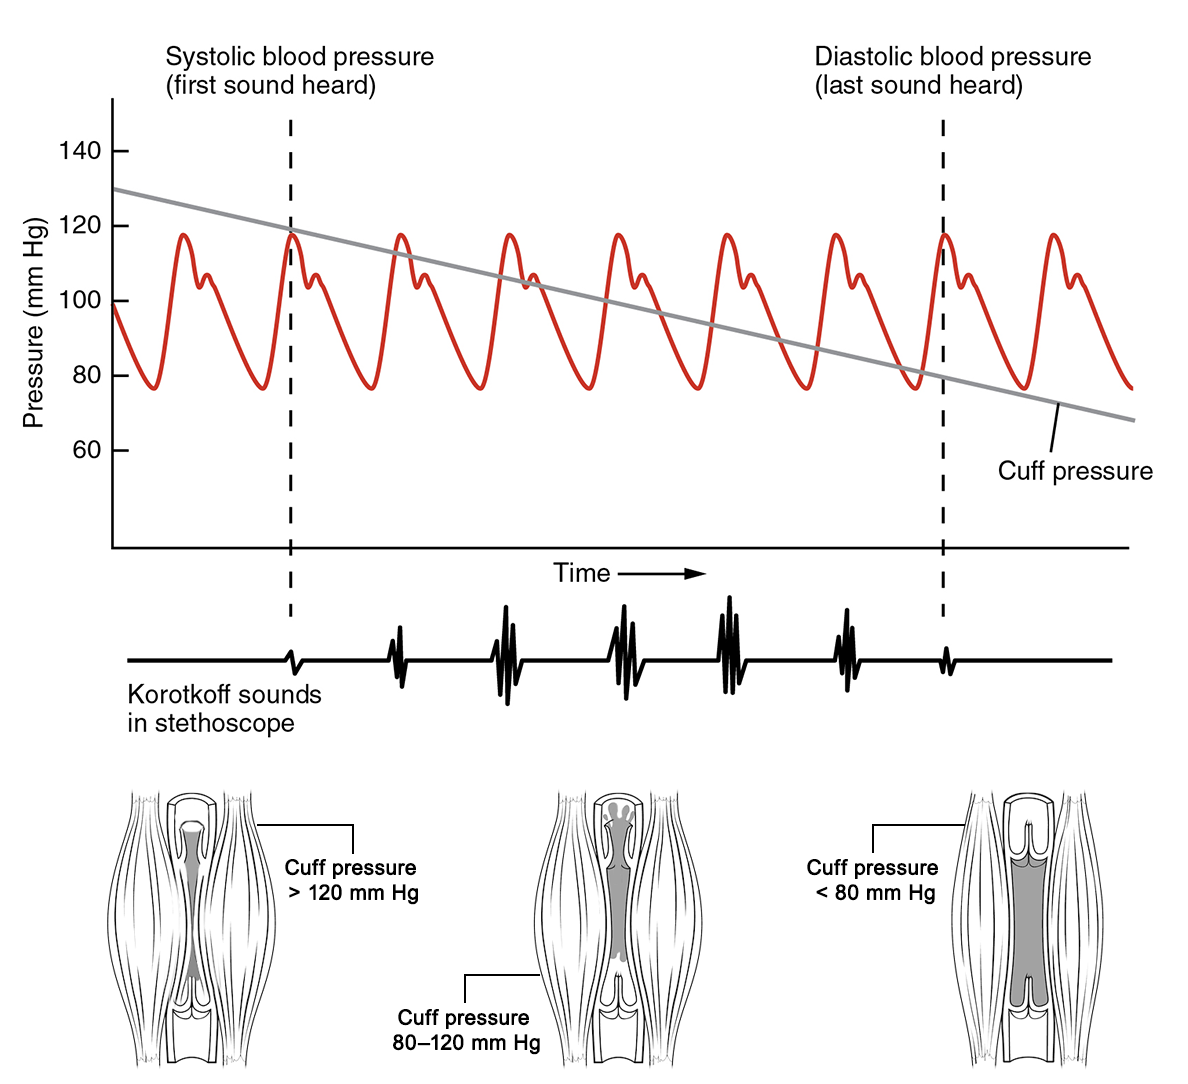
During contraction and relaxation of the heart, the pressure of blood in the arteries changes depending on the stage of the cycle. The ventricles of the heart contract to push blood into the arteries and then relaxes to fill with blood before pumping once more. When the heart pushes blood into the arteries there is a sudden increase in pressure. Then, when the heart muscle relaxes, blood pressure declines slowly until the heart contracts again. Blood pressure is at its highest (systolic pressure) shortly after contraction begins and at its lowest (diastolic pressure) at the end of relaxation just before the ventricle contracts again. When you see a blood pressure reading, the first number is the systolic pressure and the second number is the diastolic pressure. Both pressures are measured in units of millimeters of mercury (mm Hg). The table below shows National Institutes of Health values for normal, prehypertension, and high blood pressure categories.
|
Category |
SystolicPressure (mmHg) |
DiastolicPressure (mmHg) |
|
Normal |
<120 |
<80 |
|
Prehypertension |
120–139 |
80–89 |
|
High blood pressure |
>140 |
>90 |
|
Hypotension |
<90 |
<60 |
In this lab, you will get to measure your blood pressure by using an inflatable cuff to apply external pressure around the upper arm to collapse the brachial artery and block blood flow to the forearm. You will record the applied pressure and record blood flow to a finger or thumb using the PowerLab and the Lumiscope.
PowerLab Activity Data
Blood Pressure and Heart Rate Activity
- Enter your data from the Lumiscope blood pressure monitor. Include units of measurement.
-
- Systolic Pressure:
- Diastolic Pressure:
- Heart Rate:
- Enter the data you collected to measure your heart rate (pulse) from your Chart recording described on page 160. Include units of measurement.
-
- Time of first detectable heartbeat:
- Time of final detectable heartbeat:
- Calculated heart rate:
- Are these pressures above, within, or below the “normal” blood pressure range for young adults?
- Based on what you have learned about the cardiovascular system, why is high blood pressure bad for your health?
Part 2: What Factors Affect Blood Pressure and Heart Rate?
CREATE YOUR OWN EXPERIMENT
Use the guide below to create your experiment.
For this activity, you only need to take readings from one of your group members. After you have completed the in-class activity and before you move on to dissections, create your own blood pressure experiment and carry it out in your group using the information provided below. Record your hypotheses, protocol, and data in the following document. Once completed, you can move on to the Circulatory system dissections and stations.
TEST A HYPOTHESIS
In your group, brainstorm some potential variables that may affect blood pressure and heart rate. Be prepared to share your idea with the class. Your TA will compile some options on the board and your group can choose one that is most interesting to you. Once you have decided on a variable, answer the questions below before you test your experiment.
- Choose one of these variables to test in lab. How will your variable affect blood pressure and/or heart rate? Below, identify the independent and dependent variables, and write a short hypothesis and protocol. Compare your experimental values to the values you already collected in lab.
Independent Variable(s):
Dependent Variable(s):
Hypothesis:
Brief Protocol:
| Variable | Predicted effect (increase ordecrease) | Resting value | Experimental value | Was your prediction correct? |
|
Heart rate |
|
|
|
|
|
Systolic pressure |
|
|
|
|
|
Diastolic pressure |
|
|
|
|
- Carry out your experiment. Use the Table 11.2, above, to enter your predictions and results. Fill in the resting value column with the data you collected in the beginning of the lab. Include units of measurement with your data!
- Compare your results to the hypothesis you wrote out in #2. Did your experimental results support your predicted effects on heart rate and/or blood pressure? Why or why not? What could be done to improve or expand your experiment in the future?
Part 3: Circulatory Dissections and Stations
1. Circulatory System Dissection
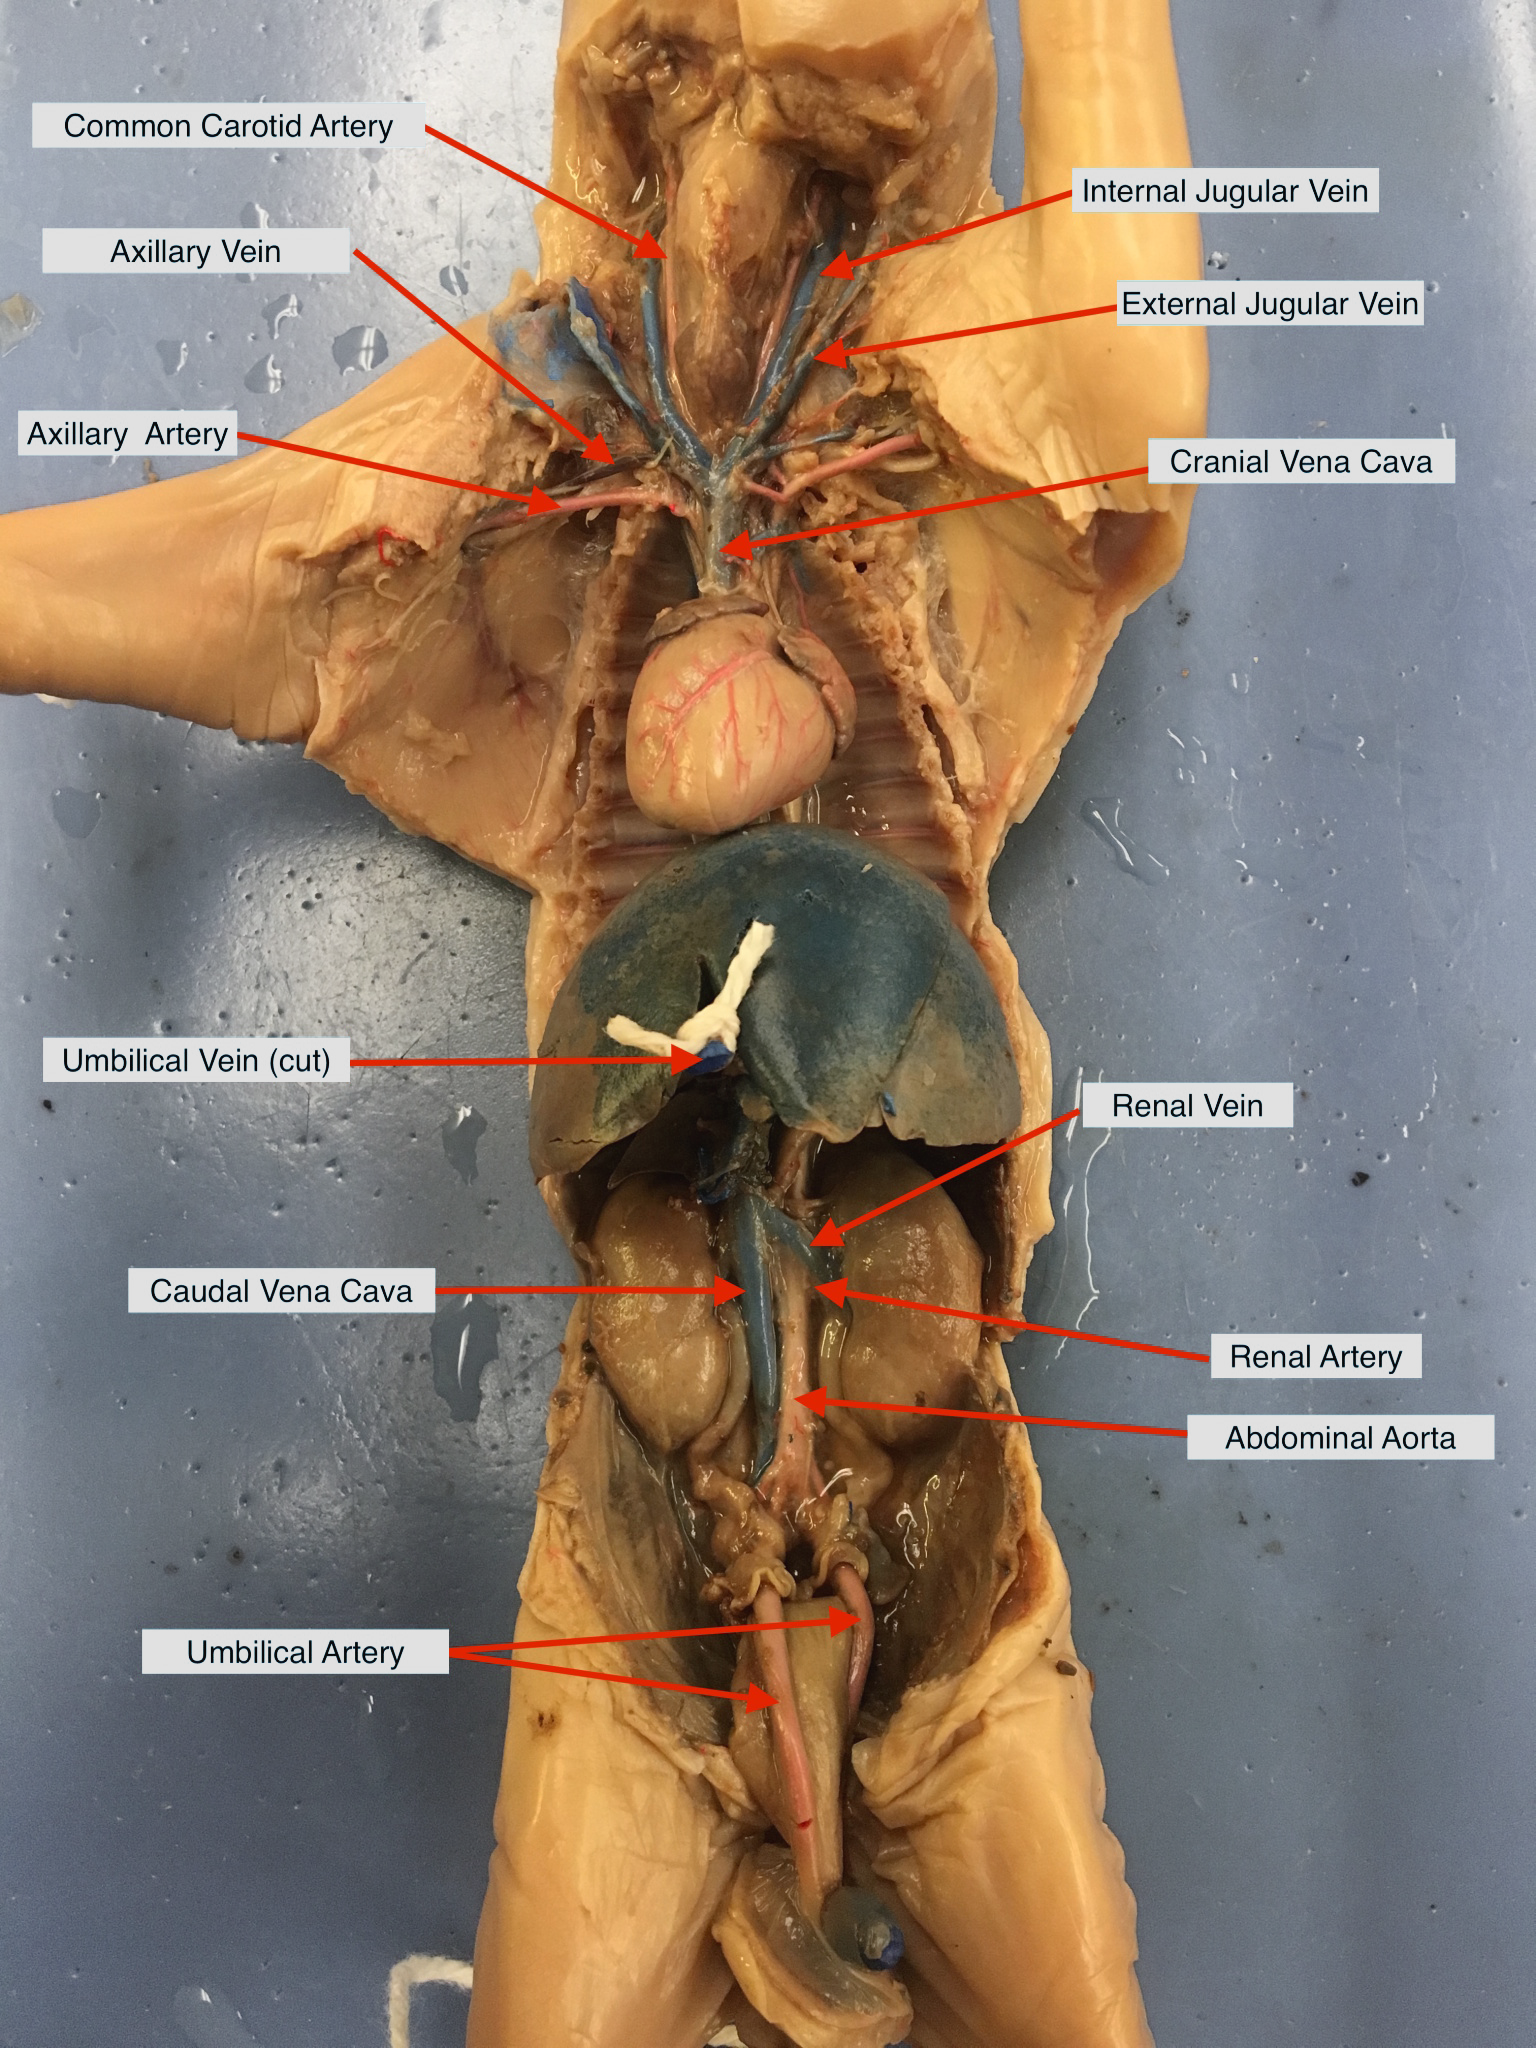
Carefully remove the following organs from the abdomen of your pig: intestines, stomach, liver, gall bladder, pancreas, spleen, bladder, thymus, and thyroid. Do not remove the lungs from your fetal pig, since you will study the respiratory system next week. Using your dissecting tools, remove connective tissue surrounding the remaining organs as needed to show the veins and arteries of your pig. If you haven’t already, remove the tissue from your pig’s neck and chest to expose the carotid and jugular veins. Identify the veins and arteries in your pig using the diagram below. You can also check out the demo dissection provided in lab to test yourself. Put a check mark next to each vein and artery as you find it.
![]() What color are the veins and arteries in your pig?
What color are the veins and arteries in your pig?
Vein color:
Artery color:
Note: The arteries and veins have been injected with colored latex so that you can easily differentiate them in the fetal pigs. In life, blood is always red due to the hemoglobin found in red blood cells. When hemoglobin is bound to oxygen, it is bright red and when it is not bound to oxygen, it is darker red.
![]() The definition of an artery is any vessel taking blood away from the heart. The definition of a vein is any vessel carrying blood towards the heart. What does the color of the veins and arteries in the fetal pig indicate about oxygenation levels in most arteries vs. most veins? Why does this make sense in terms of the function of the heart and circulatory system?
The definition of an artery is any vessel taking blood away from the heart. The definition of a vein is any vessel carrying blood towards the heart. What does the color of the veins and arteries in the fetal pig indicate about oxygenation levels in most arteries vs. most veins? Why does this make sense in terms of the function of the heart and circulatory system?
![]() Should umbilical and pulmonary veins and arteries match the color-coding scheme of the other arteries and veins in the body? Why or why not?
Should umbilical and pulmonary veins and arteries match the color-coding scheme of the other arteries and veins in the body? Why or why not?
![]() Where does gas exchange occur for fetal pigs? Which blood vessel (the umbilical artery or vein) carries oxygenated blood?
Where does gas exchange occur for fetal pigs? Which blood vessel (the umbilical artery or vein) carries oxygenated blood?
2. Heart Structure and Function
Use the stations provided in lab to observe the heart models and the demonstration dissection of an adult pig heart. Using your dissection guide and the information provided at the station, identify the parts of the heart in the diagram below. Make sure you can identify structures in both the model and the actual heart.
![]() Use red and blue markers or highlighters to trace the path of blood through the heart. Use blue to represent deoxygenated blood and red to represent oxygenated blood.
Use red and blue markers or highlighters to trace the path of blood through the heart. Use blue to represent deoxygenated blood and red to represent oxygenated blood.
![]() Carefully remove the heart from your fetal pig and cut it in half longitudinally. Look at the chambers of the heart and trace blood flow.
Carefully remove the heart from your fetal pig and cut it in half longitudinally. Look at the chambers of the heart and trace blood flow.
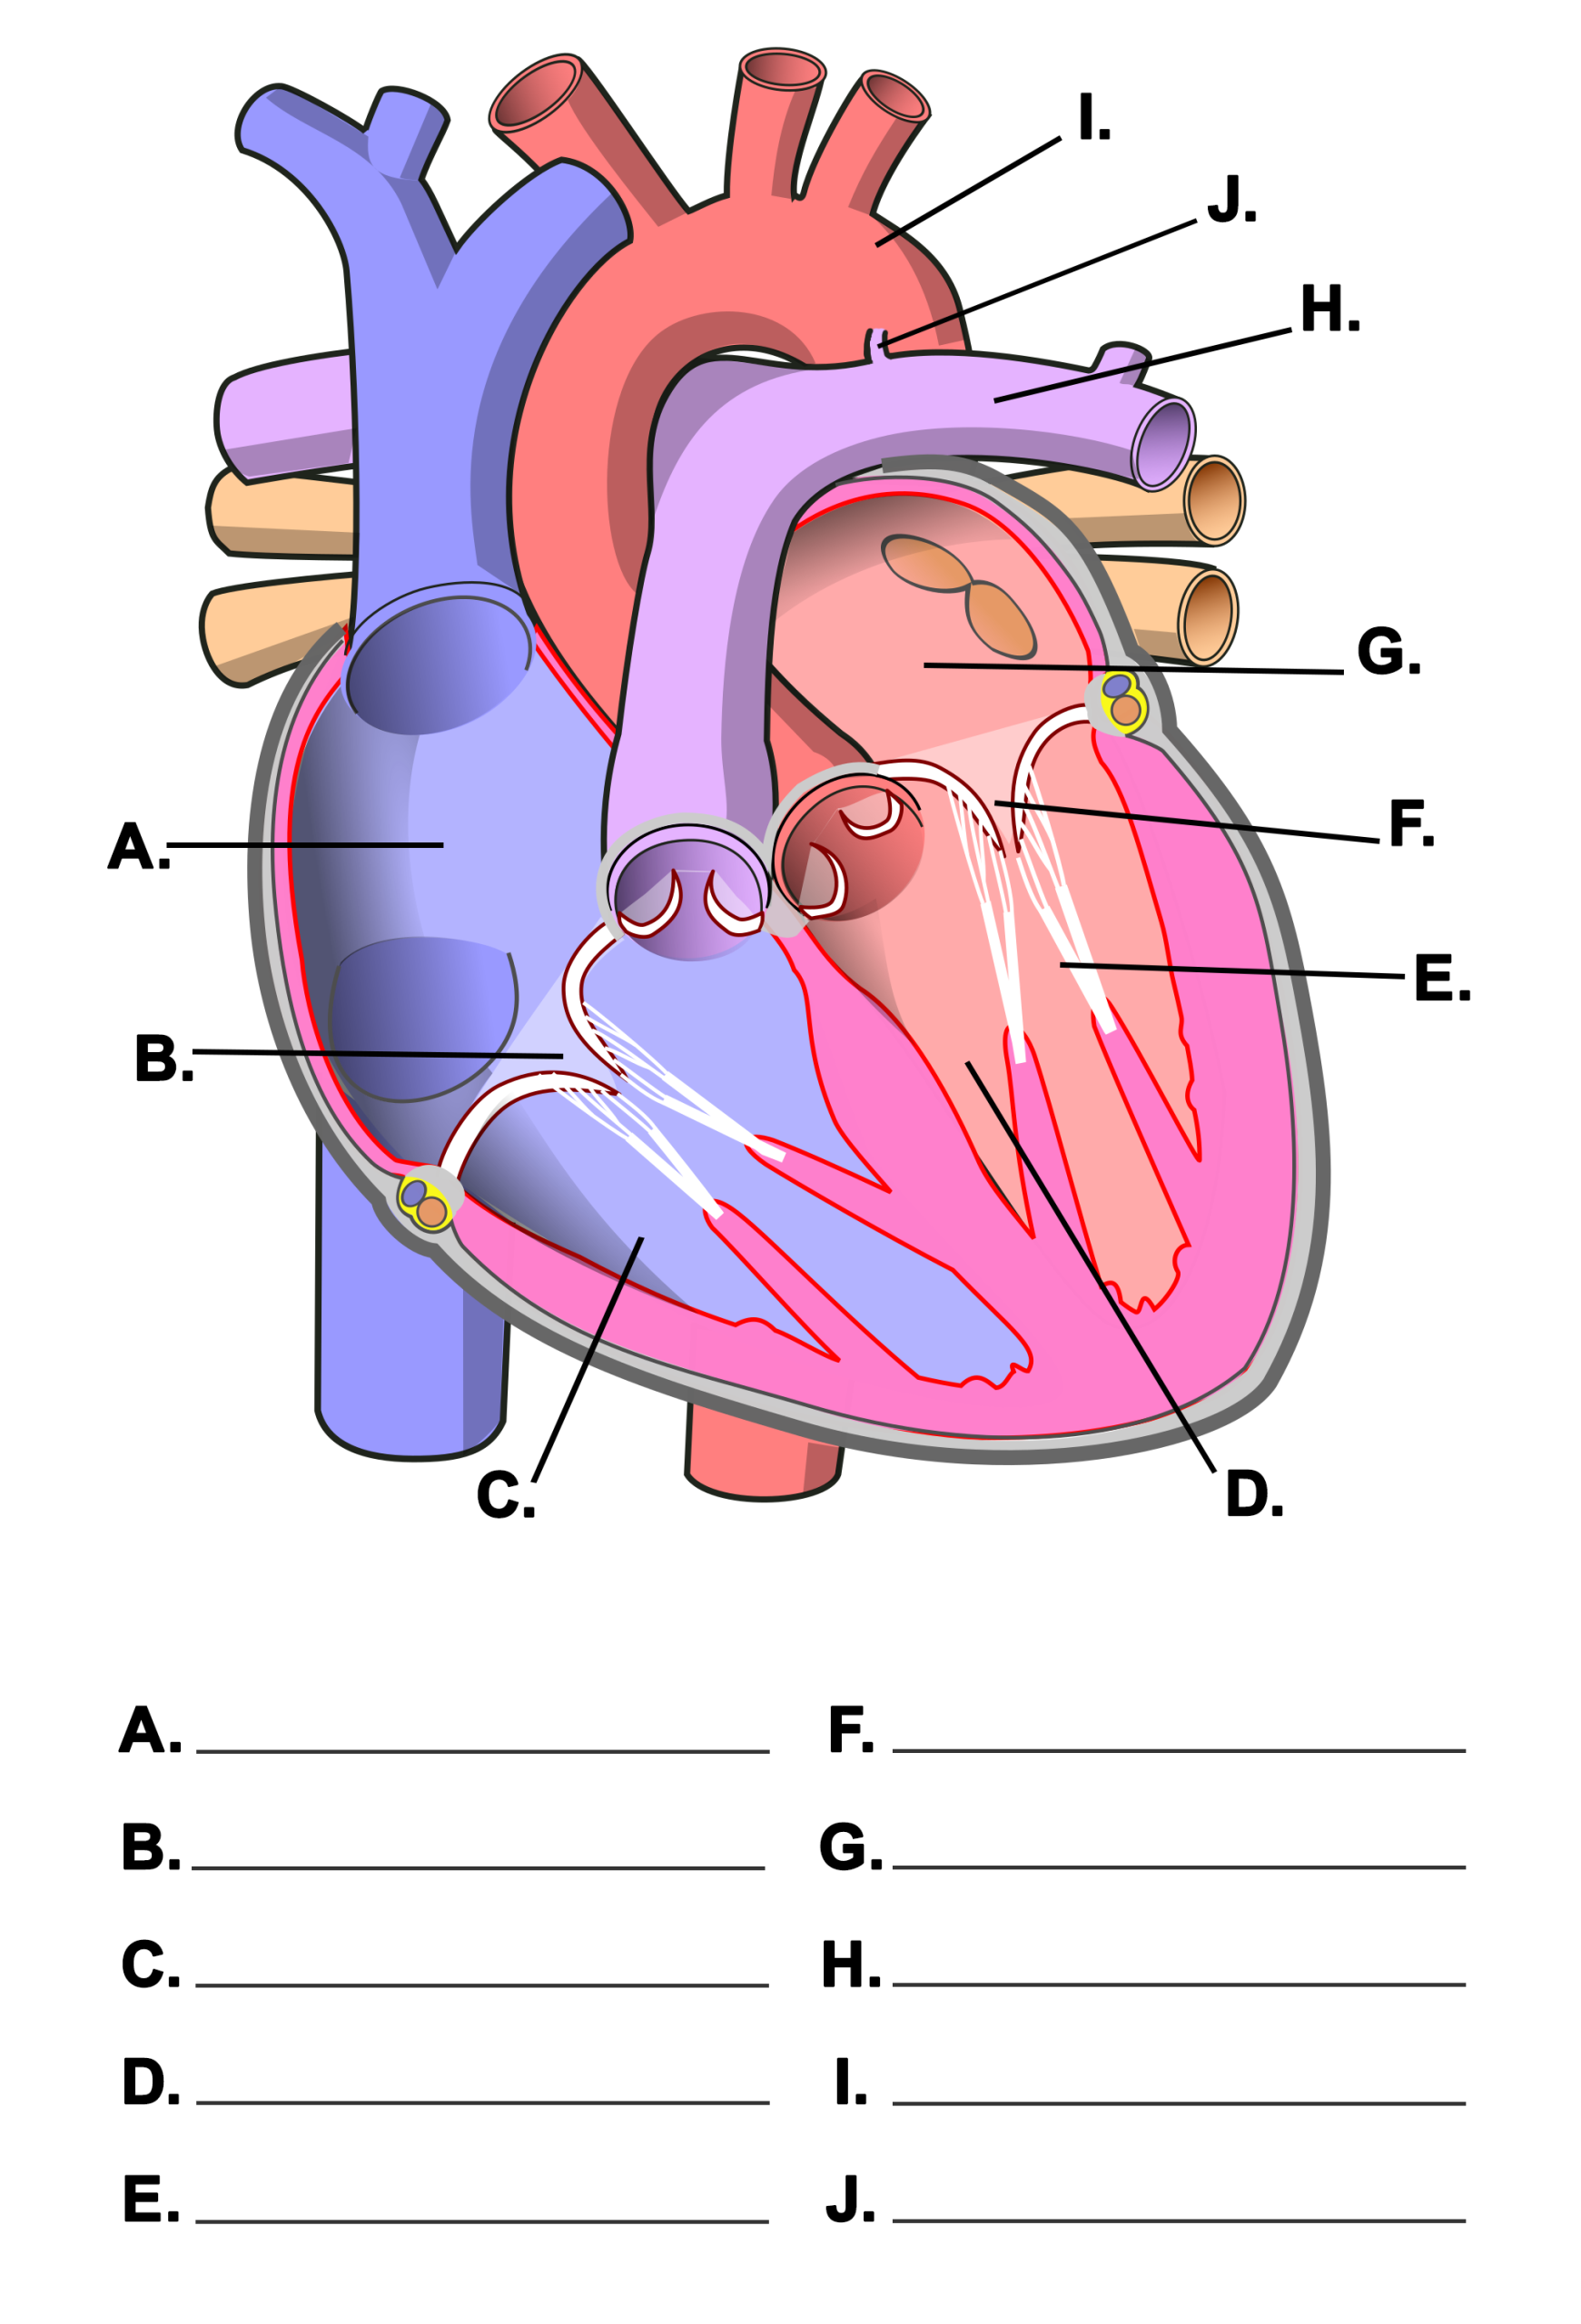
Use the following list of structures to label the figure on the right:
- Bicuspid valve
- Chordae tendinae
- Right atrium
- Left atrium
- Right ventricle
- Left ventricle
- Tricuspid valve
- Pulmonary trunk
- Ligamentum arteriosum
(Ductus Arteriosus in the fetus) - Aorta
Be sure to know the path of blood starting at different parts of the heart and traveling to various parts of the body. Work with your partner to describe these potential pathways. Use Figures 11.2 and 11.3 to help you.
![]() List the structures that blood travels through starting from the lung and going to the kidney. Is the blood in this pathway oxygenated or deoxygenated? Do oxygenation levels change at any point in this pathway?
List the structures that blood travels through starting from the lung and going to the kidney. Is the blood in this pathway oxygenated or deoxygenated? Do oxygenation levels change at any point in this pathway?
![]() List the structures that blood travels through starting from the right atrium and going to the head. Is the blood in this pathway oxygenated or deoxygenated? Do oxygenation levels change at any point in this pathway?
List the structures that blood travels through starting from the right atrium and going to the head. Is the blood in this pathway oxygenated or deoxygenated? Do oxygenation levels change at any point in this pathway?
![]() List the structures that blood travels through starting from the liver and going to the left ventricle. Is the blood in this pathway oxygenated or deoxygenated? Do oxygenation levels change at any point in this pathway?
List the structures that blood travels through starting from the liver and going to the left ventricle. Is the blood in this pathway oxygenated or deoxygenated? Do oxygenation levels change at any point in this pathway?
3. Vein and Artery Structure and Function
Observe the prepared slide of a vein and artery at the station provided in lab.
![]() Using the photo below, label the vein with an “A” and the artery with “B.”
Using the photo below, label the vein with an “A” and the artery with “B.”
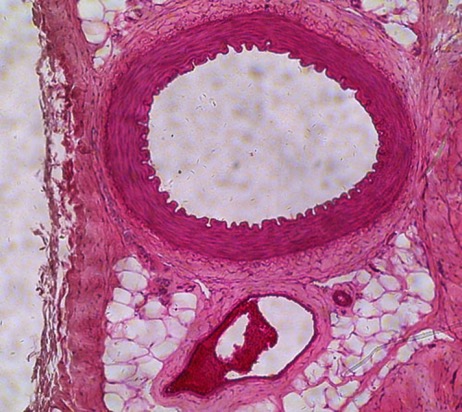
![]() How did you tell them apart? Why are these differences important to the function of the vein and artery?
How did you tell them apart? Why are these differences important to the function of the vein and artery?
4. Blood Smear
Look at the prepared slide of a blood smear at the station in lab. Observe it under the compound microscope at high enough magnification that allows you to see the individual blood cells. You can also use Figure 11.5, below, to help visualize the different cell types.
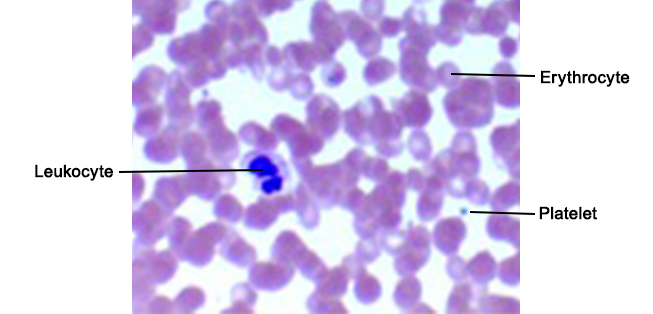
![]() There are many different types of cells in blood. Find each under your microscope, sketch what they look like, and describe their function(s) in Table 11.3.
There are many different types of cells in blood. Find each under your microscope, sketch what they look like, and describe their function(s) in Table 11.3.
|
Cell Type |
Sketch or take descriptive notes |
Function |
|
Erythrocytes |
|
|
|
Leukocytes |
|
|
|
Platelets |
|
|
Study Material
The following material will not be collected or graded but is provided to further test your understanding of the material in the lab. These will be valuable assets for quiz and practical studying.
Review Activity 11.1
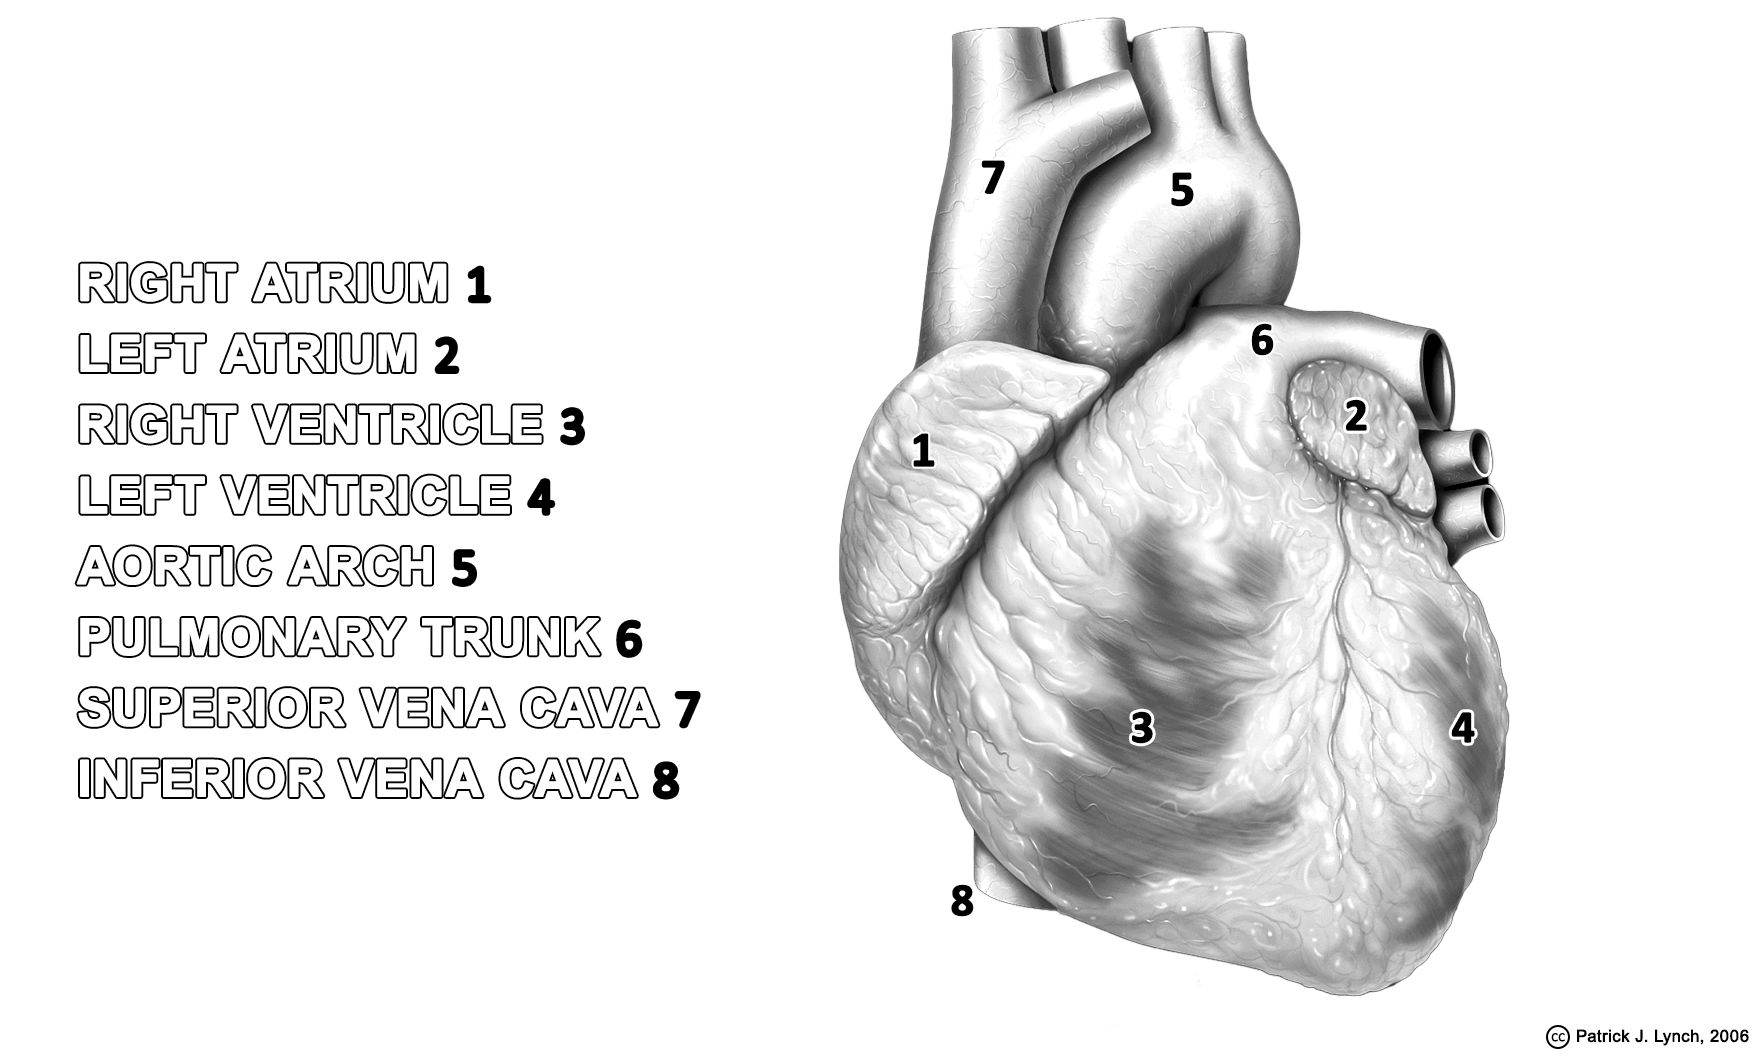
Help yourself visualize the external parts of the heart. Using crayons, colored pencils, and/or markers, fill in the name of each structure with a specific color and using that same color fill in the corresponding structure. Use different colors for different structures.
Review Activity 11.2
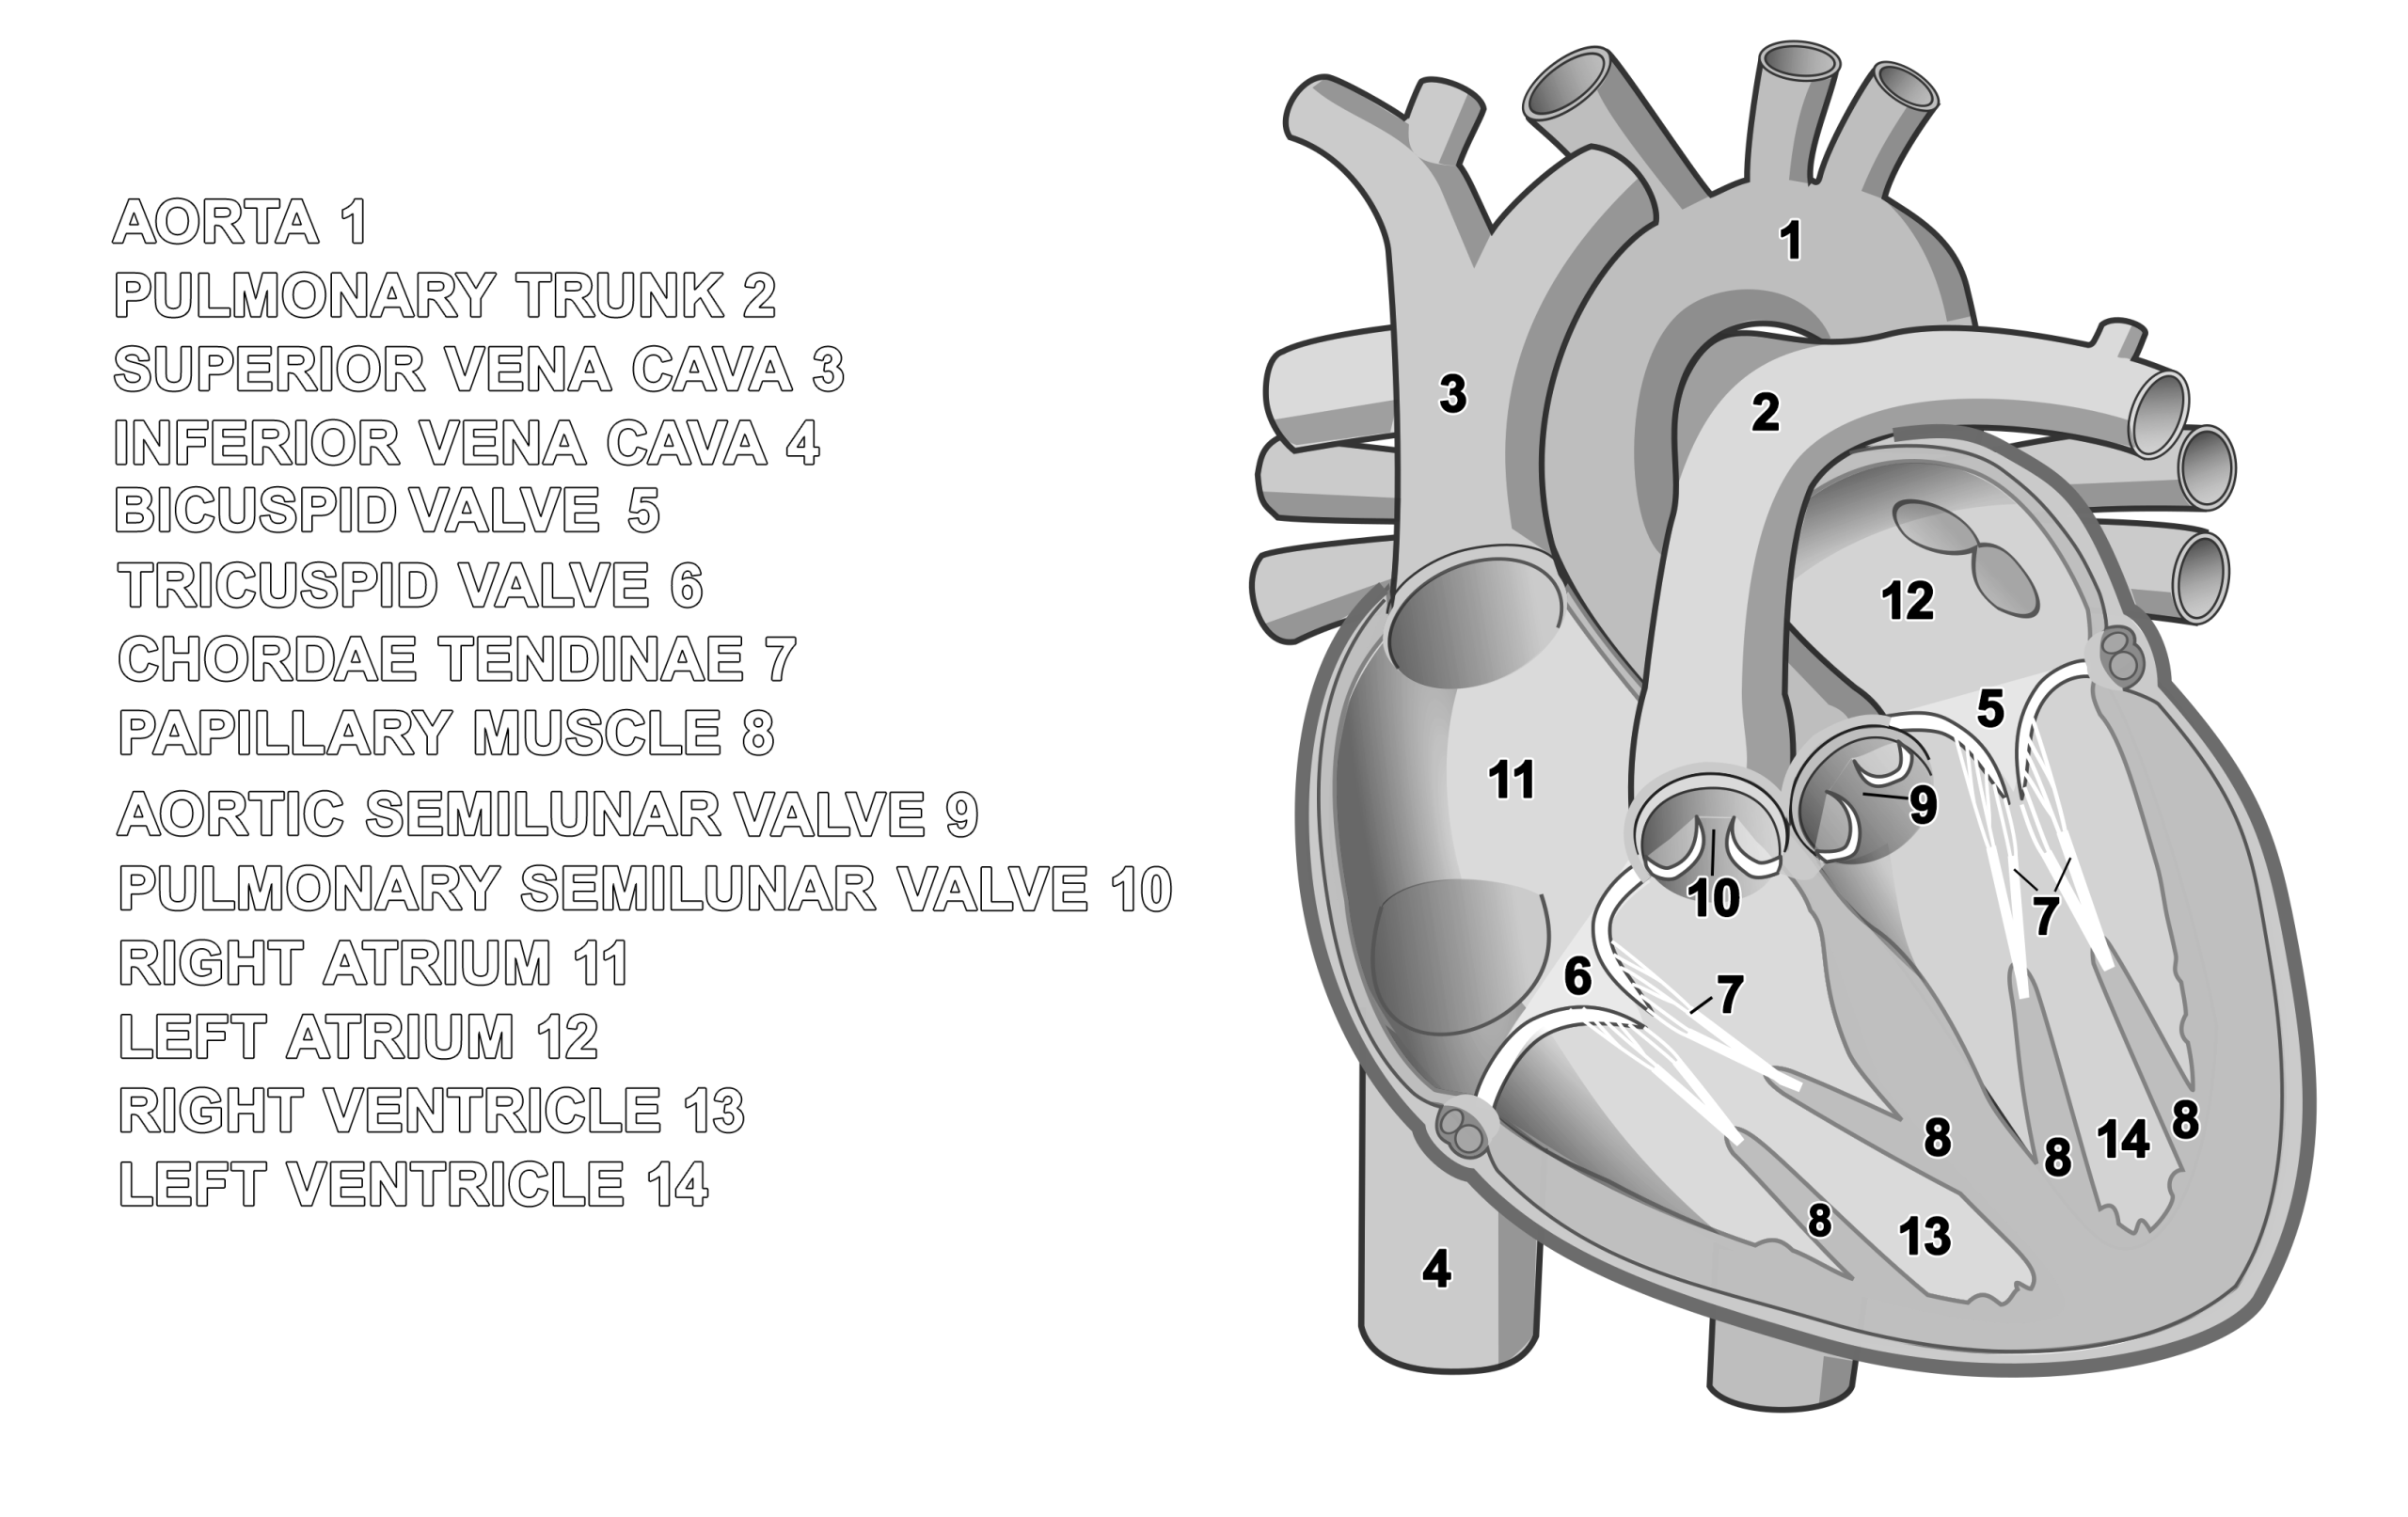
Help yourself visualize the internal parts of the heart. Using crayons, colored pencils, and/or markers, fill in the name of each structure with a specific color and using that same color fill in the corresponding structure. Use different colors for different structures.
Bonus:
Using a blue and red marker, trace the pathway of blood through the vessels and heart structures. Use red for areas where the blood is oxygenated and blue for where it is deoxygenated. Draw in lungs and color those purple. (Why would they be purple in this conceptual figure?)

.svg)