
Novel Traits from Molecular Genetics and Biotechnology
Walter P. Suza and Walter R. Fehr
Introduction
Research in molecular genetics and biotechnology is providing new tools for selecting genes of interest and for generating new genes of economic importance. The use of these new technologies for cultivar development is the subject of this chapter.
Molecular markers
A molecular marker is part of the DNA of a plant associated with the DNA of a gene of interest. The DNA of a molecular marker may be linked (linked marker) to a gene of interest or part of the gene itself (perfect, direct, or functional marker).
The use of a molecular marker is an alternative to the use of phenotypic selection for selecting a gene of interest. For example, the dominant Rag1 allele provides partial resistance to an aphid in soybean. A molecular marker is available to identify plants that are homozygous for the desired allele. If the marker was not available, a breeder would have to infect plants with aphid to identify those with the Rag1 allele. Plants that had a reduced number of aphids could be homozygous or heterozygous for the allele or could be plants without the allele that accidentally escaped aphid infection. Consequently, phenotypic evaluation would be less reliable and more expensive than the use of a molecular marker.
DNA markers can be useful in species that have long life cycles (e.g. trees) or if a trait is expressed only at later stages of development. For example, in asparagus [Euphytica. 94:329–333 (1997)] and gingko [Euphytica. 169:49-55 (2009)], identification of an individuals’ sex is desirable at early stages, but may not be expressed until plants are more than two years old (asparagus) or have reached sexual maturity (gingko).
Breeders must decide on a case-by-case basis if the use of a molecular marker will be more efficient and cost effective than the use of phenotypic selection. For example, transgenes that provide herbicide resistance are widely used in some plant species, such as soybeans and maize. Molecular markers generally are not used for selection of plants with a herbicide resistance gene because it is less expensive to spray plants with the herbicide and kill those without the gene.
Common types of markers
The two most common types of markers currently used are a simple sequence repeat (SSR) and a single nucleotide polymorphism (SNP). Both types are used as linked markers. SNPs also can be used as a direct marker for some alleles.
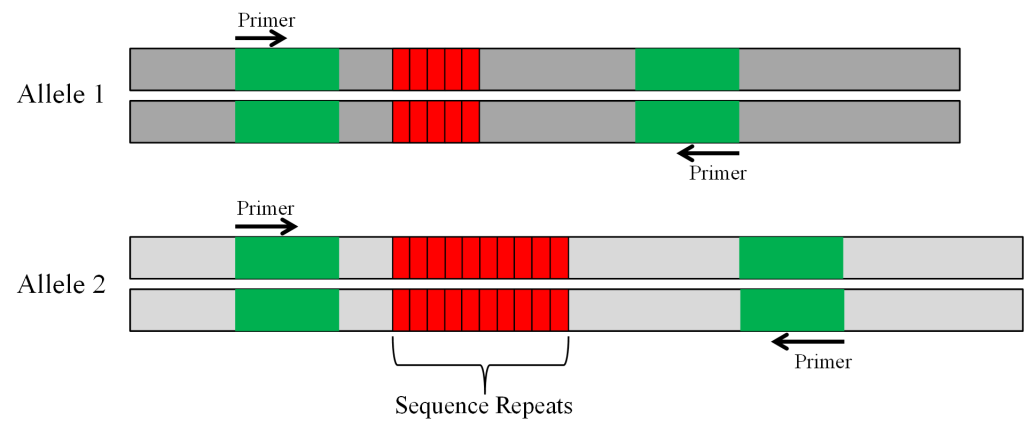
Simple Sequence Repeat (SSR)
SSRs are pieces of DNA containing repeated nucleotide sequences. The repeated nucleotide sequences in plants can be two bases, such as AT, AG or TC [Trends in Plant Sci.1:215-222 (1996)] or three bases, such as ATT [Plant J. 3:175-182 (1993)]. To effectively use an SSR as a marker, two criteria need to be met. (1). The SSR must be tightly linked to the gene of interest so that they are not separated by a crossover during meiosis. Ideally, there would be a tightly linked SSR on both sides of the gene so that it is possible to determine if a crossover did occur. (2). The SSR must be polymorphic in the parents used to form the population from which individuals are being evaluated. Individuals with the desired allele must have one SSR sequence and those with the other allele must have a different SSR sequence.
Single nucleotide polymorphism (SNP)
SNPs are single nucleotide differences in the DNA of two individuals. For example, one individual may have an adenine (A) and another individual may have a guanine (G) at the same location in the DNA sequence. If a SNP is used as a linked marker, it must be tightly linked to the gene of interest and polymorphic in the parents of a population. A SNP within the gene that controls a trait is ideal because there is no possibility of a crossover between the SNP and the allele of interest.
Detection of molecular markers
To detect molecular markers, thousands of copies of the DNA region that differentiates individuals that do or do not have the allele of interest are made by PCR. The process of making the copies is referred to as amplification. The method invented by Kary Mullis in the mid-1980s is a way of amplifying minute quantities of DNA [Methods in Molecular Biol. 226:3-6 (2003)]. The basic materials used to conduct a PCR reaction are the following.
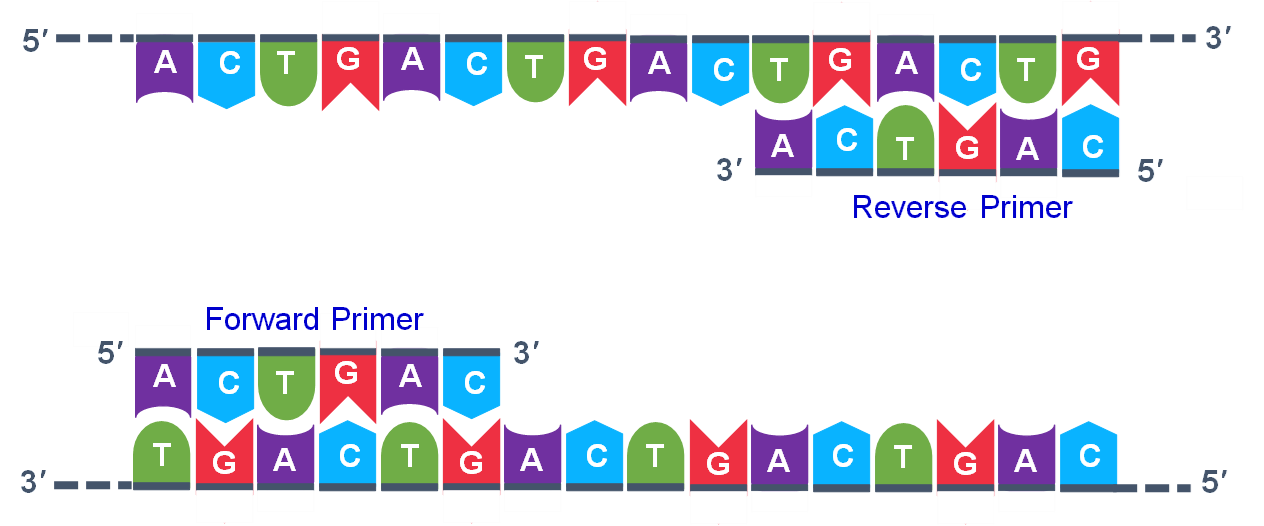
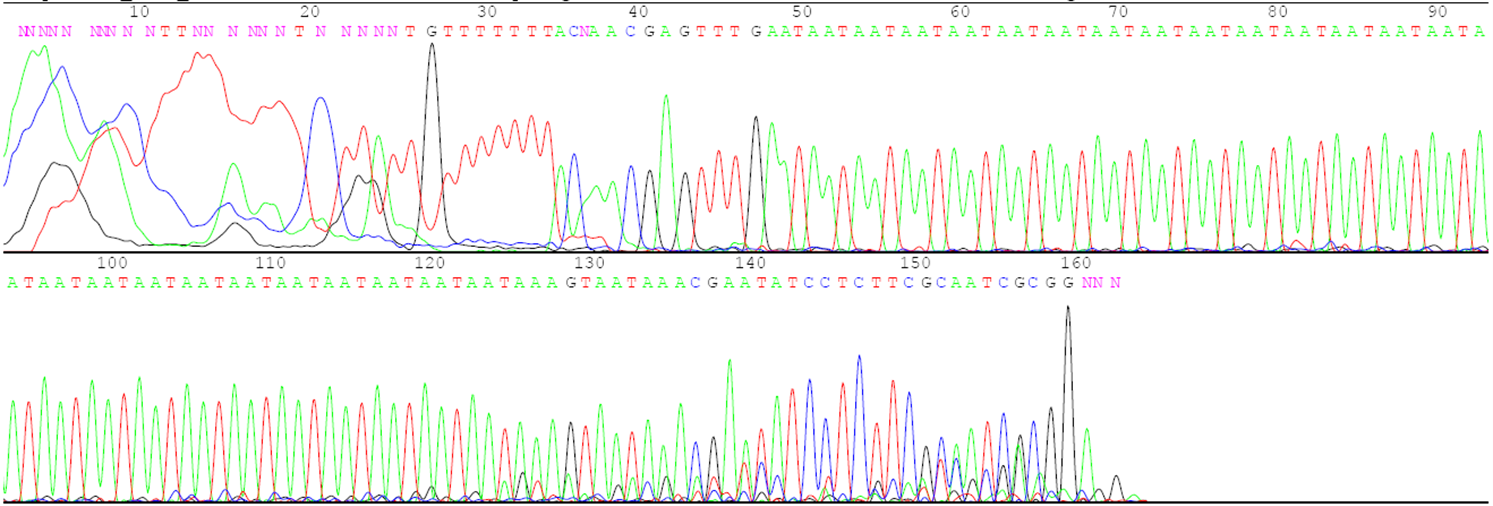
- DNA from the individual to be evaluated. This could be obtained from seed or vegetative tissue, particularly young leaf tissue. Figure 1 is an example of the DNA sequence of a region that will be amplified.
- The DNA polymerase enzyme called Taq polymerase. It originally was isolated from a bacterium called Thermus aquaticus from which the name of the enzyme was derived. Taq polymerase has a temperature optimum of 72oC and is stable even at 95oC.
- DNA primers that match the sequence on either side of the region to be amplified. The primers are made in machines called DNA synthesizers. Figure 1 shows the primers that will be used to amplify the region of interest by the Taq polymerase.
- Deoxynucleoside triphosphates (dNTPs) that contain the four nucleotides (A.G.C.T) that are used to make the new strands of DNA.
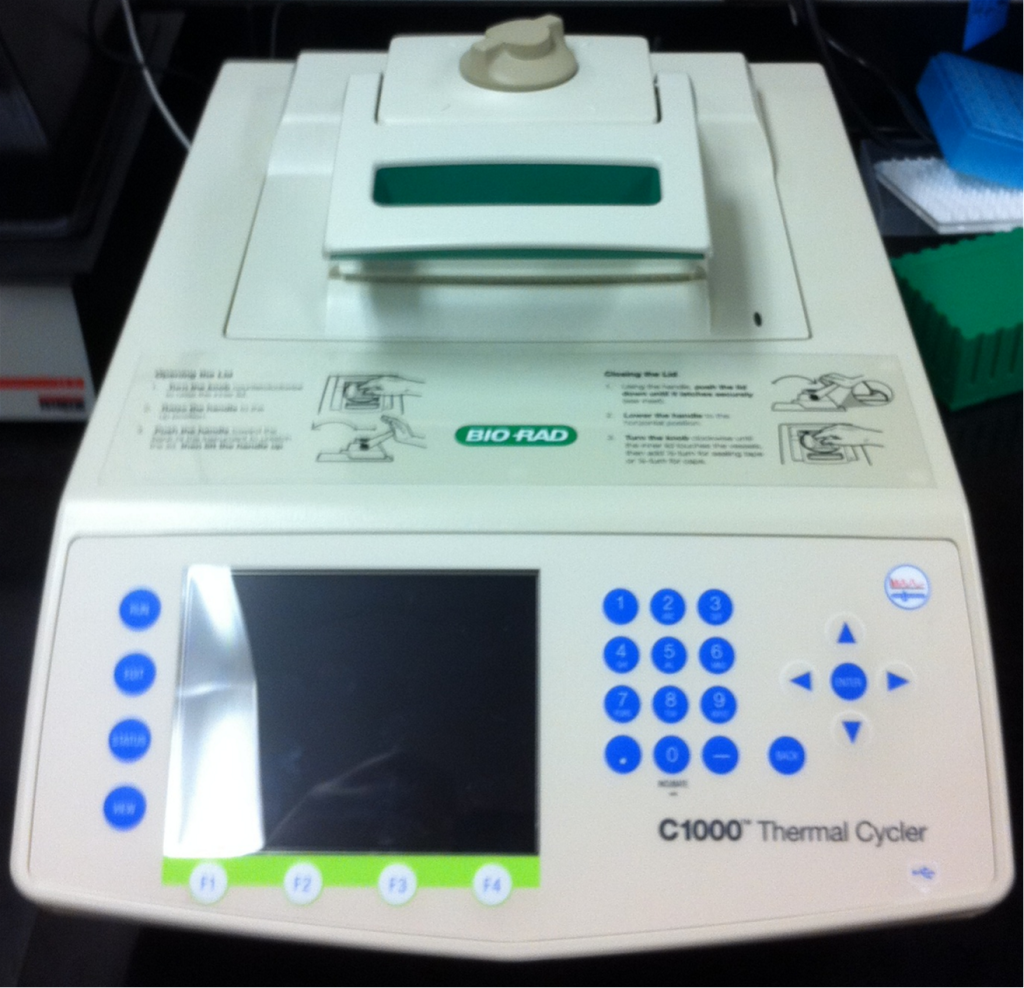
- A thermo cycler that controls the temperature for the PCR reaction.
The PCR reaction involves three basic steps. Repetitions of the three steps are referred to as cycles:
- Step 1. Denaturation – heating the DNA to about 95oC causes the two strands to come apart
- Step 2. Annealing – primers bind to complementary regions of the two separated strands
- Step 3. Extension – the polymerase uses primers and dNTPs to synthesize new DNA strands
The following are two links that will provide you with an illustration of how PCR works. The first link is an exercise that will help you understand the way in which the four DNA bases in the PCR mixture are matched with their counterpart during the reaction and how the strands are copied during the reaction:
The second link is an animation of the process.
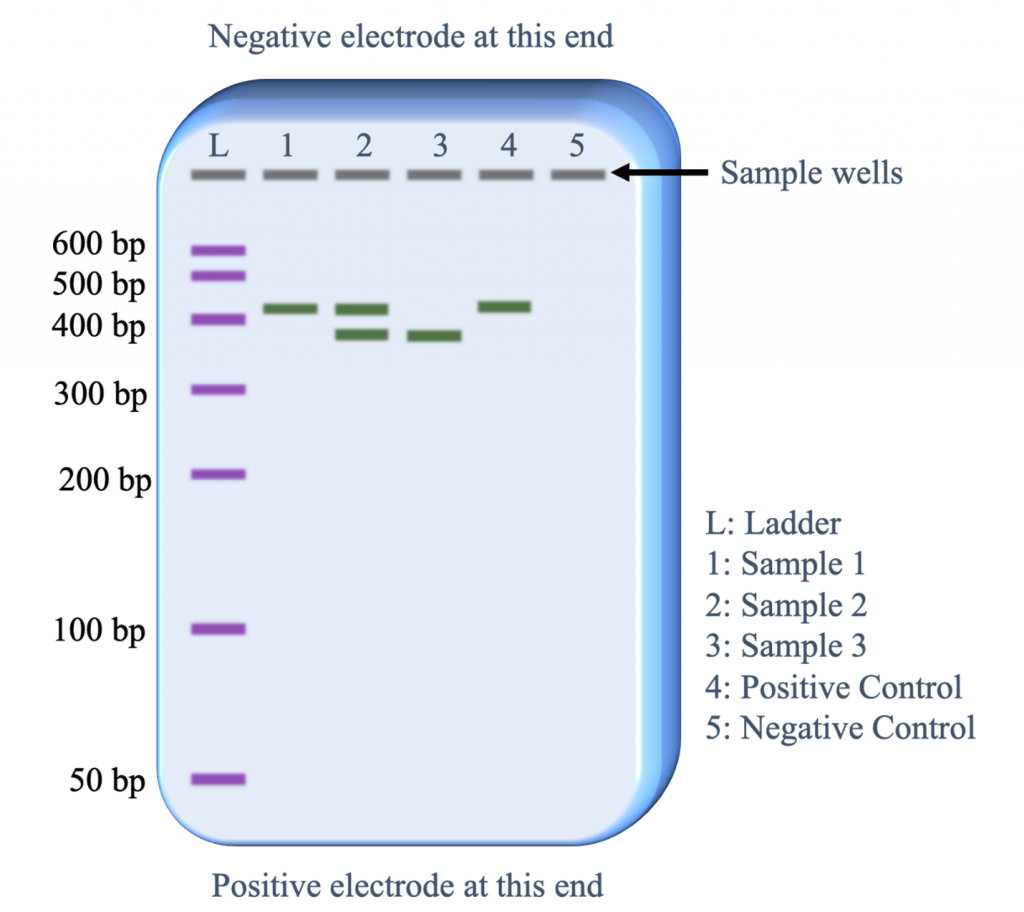
The polymorphic SSR marker (Figure 3) can be evaluated with gel electrophoresis. Prior to electrophoresis, the DNA is loaded on a gel that is placed on a box in which there is a current running from one end to the other (Figure 4). DNA is negatively charged and will migrate through the gel toward the positive pole.
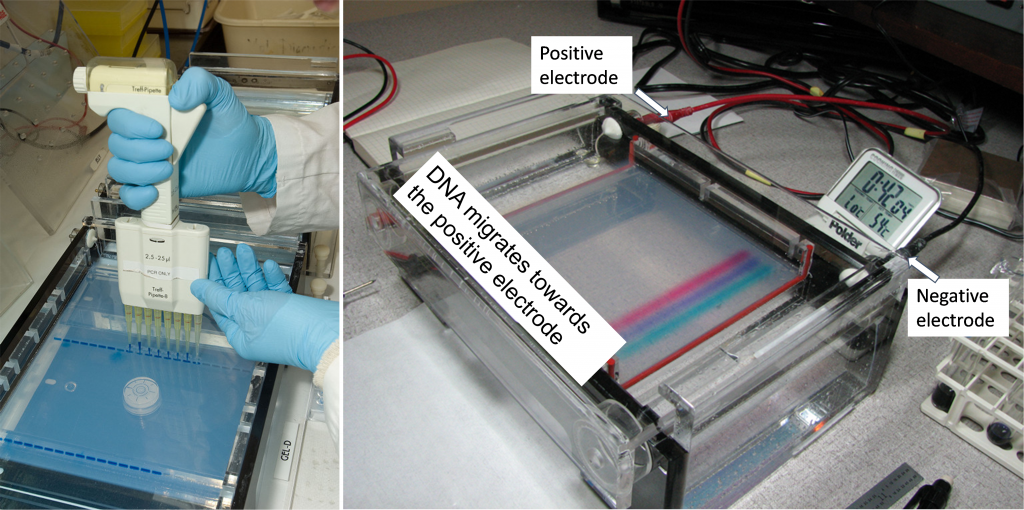
During electrophoresis, longer fragments of DNA travel through the gel slower than smaller fragments, which makes it possible to differentiate the size of the fragments by the position of their band on the gel (Figure 5).
Example of the practical use of an SSR:
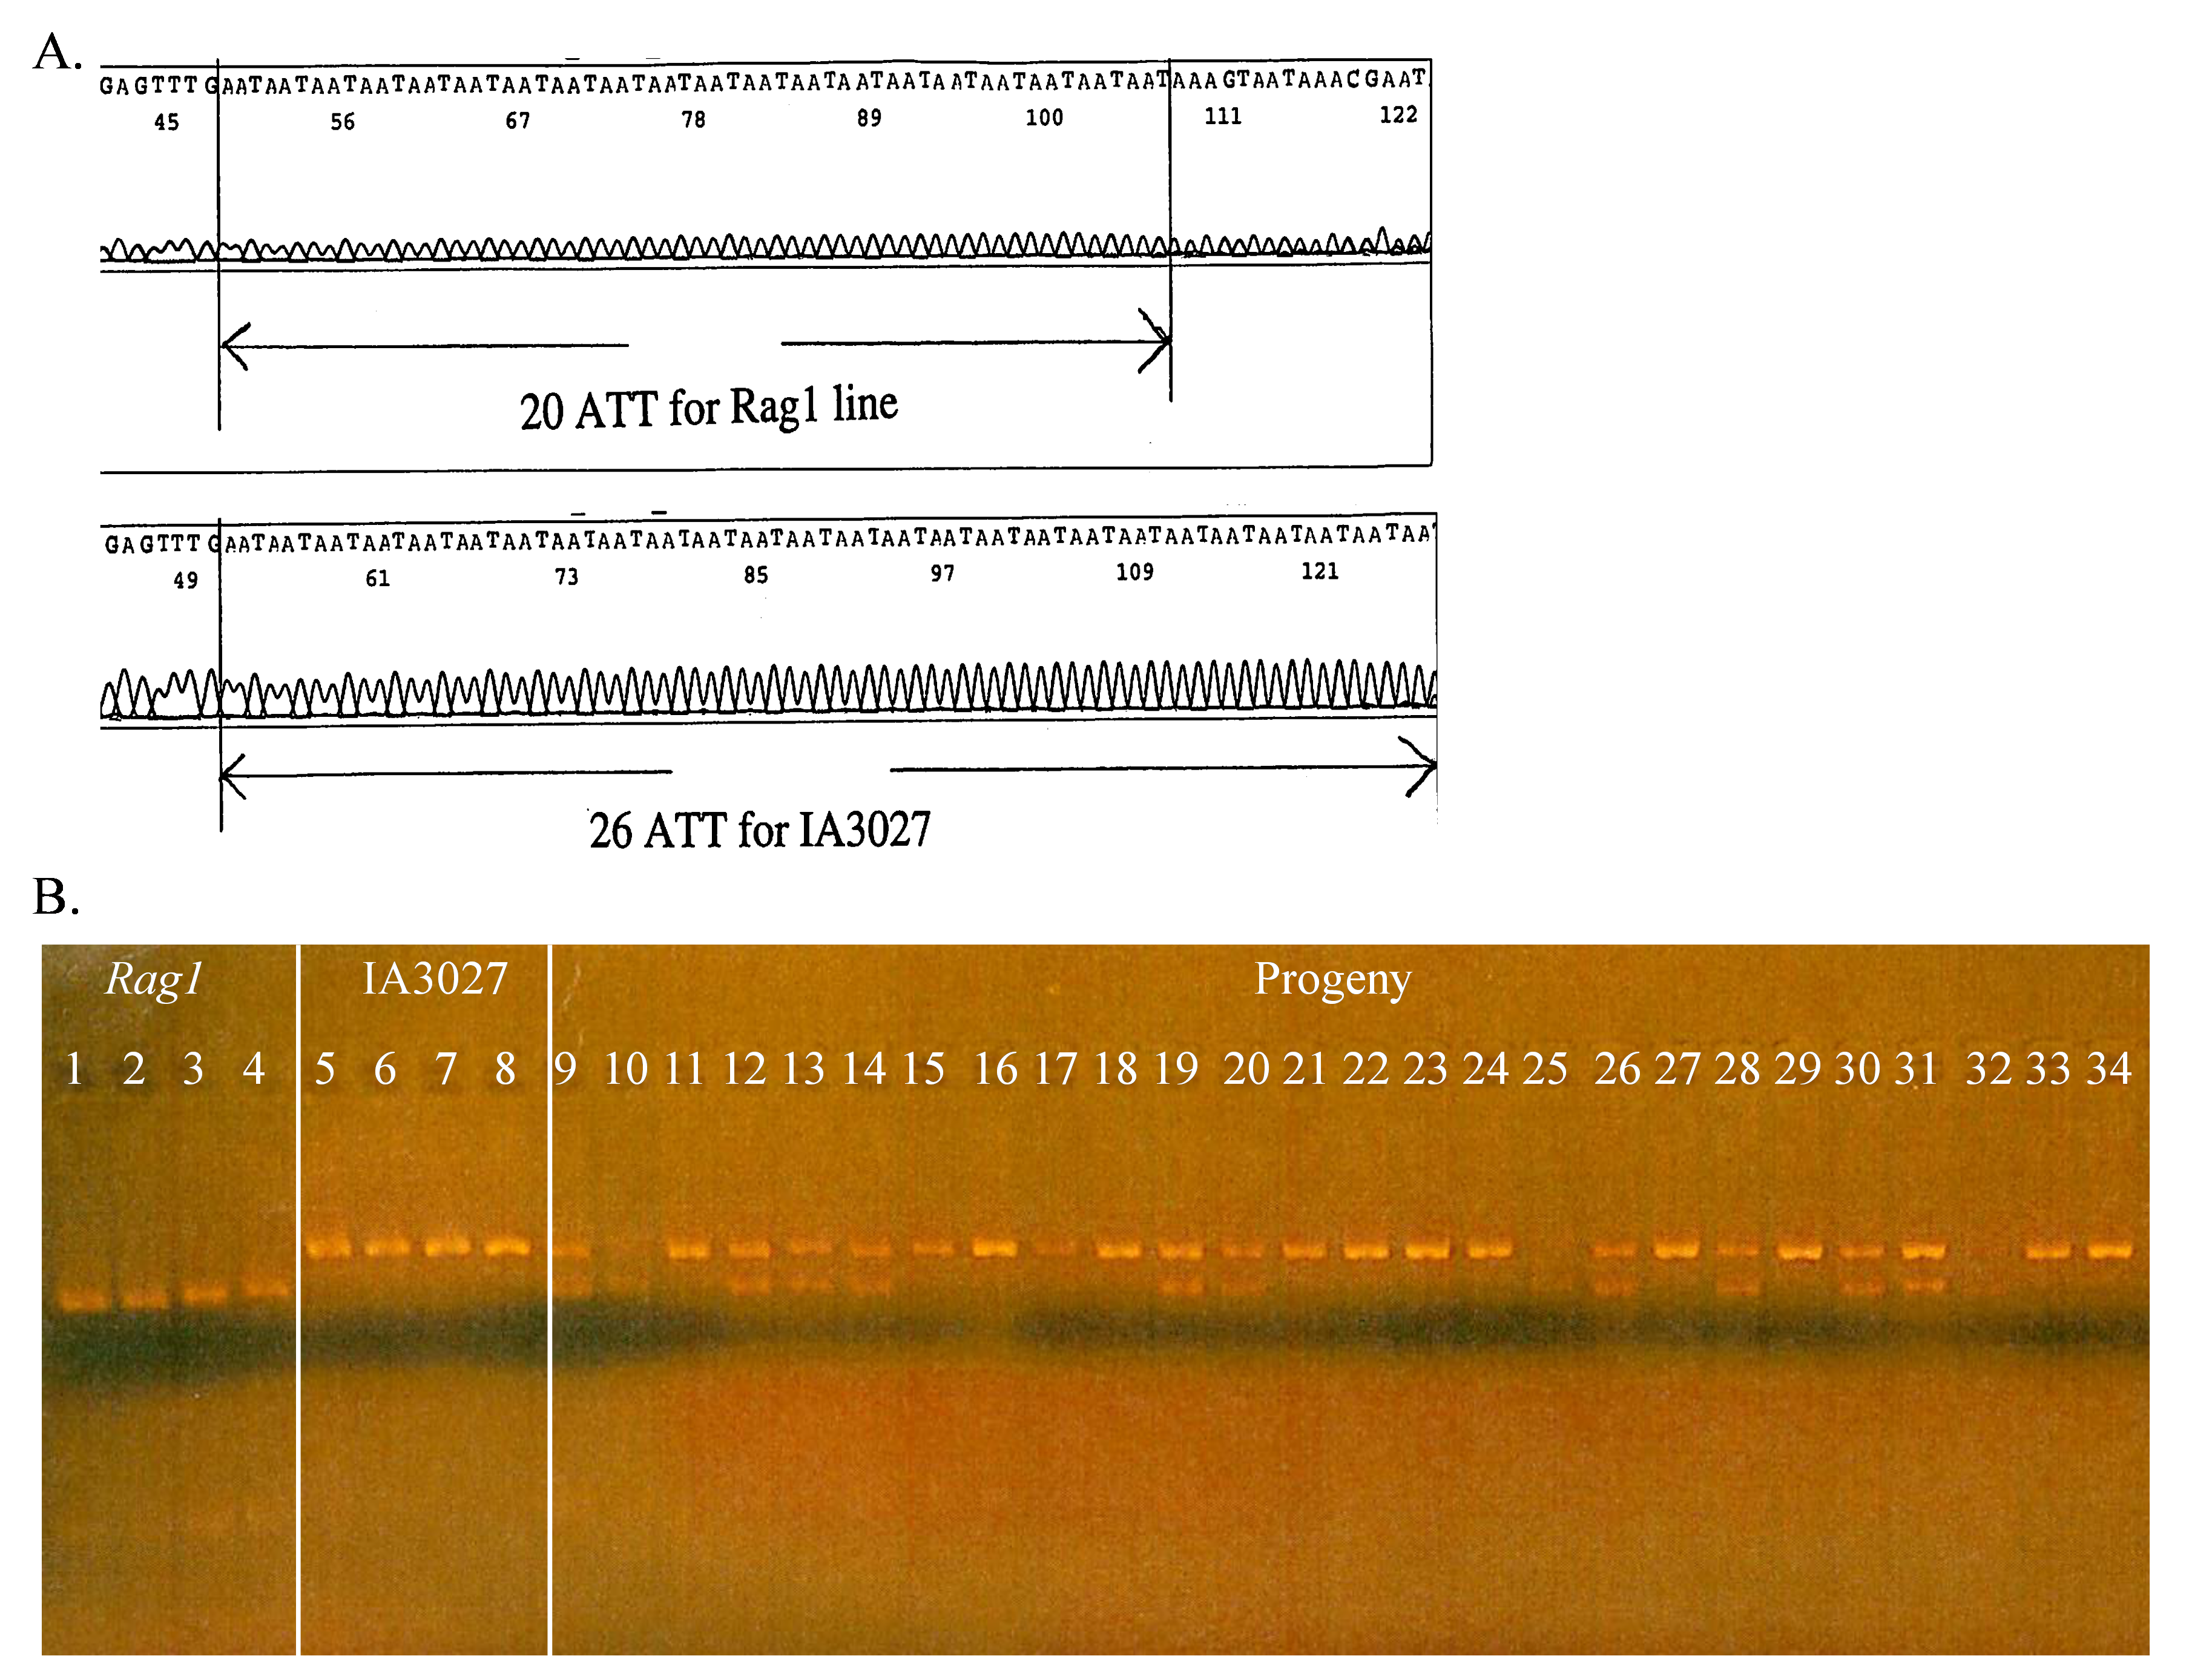
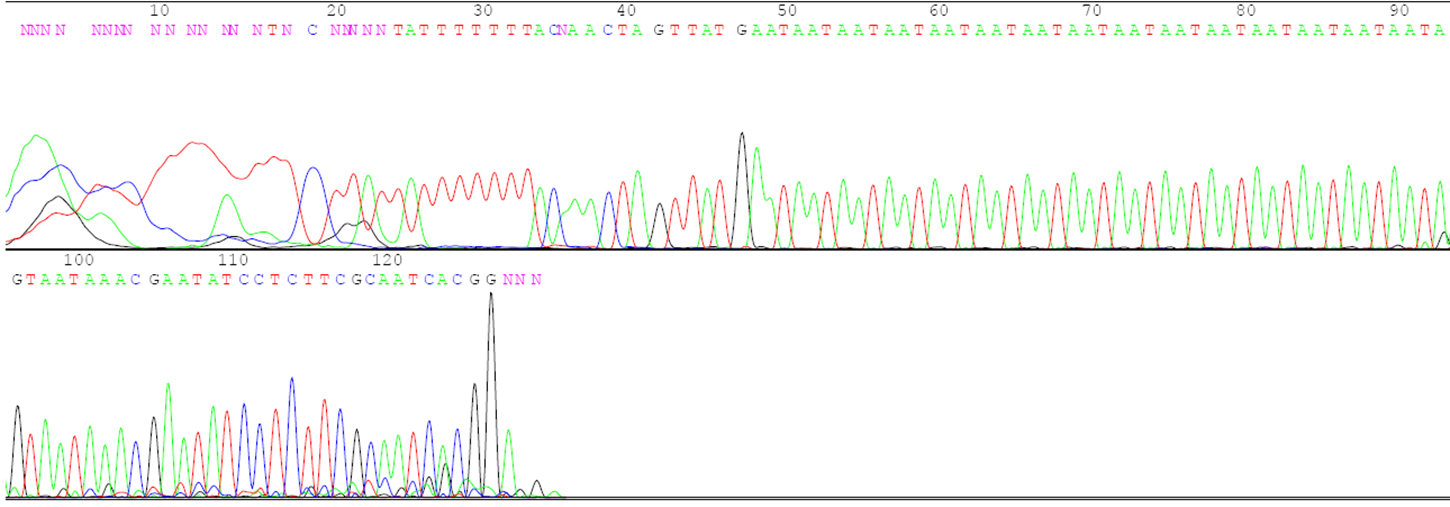
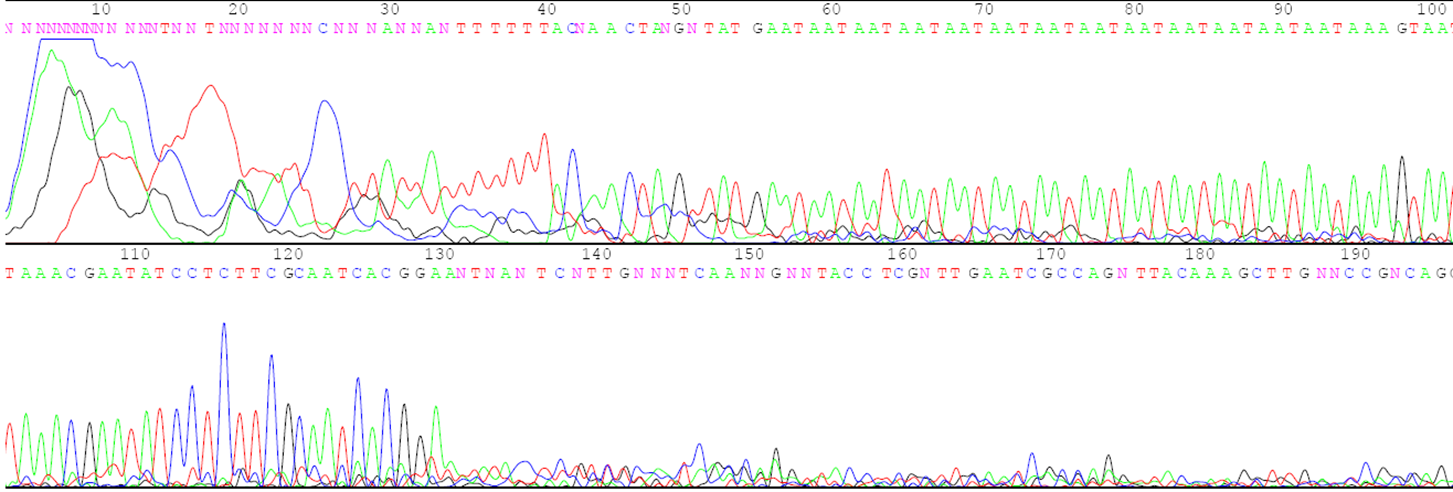
SSRs are used to track alleles that confer partial resistance to the soybean aphid. The Rag1 allele that confers partial resistance to the soybean aphid is linked to an SSR made up of ATT repeats. In the soybean breeding program at Iowa State Univ., the parent line developed by the Univ. of Illinois that had the Rag1 allele was crossed to an elite cultivar IA3027 [Crop Sci. 50:1891-1895 (2010)]. The SSR in the parent line that was linked to Rag1 had 20 ATT repeats while the same SSR marker in IA3027 that was linked to the susceptible rag1 allele had 26 ATT repeats (figure 6A). PCR primers were designed to amplify the SSR marker. When the amplified DNA was run on a gel, the band representing the shorter DNA fragment of 20 ATT repeats linked to Rag1 moved faster in the gel than the larger fragment with 26 ATT repeats associated with rag1. Samples (lanes) with one band in the same position as the Rag 1 parent were considered homozygous for Rag1, those with one band in the same position as IA3027 were assumed to be homozygous for rag1, and those with two bands were considered to be heterozygous (Figure 6B).
Example of the practical use of a SNP within a gene:
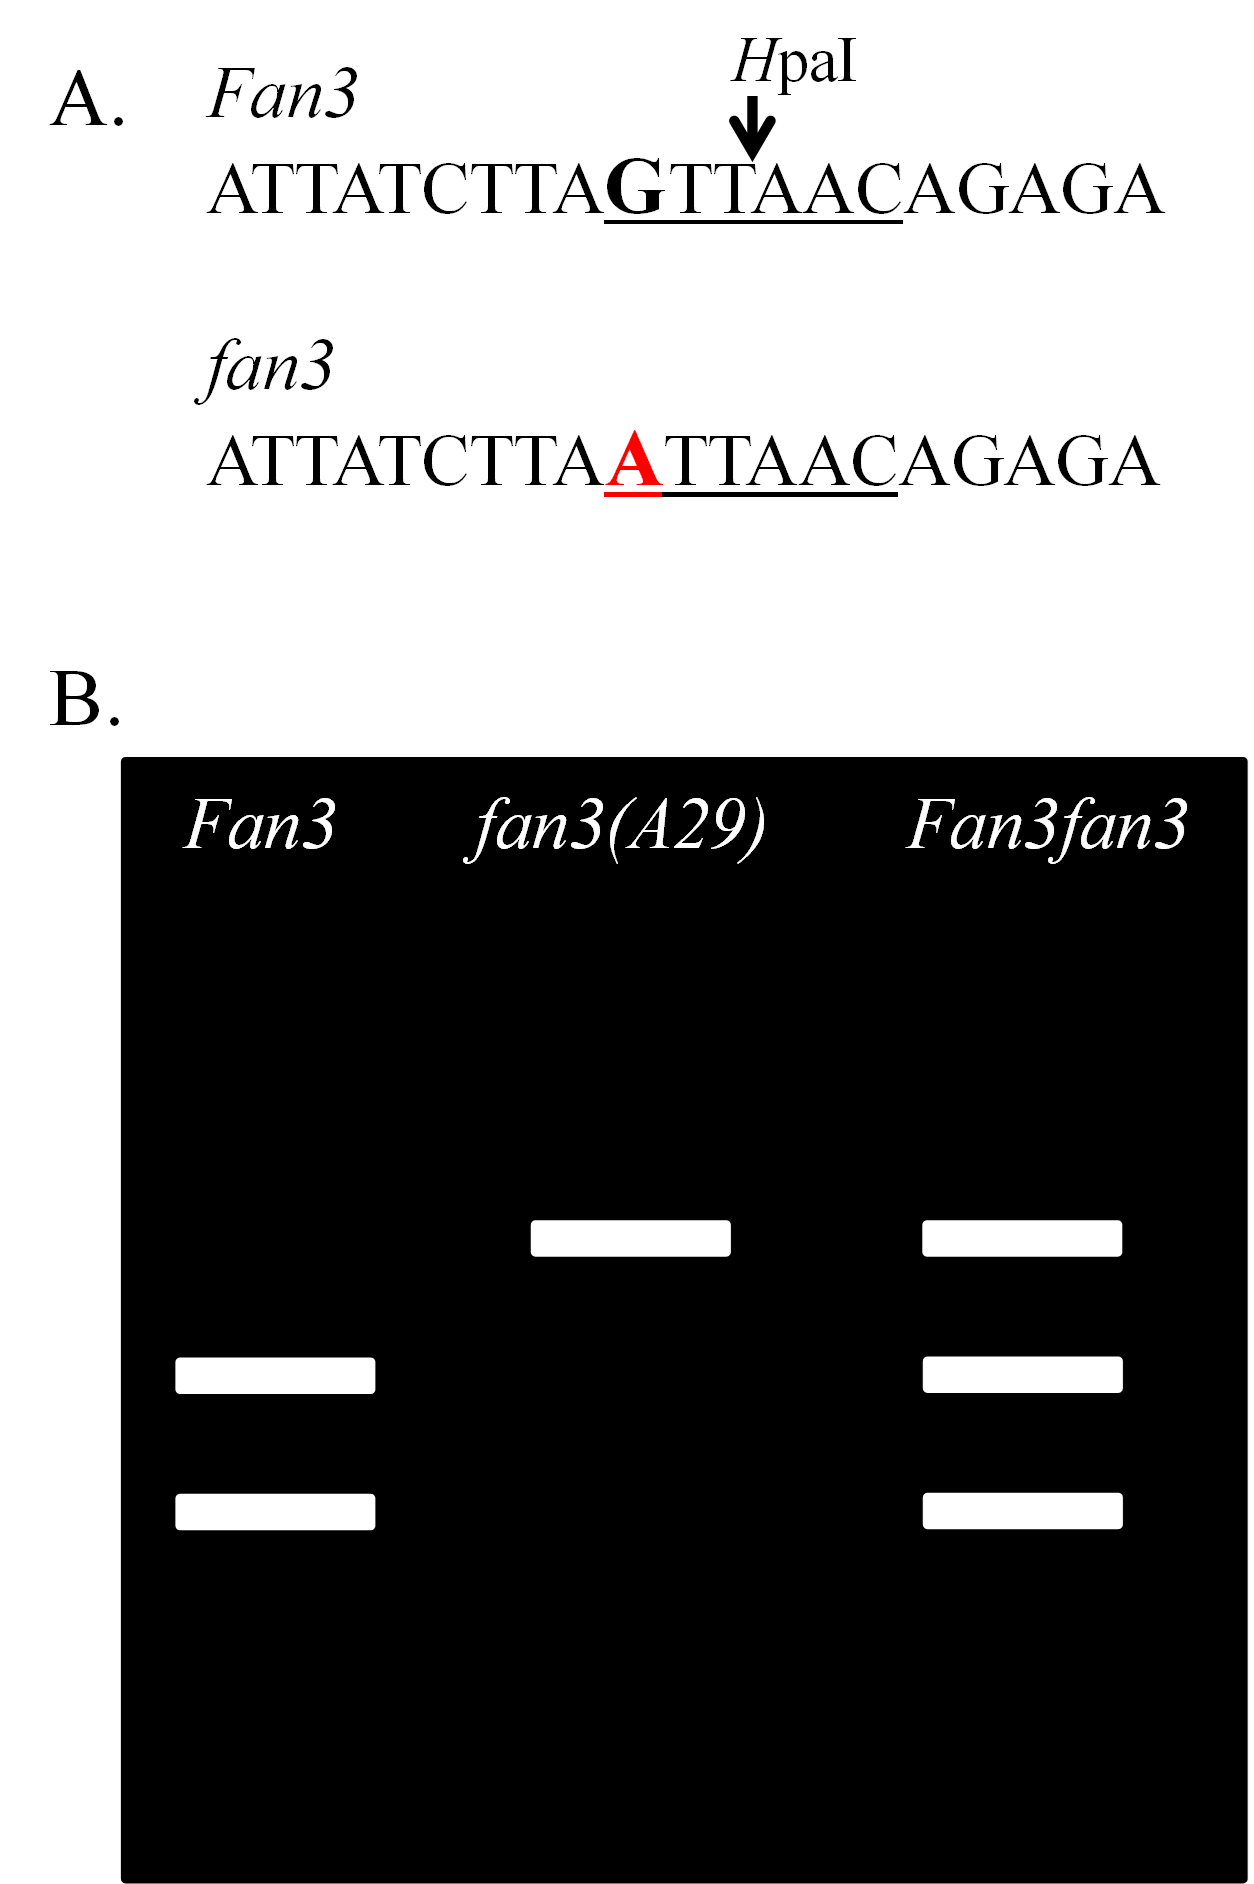
The DNA used as a SNP marker cannot be analyzed by gel electrophoresis in the same manner as an SSR because the base pair number and length of the DNA for two alleles will be the same. One method that is used to analyze SNPs is referred to as restriction fragment length polymorphism (RFLP).
There is a mutant allele in soybean fan3(A29) that controls a reduction in the linolenic acid content of the oil. Reduction of linolenic acid improves the shelf-life of the oil. The allele is one of those used in soybean cultivars for the production of oil with low linolenic acid. There is a single nucleotide difference between the fan3(A29) allele in A29 and the wild-type allele Fan3 in the conventional cultivars such as Williams 82. The guanine (G) of the wild-type allele is changed to an adenine (A) in the mutant allele (Figure 7A). There is a an enzyme found in a bacterium, referred to as a restriction enzyme, that cuts the DNA of soybean containing the wild-type allele, but not the mutant allele, specifically at the location of the SNP. As a result, the DNA of a homozygous wild-type plant has two fragments (bands) when run on a gel, a homozygous mutant plant has one band, and a heterozygous plant has three bands (Figure 7B).
There are other methods of evaluating SNPs, including the SimpleProbe and Taqman assays. Those methods and others will be covered in a later course.
Novel traits from biotechnology
Genetic engineering has been used successfully to develop novel genes of economic importance that can be used by the plant breeder. The genes may be isolated from one organism and transferred to another or may be genes of one species that are modified and reinserted into the same species. The new genes, commonly referred to as transgenes, are inserted into a plant by a process called transformation. The DNA used for transformation is referred to as a construct that has four essential components linked together (figure 8).
- DNA of the gene of interest.
- A promoter that acts to turn the gene on and off in the cell. The CaMV 35s promoter from the cauliflower mosaic virus (CaMV) is commonly used in genetic engineering. Other types of promoters, such as, the nopaline synthase promoter (NOS-Pro) also may be used to express transgenes in plant tissues.
- A selectable marker that is used to select cells that successfully obtained the construct during the transformation process. In figure 8, the selectable marker in the construct is NPT II (Kanr) that controls resistance to the antibiotic kanamycin. The cells of the plant used for transformation will be grown on a media containing the antibiotic. Other selectable markers that have been used successfully in plants include genes controlling herbicide resistance. Additional information about selectable markers used in plant genetic engineering can be found on pages 196-198 of the Journal of Biotechnology 107: 193-232 (2004).
- A terminator sequence, such as the nopaline synthase (NOS) gene is included to mark the end of the transgene sequence for proper expression in plant cells.

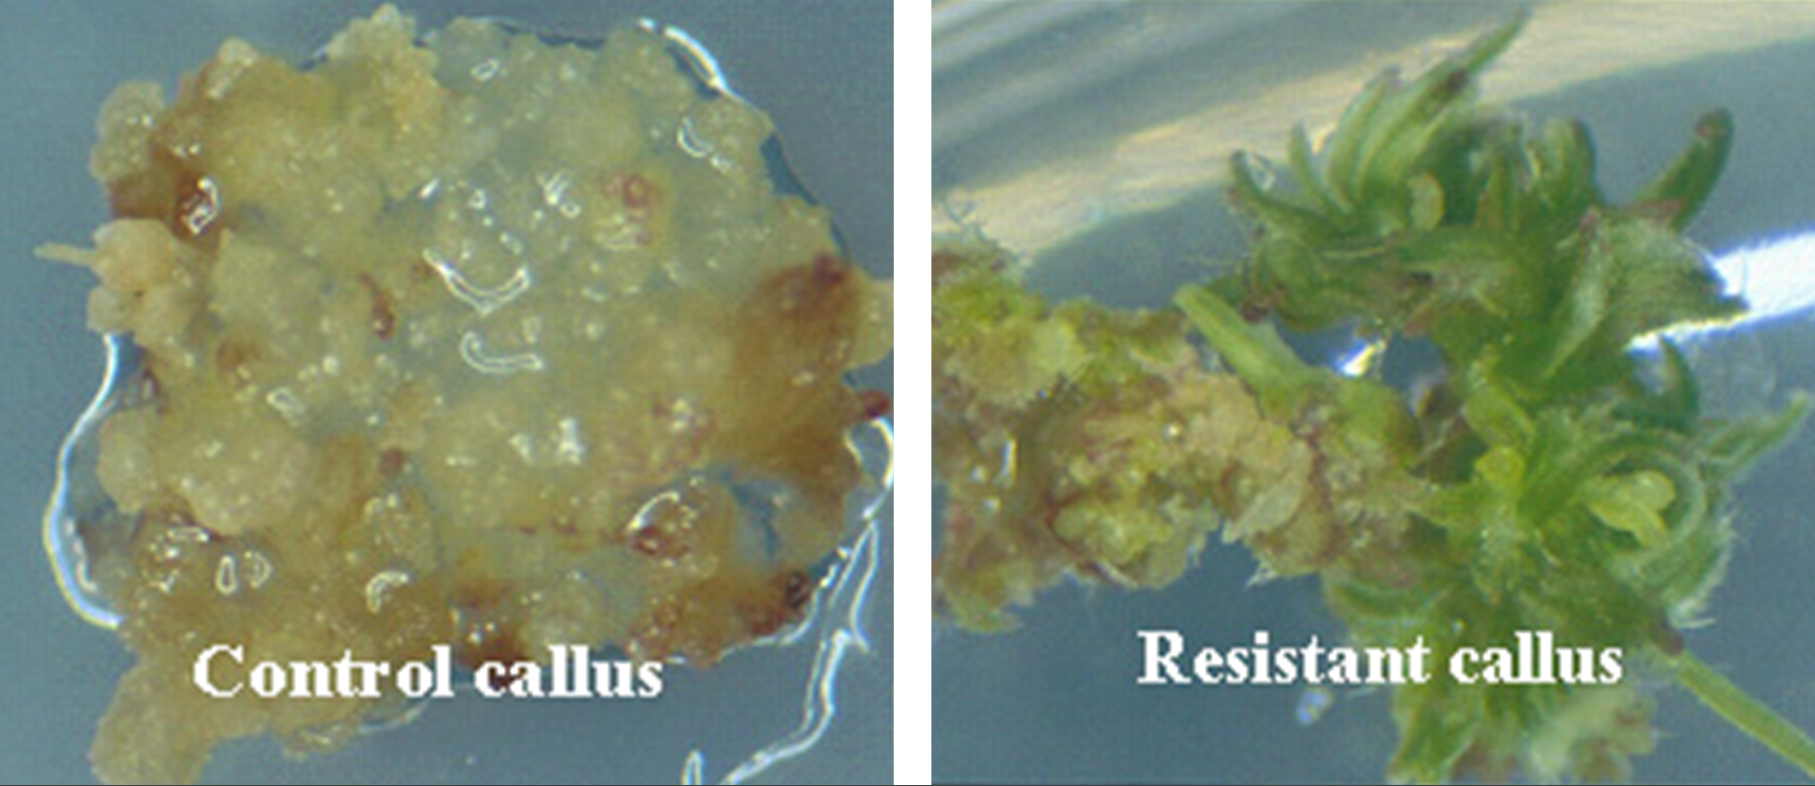
At present, very few host cells receive the construct during the transformation process. Each random insertion of the construct into the genome of plant cells is referred as an event. Useful events are rare because of the random nature of the transformation process. Selectable markers are very important because they allow the identification of the rare events (Figure 9). Scientists have to screen a large number of potential transformants to identify events that are useful for breeding.
Plant transformation and tissue culture
The process of transformation involves the insertion of the desired transgene construct (figure 8) into cells of the recipient plant species. In this process, scientists isolate tissue or cells from the cultivar they wish to transform and use one of several methods to insert the transgene into the tissue or cells. Two commonly used transformation methods include Agrobacterium tumefaciens-mediated transformation and biolistics transformation, commonly referred to as particle bombardment. The biolistics method involves the use of high pressure to propel tungsten or gold beads coated with DNA of the gene construct into plant cells.
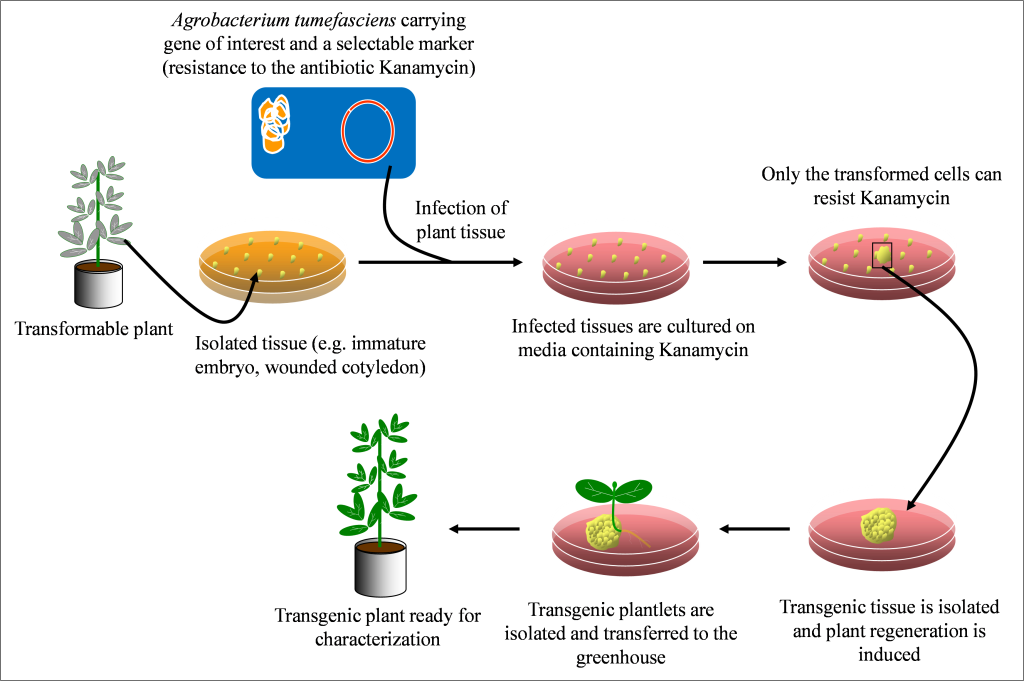
Agrobacterium is naturally found in soils and can infect many plant species by inserting its DNA into plant cells causing a disease called crown gall. In the early days of genetic engineering, scientists became interested in Agrobacterium’s ability to insert its DNA into plant cells. They subsequently modified the Agrobacterium by removing its ability to cause disease but retaining its ability to transfer foreign DNA into plant cells. The steps in Agrobacterium-mediated transformation of plants are described in figure 10.
The two most common examples of novel genes developed by genetic engineering that currently are used in commercial cultivars are insect resistance and herbicide tolerance.
Genes for insect resistance
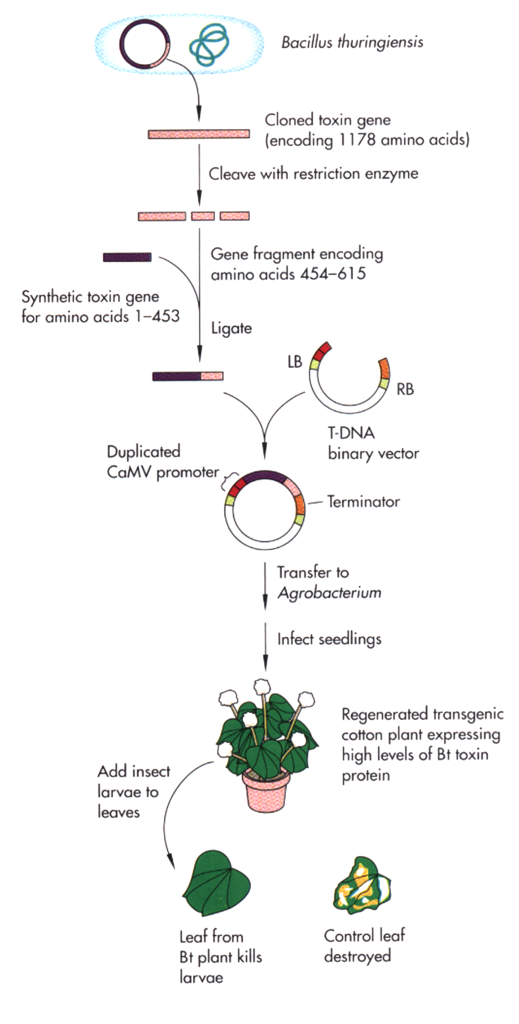
Novel genes for insect resistance and herbicide tolerance have been obtained from other species and introduced into plants. For example, Bacillus thuringiensis (Bt) is a bacterium that produces crystal proteins that when ingested are toxic to the larvae of a number of insects. The gene that produces the crystal protein was isolated from Bt and was modified so that it could be better expressed in plant tissues. Transgenic plants expressing this bacterial toxin are commercially available. The steps involved in the engineering of Bt crops are illustrated in figure 11.
An example of transgenic insect-tolerant cultivars can be found at the following:
Genes for herbicide tolerance
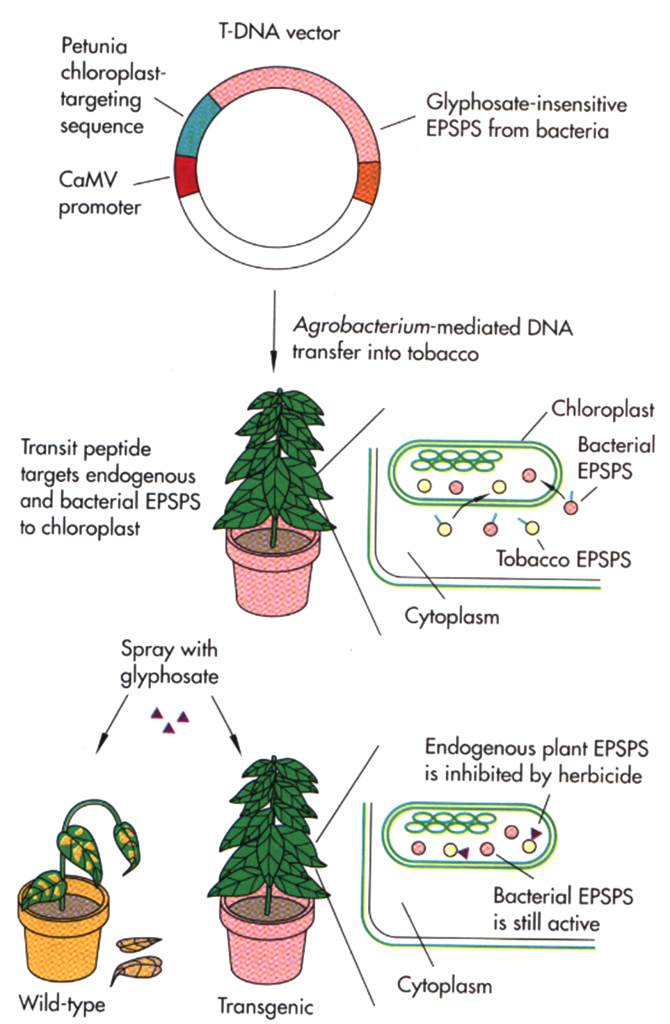
When high levels of tolerance to a herbicide cannot be obtained by conventional breeding methods, other sources of tolerance such as bacterial genes have been be used to genetically engineer herbicide tolerance. For example, tolerance to glyphosate, the active ingredient in the herbicide Roundup, was obtained by inserting into plants a gene from a bacterium that was found to be resistant to the herbicide (figure 12). The 5-enol-pyruvylshikimate-3-phosphate synthase (EPSP) enzyme in plants is required for the production of certain amino acids. The EPSP enzyme is destroyed by glyphosate and the plant dies. The bacterial EPSP enzyme is not destroyed by glyphosate; therefore, plants that contain the bacterial EPSP are tolerant to the glyphosate.
Another important herbicide tolerance trait is resistance to glufosinate. Glufosinate is the active compound in the herbicide Liberty. Transformed glufosinate-tolerant crops contain either the bar or pat transgenes that can destroy glufosinate and decrease the ability of the herbicide to kill the plant. Both genes were isolated from bacteria.
An example of transgenic herbicide tolerant crops can be found at the following:
Inheritance of a transgene in plants
Transformation is successful when a transgene is incorporated into one of the chromosomes. The cells that have only one copy of the transgene in their genomes are said to be hemizygous (hemi = half, zygous = zygote). Because the segregation in the progeny of a hemizygous plant is the same as for a heterozygous plant, the term heterozygous will be used in this course when referring to a plant that is not homozygous for the transgene. The trait will segregate in the progeny in the same manner as any other gene in the plant as illustrated below (Figure 13).

The tissue culture process of regenerating transgenic plants from callus may result in genetic variation that is not associated with the transgene. Also, the parent line used for transformation commonly is selected for the frequency with which useful events can be obtained and not its agronomic performance. Therefore, transgenes are incorporated into commercial cultivars by conventional breeding procedures, such as backcrossing.
Review Questions
- Describe a hypothetical or real trait, other than those discussed in the text above, for which it would it be an advantage to use marker-assisted selection (MAS) in a breeding program, instead of phenotypic selection?
- Describe a hypothetical or real trait, other than those discussed in the text above, when MAS would be less desirable to use than phenotypic selection?
- Describe the hypothetical DNA sequence of two parents that are polymorphic for an SSR that could be used to track two alleles of a gene of interest. Draw a picture of how the two SSR alleles would look on a gel after electrophoresis. Be sure to label the negative and positive poles of the gel.
- Describe the hypothetical DNA sequence of two parents that are polymorphic for a SNP that could be used to track two alleles of a gene of interest.
- What are two major advantages of a SNP in a functional gene compared with a linked SNP?
- Describe the DNA sequence at the restriction site for a specific restriction enzyme that you could purchase from a supplier. Illustrate the difference in the DNA sequence of two alleles that can be detected with the use of restriction enzyme. Draw a picture of how the two alleles would look on a gel after electrophoresis. Be sure to label the negative and positive poles of the gel.
- Below is a gel profile of an SSR marker linked to the Rag1 allele for partial resistance to the soybean aphid resistance for four parents, P1 (lane 1), P2 (lane2), P3 (lane 3), and P4 (lane 4). P3 was used as the female parent in crosses to each of the other parents (P1, P2, and P4). Lanes 6 through 10 are the gel results for the plants that grew from seed produced by artificial hybridization, some of which may be the result of accidental self-pollination.
Answer the following questions using the agarose gel picture and the sequence data below.
-
- What is the number of the three-base repeats for each parent based on the sequence data?
- Describe the relationship between the number of repeats in each parent and the distance its DNA traveled on the gel during electrophoresis.
- Determine which plants in lanes 6 to 10 are F1 hybrids and which are accidental selfs.
- Indicate which parents were crossed to create each of the F1 hybrids.
- If the F1 hybrid for lane 6 is selfed to produce F2 progeny, how many different gel patterns will be observed in the F2 progeny? Describe the gel patterns and their frequencies.


Variant in the DNA sequence used as an identifier or tag of a particular aspect of phenotype and/or genotype. The inheritance of the molecular marker can be traced from generation to generation.
The presence of two or more variant forms of a specific DNA sequence that can occur among different individuals or populations.
A technique which uses electricity to separate molecule fragments according to size so they can be studied.
An organism that has a gene copy in only one chromosome in a chromosome pair (i.e., during the transformation process, the transgene will insert into only one chromosome of a pair).
