
1.0 Aquaculture Industry Overview
1.3 Cultured Species
The total yield for 2019 global freshwater aquaculture was 52 million tons, brackish water aquaculture produced 10 million tons, and marine species contributed 23 million tons.[1] The following figure shows the aquacultured species having the greatest production in aquaculture that are grown around the world, as noted in the FAO report on fisheries and aquaculture in 2022.[2]
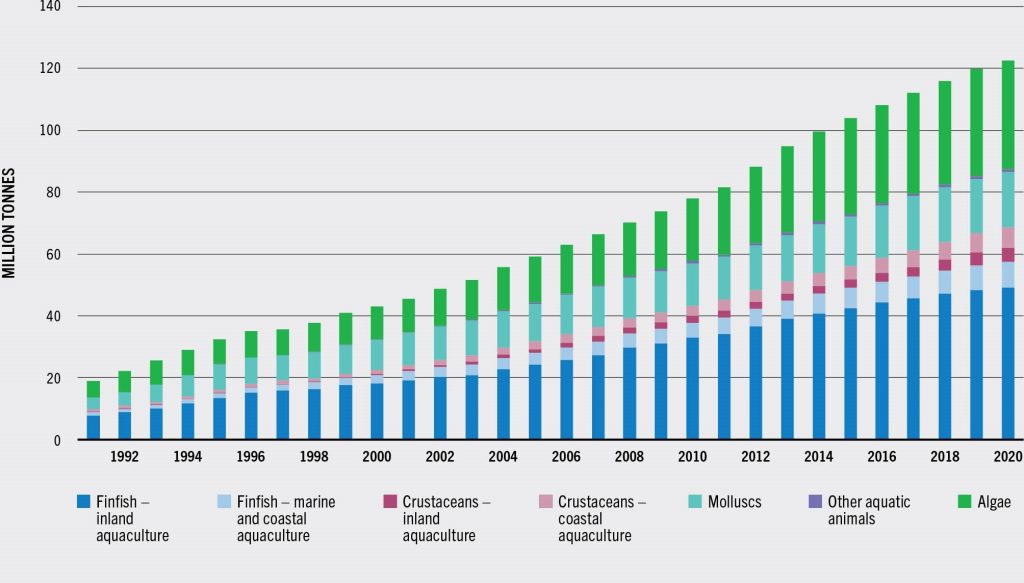
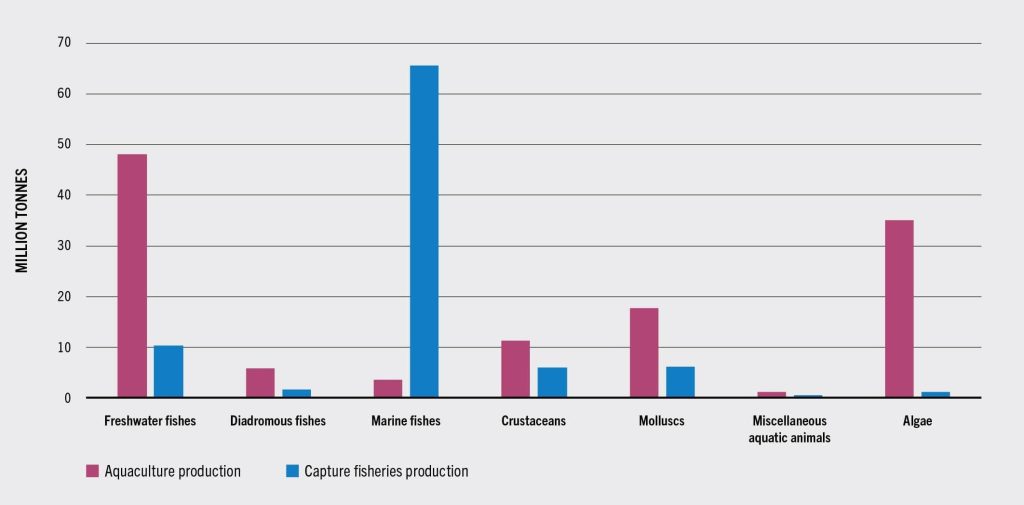
The harvest of cultured marine species is currently a fraction of the wild capture totals. For the most accurate study of the production number, please review the updated publications referenced, as new versions will be created in the coming years. In some cases, the numbers may be quoted for all aquatic animal species’ total annual production. This huge diversity of species is composed of both vertebrates and invertebrates raised for food and for ornamental fish markets. The types of aquatic animals reared for food range from finfish, like top predatory fish (salmon and tuna), to shellfish, such as the filter-feeding molluscs, and aquatic plants.
Finfish
Specific finfish species are reared for societal cultural reasons, and others are cultured under site-specific growing conditions in different regions. Common carp (Cyprinus carpio) and associated species may not be as appreciated in North America as it is in other regions, but it adapts to most growing conditions. These species are efficient herbivores for the most part and thrive at a much lower trophic level and in conditions not habitable by the carnivorous predator food fish that are most sought in the United States.[3] It is notable that 75% of world aquaculture production is from freshwater habitat. The chart below gives a better visualization of how prominent freshwater species are used for farming in aquaculture.[4]
Marine species are important in trade value but may be limited in the balance between expansion of production and availability of wild-fish sources for feed production.
Tables 1 and 2 show a variety of fish commonly used in aquaculture to show the fish with the highest production.[5]
|
Finfish (inland aquaculture) |
2000 |
2005 |
2010 |
2015 |
2020 |
Percent of total, 2020 |
|
Grass carp, Ctenopharyngodon idel/us |
2,976.5 | 3,396.6 | 4,213.1 | 5,315.0 | 5,791.5 | 11.8 |
|
Silver carp, Hypophthalmichthys molitrix |
3,034.7 | 3,690.0 | 3,972.0 | 4,713.6 | 4,896.6 | 10 |
|
Nile tilapia, Oreochromis niloticus |
1,001.5 | 1,721.3 | 2,637.4 | 4,000.9 | 4,407.2 | 9 |
|
Common carp, Cyprinus carpio |
2,410.4 | 2,666.3 | 3,331.0 | 4,025.8 | 4,236.3 | 8.6 |
|
Catla, Cat/a cat/a |
602.3 | 1,317.5 | 2,526.4 | 2,313.4 | 3,540.3 | 7.2 |
|
Bighead carp, Hypophthalmichthys nobilis |
1,438.9 | 1,929.5 | 2,513.6 | 3,109.1 | 3,187.2 | 6.5 |
|
Carassius spp. |
1,198.5 | 1,798.2 | 2,137.8 | 2,644.1 | 2,748.6 | 5.6 |
|
Striped catfish, Pangasianodon hypophthalmus |
113.2 | 411.2 | 1,749.4 | 2,083.2 | 2,520.4 | 5.1 |
|
Roho labeo, Labeo rohita |
733.9 | 1,435.9 | 1,133.2 | 1,785.3 | 2,484.8 | 5.1 |
|
Clarias catfishes, Clarias spp. |
48.8 | 149.5 | 343.3 | 923.7 | 1,249.0 | 2.5 |
|
Tilapias nei, Oreochromis spp. |
123.9 | 199.3 | 449.6 | 929.9 | 1,069.9 | 2.2 |
|
Wuchang bream, Mega/obrama amblycepha/a |
445.9 | 477.2 | 629.2 | 723.2 | 781.7 | 1.6 |
|
Rainbow trout, Oncorhynchus mykiss |
340.4 | 360.0 | 464.7 | 546.5 | 739.5 | 1.5 |
|
Black carp, Mylopharyngodon piceus |
149.0 | 280.7 | 409.5 | 541.2 | 695.5 | 1.4 |
|
Largemouth black bass, Micropterus sa/moides |
0.2 | 140.3 | 179.5 | 321.5 | 621.3 | 1.3 |
|
Subtotal of 15 major species |
14,618.2 | 19,973.5 | 26,689.7 | 33,976.3 | 38,970.1 | 79.3 |
|
Subtotal other species |
3,546.6 | 4,260.1 | 6,337.7 | 8,535.7 | 10,150.4 | 20.7 |
|
Total |
18,164.7 | 24,233.6 | 33,027.4 | 42,512.0 | 49,120.5 | 100 |
|
Finfish (marine and coastal aquaculture) |
2000 |
2005 |
2010 |
2015 |
2020 |
Percent of total, 2020 |
|
Atlantic salmon, Sa/mo sa/ar |
895.7 |
1,266.6 |
1,433.8 |
2,380.2 |
2,719.6 |
32.6 |
|
Milkfish, Chanos chanos |
429.7 |
542.9 |
750.5 |
1,012.3 |
1,167.8 |
14 |
|
Mullets nei, Mugilidae |
92.4 |
173.7 |
102.7 |
129.2 |
291.2 |
3.5 |
|
Gilthead seabream, Sparus aurata |
87.3 |
110.8 |
142.3 |
168.8 |
282.1 |
3.4 |
|
Large yellow croaker, Larimichthys croceus |
0.0 |
60.9 |
83.3 |
142.4 |
254.1 |
3 |
|
European seabass, Dicentrarchus labrax |
60.7 |
90.9 |
118.0 |
149.1 |
243.9 |
2.9 |
|
Groupers nei, Epinephe/us spp. |
7.6 |
57.1 |
77.2 |
149.2 |
226.2 |
2.7 |
|
Coho(=Silver) salmon, Oncorhynchus kisutch |
108.6 |
115.1 |
124.8 |
140.7 |
221.8 |
2.7 |
|
Rainbow trout, Oncorhynchus mykiss |
155.3 |
202.0 |
287.7 |
204.1 |
220.1 |
2.6 |
|
Japanese seabass, Lateo/abraxjaponicus |
0.6 |
79.6 |
104.8 |
120.6 |
196.9 |
2.4 |
|
Pompano, Trachinotus ovatus |
0.0 |
0.0 |
80.0 |
110.0 |
160.0 |
1.9 |
|
Japanese amberjack, Serio/a quinqueradiata |
136.8 |
159.7 |
138.9 |
140.3 |
137.1 |
1.6 |
|
Nile tilapia, Oreochromis niloticus |
1.6 |
5.3 |
20.3 |
49.8 |
107.4 |
1.3 |
|
Barramundi(=Giant seaperch), Lates calcarifer |
18.1 |
27.0 |
52.7 |
68.7 |
105.8 |
1.3 |
|
Red drum, Sciaenops ocel/atus |
2.1 |
42.4 |
53.0 |
71.3 |
84.3 |
1 |
|
Subtotal of 15 major species |
1,996.6 |
2,933.9 |
3,569.9 |
5,036.7 |
6,418.2 |
77 |
There are two other groups of fish produced for nonfood purposes in the United States and elsewhere that are mentioned in this overview of the aquaculture industry. Baitfish is a separate category of fish production in the United States that involves numerous species. The baitfish industry is the fourth largest aquaculture industry in the United States.[6] Baitfish are small species or in early life stages and used for fishing as live bait or to feed cultured or captive carnivorous species. The top three species of cultured baitfish are golden shiners (Notemigonus crysoleucas), fathead minnows (Pimephales promelas), and goldfish (Carassius auratus). There is a sizeable portion of the industry that is still wild caught as when the industry began. Wild caught provides up to two thirds of the sales in some regions. The unmet need is provided by farm-raised baitfish.[7] There is environmental concern of overfishing in some areas. Secondly, biosecurity issues from moving species and pathogens between water sheds is a possibility if suitable precautions are not taken. Thirdly, there is the risk of invasive species (animal and/or plant) being moved with inadequately sorted catches. Although heavily dispersed in the United States, Arkansas is the largest source of farm-raised baitfish in the United States.[8]
The second aquaculture industry not so visible in many publications in the industry is ornamental fish. The rearing of both freshwater and marine species can be included. The majority of the U.S. ornamental fish industry is located in southern Florida. The scope of the ornamental fish industry globally is startling when first studied. Over 5,000 species are sold, 90% are freshwater tropical fish, and 1,000 freshwater species are widely available. However, about 30 species of freshwater fish dominate the markets around the world. The freshwater ornamental fish are estimated to be 90% captive bred. Lower numbers of marine ornamental fish are being traded, but ornamental fish have higher value and a higher percentage are wild caught.[9] There has been considerable debate on the sustainability of capturing wild populations to supply the high consumer demand to display unusual fish specimens. Nonetheless, the trade has made several significant discoveries on captive breeding and rearing techniques that are now preserving some species that have become extinct in the wild. The largest source of marine ornamentals is the Philippines and primarily around the coral reefs. This coral reef hunting is further stressing the stressed reefs suffering from ocean warming.[10]
Shellfish Species
Shellfish species (mollusc and crustacean) reared in aquaculture are mostly marine or brackish water species, though there are some freshwater crustaceans being produced. The FAO of the United Nations indicates there are around 65 species of mollusc and crustaceans reared globally. These species include oysters, shrimp, clams, and other aquatic invertebrates. A great example are the various types of oysters that can produce pearls. The so-called pearl oysters are a high-value product for the gems harvested.[11]
The highest production of aquaculture comes from the category of seaweed and molluscs. The filter-feeding species of shellfish (i.e., molluscs) are put in the category of extractive species because they are not fed during rearing. Nutrients are obtained from the water around them. This application of filter-feeding species contributes to the sustainable side of aquaculture in the environmental cost-benefit calculation.
Aquatic Plants
The production of aquatic plants (algae and seaweeds) sometimes eclipses the production of other aquaculture sectors, especially crustacean production values. Production of aquatic plants provides a large contribution to human and animal nutrition as well as fertilizer, biofuel, and environmental benefits.[12],[13]
- FAO. 2021. FAO Yearbook. Fishery and Aquaculture Statistics 2019 ↵
- FAO. 2022. The State of World Fisheries and Aquaculture 2022. Towards Blue Transformation. Rome, FAO. https://doi.org/10.4060/cc0461en ↵
- Balon, E. K. (1995). The common Carp, Cyprinus carpio: its wild origin, domestication in aquaculture, and selection as colored nishikigoi. Guelph Ichthyology Reviews, 3. ↵
- FAO. 2022. The State of World Fisheries and Aquaculture 2022. Towards Blue Transformation. Rome, FAO. https://doi.org/10.4060/cc0461en ↵
- Food and Agriculture Organization of the United Nations. (2022). The state of world fisheries and aquaculture 2022. Towards blue transformation. Rome, FAO. https://doi.org/10.4060/cc0461en ↵
- Engle, C. R., & Stone, N. (2007). Baitfish production: Enterprise budget. Oklahoma Cooperative Extension Service. ↵
- Meronek, T. G. (1994). Status of the bait industry in the north central region of the United States (Doctoral dissertation, University of Wisconsin-Stevens Point, College of Natural Resources). ↵
- Hoy, M. D., Jones, J. W., & Bivings, A. E. (1989). Economic Impact and Control of Wading Birds at Arkansas Minnow Ponds. ↵
- Evers, H.-G., Pinnegar, J. K., & Taylor, M. I. (2019). Where are they all from? - sources and sustainability in the ornamental freshwater fish trade. Journal of Fish Biology, 94, 909–916. https://doi.org/10.1111/jfb.13930 ↵
- Shuman, C. S., Hodgson, G., & Ambrose, R. F. (2004). Managing the marine aquarium trade: is eco-certification the answer?. Environmental Conservation, 31(4), 339-348. ↵
- Saidi, I., Johnston, B., & Southgate, P. C. (2017). Potential profitability of pearl culture in coastal communities in Tanzania. Aquaculture Reports, 5, 10–17. https://doi.org/10.1016/j.aqrep.2016.11.003 ↵
- Meng, Gu, X., Liang, H., Wu, M., Wu, Q., Yang, L., Li, Y., & Shen, P. (2022). Optimized preparation and high-efficient application of seaweed fertilizer on peanut. Journal of Agriculture and Food Research, 7, 100-275. https://doi.org/10.1016/j.jafr.2022.100275 ↵
- Nazemi, M., Unnthorsson, R., & Richter, C. (2023). Seaweed Pellets as a Renewable Fuel Feedstock. Biomass, 3(1), 78–95. MDPI AG. http://dx.doi.org/10.3390/biomass3010006 ↵
