
6.0 Infectious Diseases in Fish
6.6 Epidemiology in action
As we saw in the last chapter, the basic records kept in production which include dates and daily mortalities can aid in the early detection and prevention of disease outbreaks. This is a simple example of epidemiology in action.
Epidemiology is the study and analysis of the distribution (who, when, and where), patterns and risks of health and disease conditions in a certain or limited population. Epidemiologists visualize health across time to detect and control the spread of disease.
Monitoring Infections and Analyzing Epidemiological Curves
Monitoring infections when they occur is crucial. The timing, period of occurrence, and severity of infections can serve as valuable indicators that support the diagnostic process. Epidemiological curves, which graphically represent outbreaks over time, provide insights into the rapidity and severity of illnesses, as well as the speed of transmission.
The following three graphs illustrate various scenarios of horizontal transmission and the types of pathogens or exposures associated with them. These curves are plotted with time (in weeks) on the x-axis and mortality (fish per week) on the y-axis.
Graph One: Rapid Transmission
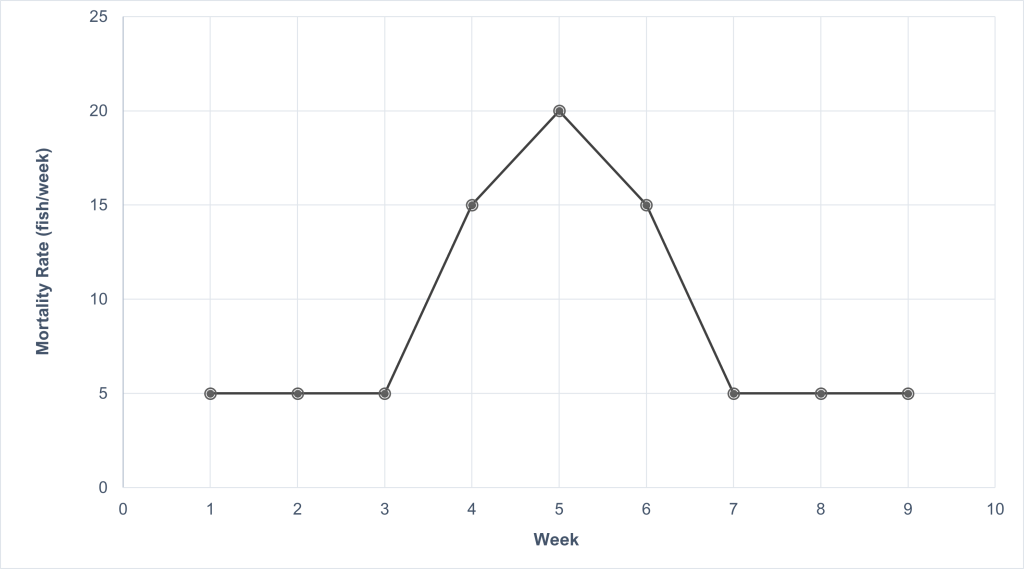
Agent: Bacterial Pathogen
In this graph, the width of the curve is proportional to the incubation time and the period of communicability of the pathogen. Typically, bacterial pathogens are involved. The wider the curve, the longer the incubation period and period of communicability. This scenario suggests rapid transmission within the population.
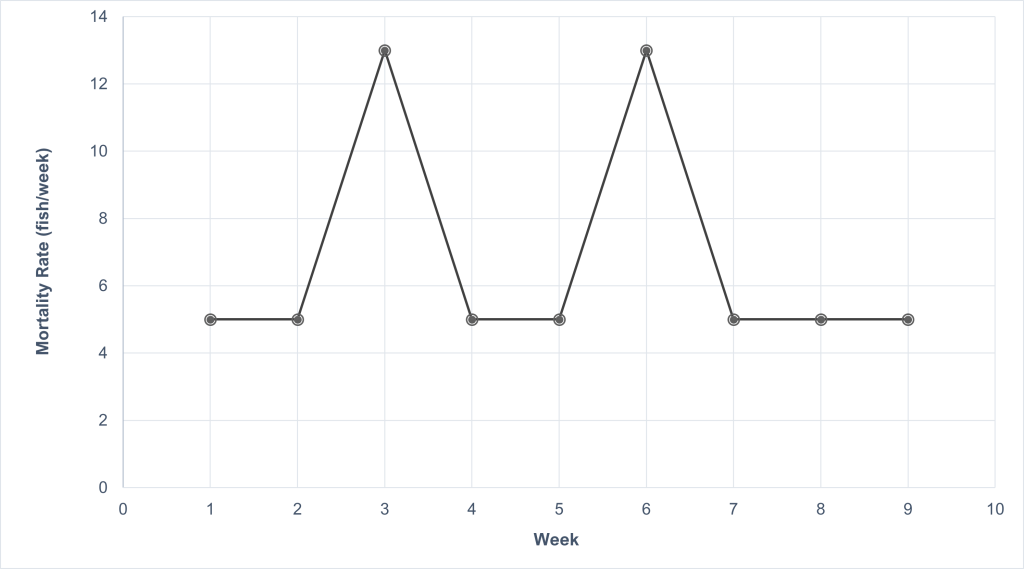
Graph Two: Single Point Exposure
Agent: Chemical or Viral
In this case, the curve width is reduced. The area under the curve may be equal, depending on the severity of the exposure. This graph represents a population at risk exposed to the pathogen at a single point in time. All susceptible members of the population are affected. The differential diagnosis should consider a highly virulent pathogen or exposure to a toxic agent, such as a chemical or viral pathogen.
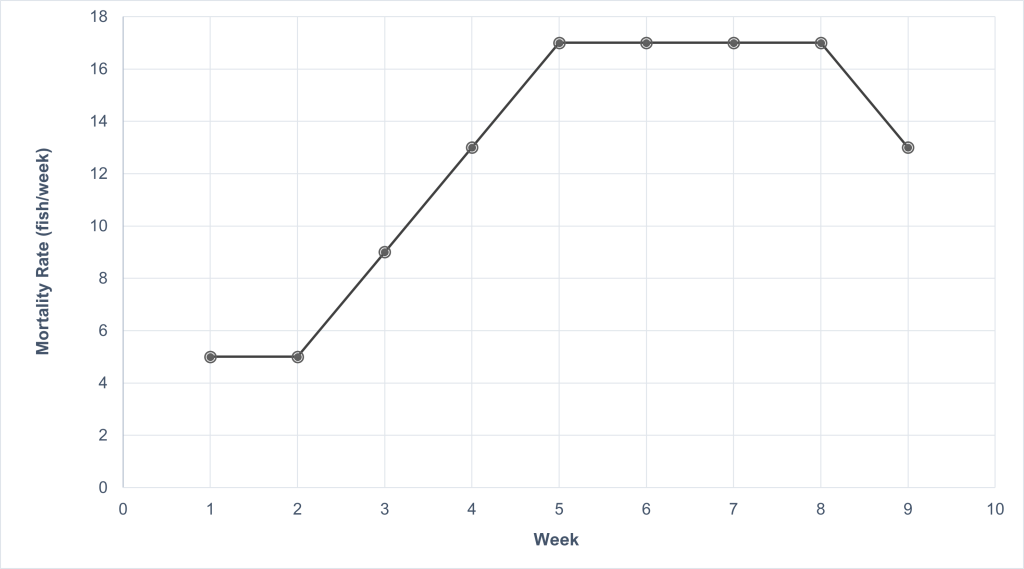
Graph Three: Intermittent Exposure
Agent: Nutritional or Chronic Disease
Graph three indicates exposure over a longer time with a slow incubation period and subsequent slow transmission. This scenario is often associated with frequent but intermittent exposure to disease agents. Over time, the data may indicate a plateau effect as individual curves blend in large populations. It’s important to exercise caution in resampling (frequency of samples) to ensure that samples are taken from infectious animals rather than convalescent or noninfectious ones.
Recurring Subacute Events
Sometimes, the clinical signs including mortality remain at less than acute levels, leading to recurring subacute events. This could include situations like low dissolved oxygen levels recurring nightly or insufficient dechlorination of replacement water on an weekly automated repeating schedule. Detecting such events may be challenging, as the focus is often on larger incidents. These scenarios can be visualized on epidemic curves if time and losses are plotted at smaller intervals.
In summary, epidemiological curves provide valuable insights into the dynamics of disease outbreaks, allowing for better understanding and management of infections in aquatic populations.
