
7.0 Fish Nutrition
7.6 Energy Usage
The three energy sources in fish diets include protein, fat, and carbohydrate. Recall that metabolic processes acquire energy from one of the three energy supplies. This energy is necessary to conduct normal functions – muscle activity, combating concentration gradients, and energy-dependent physiological functions.
Fish overall has low energy needs for several reasons. The body temperature is not stable because of fluctuations corresponding to environmental changes. Residing in the neutral buoyancy of water requires less muscle activity to maintain a physical location or move about by muscle activity. Finally, significant savings through excreting nitrogenous metabolic waste in the form of ammonia directly from the gills. Table 3 provides simple conversion rates for formulating diets.
|
Metric |
English |
|
1 kg |
2.2 lbs |
|
1 mg/kg |
454 g = 16 oz |
|
1 lb |
28.3 g |
|
1 oz |
29.5 ml |
|
1 fl oz |
1000 calories (1 calorie human nutrition) |
|
1 USP unit |
1 IU |
|
1 KIU |
1000 IU |
|
% |
G/100g OR lbs/100 lbs |
When working in nutrition, there are often many mathematical calculations to make. A calculation risk arises from the lack of a universal measurement system. Scientific information is typically published in Metric units, while feeds or the ingredients may be available for sale or use in English units. Table 3 gives some useful conversions for maneuvering between the two systems. Notice, for example, the dry weight and fluid weight’s specific values. 1oz dry weight is 28.3g, while one fluid oz (USA) is 29.5 ml. The notation of USA is because there are Imperial units that utilize oz. Lbs. and gallons. It seems reasonable to recall “a pint is a pound the world around” as a go-to standard across many of the world’s systems of measure. The metric units are more convenient to move between liquid and dry measures since 1mg/kg=1ppm just as 1ml/l=1ppm.
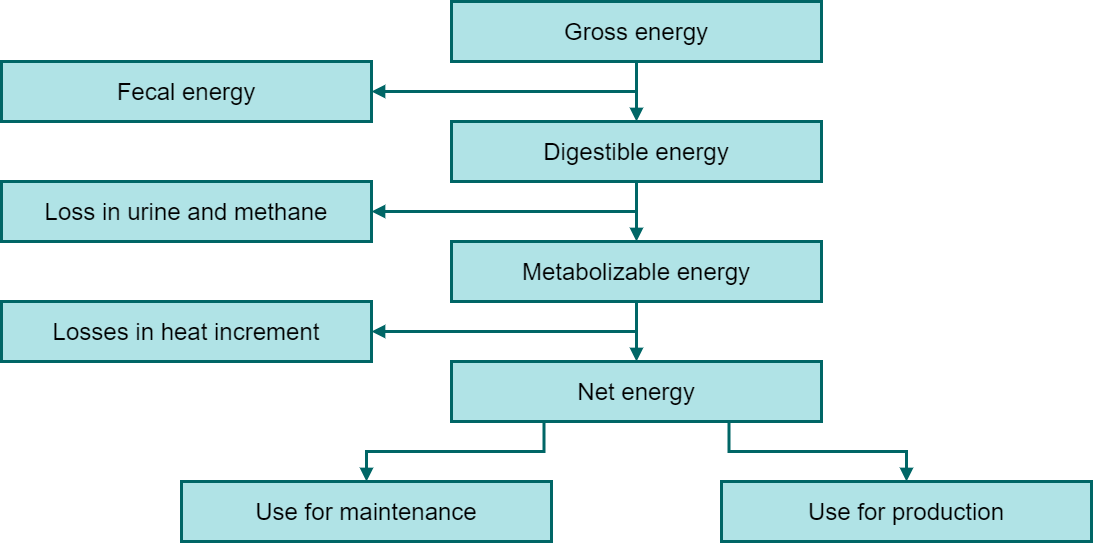
Energy is used or expended in several ways.
The types of energy derived from a diet for the fed species are displayed in Table 4. The net energy remaining after the losses is used to maintain basic metabolic functions and production energy. This energy category is called maintenance energy (ME) or net energy, depicted in the image to the left. This ME is the energy expended to maintain the basal functions of the body. Energy for movement, reproduction, food prehension, and growth is in addition to the basic maintenance requirements. Note that terrestrial animals have an added maintenance cost to stand or change resting positions. This energy is to counter the force of gravity. As listed previously, fish are not hobbled by this energy cost since buoyancy can be taken advantage of. The maintenance portion of the diet will include further divisions for maintaining the electrolyte pumps at a rate of 55-60% of ME. This value may vary greatly depending on the environment, age, and gender.
Thermogenesis, or generating body heat, is 10% of the maintenance diet in mammals. Thermogenesis is irrelevant in fish except for the few species with heat exchange mechanisms for deep diving.[1]
The fish expend around 25% of the maintenance energy for a functioning heart and gills. Enzyme synthesis and replacement functions can consume 5-10% of the baseline energy.
Energy for ammonia excretion is much lower in teleosts because they excrete ammonia through the gills, while mammals lose 2-8% of maintenance energy sending urea through the kidney. It should be noted that elasmobranchs utilize urea to excrete byproducts of protein catabolism, but they also use urea as an osmolyte to manage the osmotic pressures in variable environments.
Considering the different functions involving ME and the unique functions performed or not performed by animals to be fed, it is useful to calculate Basal Energy Requirement (BER) requirements for different animals. BER is the energy required to maintain the body’s normal metabolic activity, i.e., respiration, maintenance of body temperature, production of enzymes, and necessary movement. It is understandable that if an animal does not regulate body temperature, the basal energy is decreased. If the animal is buoyant in the water while another animal species is lifting itself against gravity, the BER will be different. The BER, also known as Maintenance Energy Requirement (MER), is a useful value to keep in mind across species. BER is calculated as shown in the equation:
BER = K value X (BW in kg).75 in Kcal of DE/day
K value is a constant calculated for each species. In the following list, the animals have been grouped into listed categories for comparison:
- 10 for most freshwater & saltwater fish
- 10 for reptiles
- 49 for marsupials that have a body temperature of 90-99 F
- 70 for placental mammals
- 78 for non-passerine birds (non-perching, larger birds, i.e., chickens, turkeys)
- 129 for passerine birds (perching w/ 3 toes forward, one backward & usually smaller birds)
In order to meet the BER, the diet must not only analyze the specified nutrient values but must provide the nutrients to the animal at a usable level. That leads to the discussion of energy partitioning (EP) of feed.
Simply explained, most nutritional models of animal growth are based on partitioning energy between expenditure and deposition of protein and lipid.
For BER to be satisfied, the supply of energy via proteins, fats, and carbohydrates must be usable. The three forms of energy must also be in a useful ratio to the animal’s metabolism. Determining EP for each life stage predicts the animal’s carcass outcome, i.e., large & muscular, small & obese, large & obese. Reviewing the use of the three energy sources in fish, we remember that excess protein can be metabolized in several ways depending on availability. Muscle is the desired use of protein for food fish in most cases. Protein is also a good way to provide the needed energy for maintenance. The energy of excess protein is converted to fat, for example. Too much protein will not necessarily convert to greater muscle growth. Excess protein or other energy sources is an unnecessary financial burden. Feed costs are the major expense in rearing aquatic livestock in intensive culture systems to gain the whole-body protein and lipid deposition and fatty acid composition desired by the consumer. Moreover, the partitioning of these nutrients between different body tissues will have an impact on carcass quality.
There are three energy categories in EP discussions: gross energy, digestible energy, and gross energy of combustion.
- Gross energy (GE) is the energy liberated from food after complete oxidation or energy release from metabolism processes. The analogy may be burning a piece of wood. The total energy from the burning is gross energy. The total energy of different wood pieces varies by tree species. So the gross energy of the diet varies by the ingredients used.
- Digestible energy (DE) is the amount of energy removed from the GE before the remainder of the feed is excreted in feces as fecal energy (FE).
- GE – FE = DE
- Regarding fish, this GE – FE calculation is as accurate as we can to evaluate the digestible value of a feed ration for energy. Remember, the GE in an animal’s diet comes from proteins, fats, and carbohydrates.
- Gross Energy of Combustion (GEc) is the possible oxidation energy obtained from these components. The evaluation is the difference between the maximum available oxidation energy in the feedstuff and what the animal can extract for energy. A comparative analogy, in this case, might be oversimplified to think of the difference between the total energy from a piece of wood burned versus kernels of corn in the ration. It is easier for the animal to take energy from a kernel of corn than from a piece of wood. Corn has more DE than wood because of its composition and the digestive mechanisms in the animal.
The maximum GEc and DE can be calculated from the following:
|
Energy source |
GE (kcal/g) |
DE for fish (kcal/g) |
|
Carbohydrates |
4.1 | 1-4 |
|
Fats |
9.4 | 9.0 |
|
Proteins |
5.7 | 5.2 |
- Dickson, K. A., & Graham, J. B. (2004). Evolution and consequences of endothermy in fishes. Physiological and Biochemical Zoology, 77(6), 998-1018 ↵
