
13 Introduction to Mendelian Genetics
Donald Lee; Walter Suza; Amy Kohmetscher; and Marjorie Hanneman
- Outline the experimental approach Mendel used to propose the idea that genes exist, control traits, and are inherited in predictable ways.
- Compare the methods used by Mendel and Punnett to predict trait inheritance.
Introduction
In plant and animal genetics research, the decisions a scientist will make are based on a high level of confidence in the predictable inheritance of the genes that control the trait being studied. This confidence comes from a past discovery by a biologist named Gregor Mendel, who explained the inheritance of trait variation using the idea of monogenic traits.
Monogenic characters are controlled by the following biological principles:
- Living things have genes in their cells that encode the information to control a single trait. These genes are stable and passed on from cell to cell without changing.
- The genes are in pairs in somatic cells. When these cells divide to form gametes, the pair of genes is divided. One gene from the pair goes into a gamete.
- Male gametes (pollen) combine with female gametes (eggs) in the wheat flower pistil and fuse to form the next generation (zygote). Gamete union is random.
- The zygote, again, has two copies of each gene. As the zygote grows into a multicellular seed and the seed grows into a plant, the same two gene copies are found in every cell.
Let’s take a short genetics history lesson to understand their confidence.
Mendel’s Peas
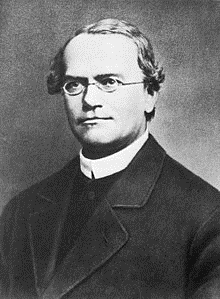
In the mid 1800’s, an Austrian monk named Gregor Mendel (Figure 1) decided he should try to understand how inherited traits are controlled. He needed a model organism he could work with in his research facility, a small garden in the monastery, and a research plan. His plan was designed to test a hypothesis for the inheritance of trait variation.
Since Mendel could obtain different varieties of peas that differed in easy to observe traits such as flower color, seed color and seed shape, and he could grow these peas in his garden, he chose peas as the model organism for conducting his inheritance control study. A model is easy to work with and often what you learn from the model you can apply to other organisms.
The Hypothesis
While many biologists were interested in trait inheritance, at the time Mendel conducted his experiments none of the biologists had published evidence that inheritance could be predicted. Mendel made this bold statement. His hypothesis was that he could observe “mathematical” regularities in the appearance of a trait that was passed on from parents to their offspring. Mendel had the idea that mathematical regularities could be observed and could be used to explain the biology of inheritance!
The Plan
Mendel’s experimental plan was designed to test the hypothesis. He identified true breeding lines of peas by allowing them to self pollinate (which we will refer to as “selfing”) and examining their offspring. Pea plants have flowers that contain both male and female reproductive parts; if a pea flower is left undisturbed, the male and female gametes from the same flower will combine to produce seeds, the next generation. If the pea always made offspring like itself, Mendel had his true breeding line. He then made planned crosses between lines that differed by just one trait (monohybrid crosses). The controlled monohybrid cross was the first step in his experiment that allowed him to look for mathematical regularities in the data for three generations. Table 1 below shows the data from a series of these monohybrid cross experiments.
The Analysis
By summarizing his data in a single table, Mendel could look for those hypothesized math regularities. A regularity is a repeated observation.
|
Character |
Cross and Phenotypes |
F1 |
F2 |
F2 Ratio |
|
Seed form |
Round X Wrinkled |
All round |
5474 Round 1850 Wrinkled |
2.96 to 1 |
|
Cotyledon color |
Yellow X Green |
All yellow |
6022 Yellow 2001 Green |
3.01 to 1 |
|
Seed coat color* |
Gray X White |
All gray |
705 Gray 224 White |
3.15 to 1 |
|
Pod form |
Inflated X Constricted |
All inflated |
882 Inflated 299 Constricted |
2.95 to 1 |
|
Pod color |
Green X Yellow |
All green |
428 Green 152 Yellow |
2.82 to 1 |
|
Flower position |
Axial X Terminal |
All axial |
651 Axial 207 Terminal |
3.14 to 1 |
|
Stem length |
Tall X Short |
All tall |
787 Tall 277 Short |
2.84 to 1 |
*Gray seed coat also had purple flowers; White seed coat had white flowers.
Table 1 demonstrates that Mendel was serious about the math. He generated large numbers of offspring that allowed him to observe mathematical ratios. From his table of data, we can see mathematical patterns appear with every monohybrid cross he made.
- F1: All the plants had the same phenotype as one of the parents.
- F2: Both phenotypes are present, the phenotype that was not expressed in the F1 appears again in the F2 but is always the least frequently produced. The average ratio is about 3:1 for the two phenotypes.
What was striking to Mendel was that every character in his study exhibited the same kind of mathematical pattern. This suggested that the same fundamental processes inside the plant’s reproductive cells were at work controlling the inheritance of each trait.
Now Mendel had the task of providing a description of the fundamental biology process controlling each of these traits. He needed to come up with ideas that no one had yet proposed to explain biology.
New Idea #1:
The traits expressed in the pea plant were controlled by some kind of particle. These hereditary particles are stable and passed on intact from parent to offspring through the sex cells. (NOTE: Sex cells or gametes were not a new idea, Mendel was aware that biologists knew sexually reproducing plants and animals needed to make gametes.) We now call these particulate factors genes and will use that term in the rest of this reading.
New Idea #2:
Genes are stable, and genes can have alternative versions (alleles).
New Idea #3:
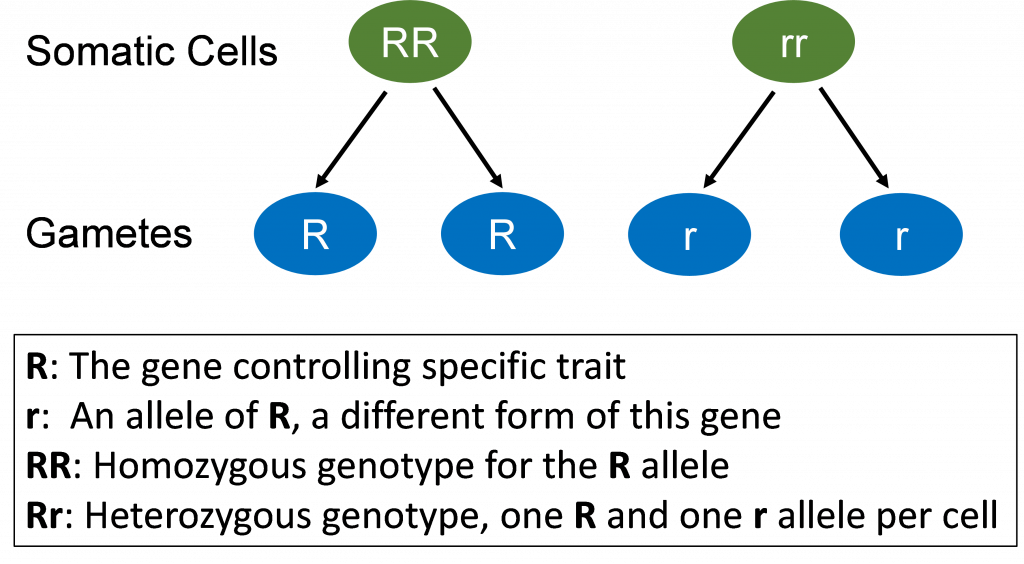
Genes are in pairs in somatic cells and these paired genes separate during gamete formation. Each gamete will have one gene from the pair of genes. The segregating of the paired genes from the somatic cells of the parent into gametes is random. Because segregation is random, a parent that has two different alleles for a gene pair will make two kinds of gametes and makes these gametes at equal frequencies.
From Mendel’s ideas, we can see that in a situation in which there was a normal version of a gene (we can call it the R gene) and an alternate version (r), the plant could produce gametes with just the R gene or just the r gene.
New Idea #4:
Plant flowers are designed to allow male gametes (pollen) to combine randomly with the female gametes (egg). When the gametes randomly come together, they bring the genes they carry to the same zygote. This means plants could have the genotype RR, Rr, or rr in families that have both the R and r alleles.
New Idea #5:
Mendel proposed that the genes controlling a trait not only paired in somatic cells, they also interacted in controlling the traits of the plants. For the traits in his experiment, he proposed that one allele interacted with the other in a dominant fashion. That means a plant that is the genotype RR would have the same phenotype as an Rr plant. The R allele is dominant to the r allele.
Ideas and Data advance science
Those were Mendel’s new ideas; he used them to make sense of his experiment data and observations. Let’s think like Mendel and apply those ideas.
All the F1 were the same
Mendel’s new ideas could explain this observation. Since his parents were true breeding, he was always making a cross between homozygous parents. Homo means the same, so the parents had two copies of the same version of the gene.
Crossing RR X rr plants to produce Rr
Since the R is dominant to r, then the Rr offspring (named the F1) look the same (have the same phenotype) as the RR parent. Therefore, only one phenotype is observed in the F1. But the F1 genotype is different from either parent. It is heterozygous (two different alleles).
The F2: both traits appear in about a 3:1 ratio
Mendel could explain the reappearance of the recessive trait and the ratio by combining the idea of genes with the idea of random segregation. Mendel used simple algebra to explain this result.
First, he wrote out a mathematical expression to account for the gametes made in the male part of the F1 flower or in the female part.
½ R + ½ r = all the gametes made (Figure 2).
Next, he reasoned that if pollen randomly united with the egg to combine the genes in the gametes, then algebra could be used to predict the result by multiplying the gamete expressions.
(½ R + ½ r) X (½ R + ½ r) = all the F2 offspring made.
If we do the multiplication above, we get …
¼ RR + ¼ Rr + ¼ Rr + ¼ rr = ¼ RR + ½ Rr + ¼ rr = predicted fractions of F2 genotypes.
WAIT!
If this math is causing your brain to lose focus, you might be experiencing what Mendel’s contemporaries experienced when they read his published research paper. While many biologists were motivated to understand how the variation among animals and plants was controlled and inherited, it took biologists 30 years to recognize that Mendel’s new ideas to explain inheritance of traits in peas could be applied to inheritance of traits in other living organisms.
One possible explanation for this 30-year delay in appreciation is that it was difficult for biologists to understand how math could explain biology. One biologist that did understand what Mendel was describing was Punnett. Punnett decided to convert Mendel’s algebra into a more graphic representation of the process of gamete segregation and random union.
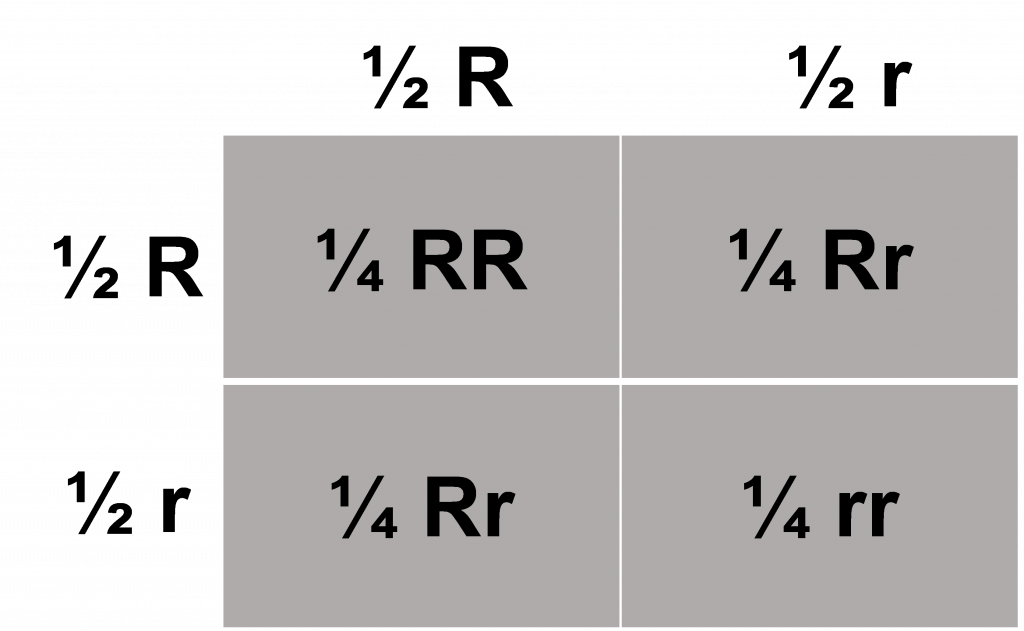
The Punnett Square
Math: (¼ RR + ½ Rr + ¼ rr).
Punnett designated the gametes made in the male and female parents with single letters (Figure 3). The diagram shows that when the gametes combine, the offspring (inside the squares) again have the genes in pairs in their cells. Accounting for the random union of gametes is accomplished with the four squares in the diagram. Two squares give the same Rr result, one the RR genotype and one rr. Both the algebra and diagram approaches provide the same prediction. Crossing an Rr with an Rr will produce three genotypes, RR, Rr and rr. They will be produced in a ratio based on the principle of segregation.
The genes controlling the monogenic traits behaved in predictable ways
Punnett’s diagram clarified for many biologists what Mendel was telling them in his published article. This was a challenging idea to understand because he was asking biologists to use something they could not see (genes) and explain something they could see (traits in peas or some other living organism).
Because Mendel recognized he was proposing a very different idea with the segregation principle, he was likely motivated to share the most convincing evidence possible. Mendel conducted additional experiments. One experiment was to test the hypothesis that there were two different kinds of F2 which expressed the dominant trait, and these two types were being made by the F1 in predictable fractions. How would Mendel show that F2 which had the same phenotype did not always have the same genotype?
Mendel tested the breeding behavior of the F2. Mendel harvested all the selfed seed produced by his F2 and grew progeny rows of F3. His segregation principle predicted that of the dominant F2, there should be two that are heterozygous for every one homozygote made (on average). The results of this experiment are summarized in Table 2. Did Mendel’s data support the hypothesis?
|
F2 type |
Mixed rows |
True breeding |
Ratio |
|
Round seed |
372 |
193 |
1.93 to 1 |
|
Yellow cotyledon |
353 |
166 |
2.13 to 1 |
|
Gray seed coat |
64 |
36 |
1.78 to 1 |
|
Inflated pod |
71 |
29 |
2.45 to 1 |
|
Green pod |
60 |
40 |
1.50 to 1 |
|
Axial flower |
67 |
33 |
2.03 to 1 |
|
Tall plant |
72 |
28 |
2.57 to 1 |
Average ratio heterozygote F2 to homozygote F2 was 2.06 to 1.
The data show that, if we select a sample of F2 with the dominant trait (Round seed or Yellow cotyledon), the principle of segregation predicts that there should be 2 heterozygotes for every 1 homozygotes.
Mendel’s data from rows of F3 that all came from F2 with the dominant trait supported his hypothesis. There were always two kinds of rows (true breeding and mixed) and the rows were in a 2:1 ratio. This fits with the principle of segregation.
By publishing these results in a scientific journal, Mendel allowed other scientists to learn from his work. This story reveals the real power of publishing research in the “permanent” scientific literature. The power of publication does not mean you were right with your science. The real power is that other scientists can find your paper, read it, think about your ideas, and then test them. In Mendel’s case, he was already dead when his fellow biologists discovered that his new ideas to explain the biology of peas were not only correct, but universal in their application.
Mendel’s Dihybrid Cross Experiments
Proper credit must be given to the idea of independent assortment. Gregor Mendel was the first to put this idea down on paper based on what he observed with his pea experiments. Furthermore, Mendel performed additional experiments to back up his ideas. Let’s examine his experiments with peas from the late 1800’s.
The outline below describes Mendel’s dihybrid cross experiments. The pattern observed in the results should look familiar!
The Experiment
- Parents: round seeds, yellow seeds (RRYY) x wrinkled seeds, green seeds (rryy).
- F1: All round and yellow seeds (RrYy).
- Selfing: F1 (RrYy x RrYy):
Mendel explained his results as follows:
The F1 plants have the genotype RrYy and can make four kinds of gametes RY, Ry, rY and ry.
|
|
Possible gametes |
|
Male gametes |
¼ RY + ¼ Ry + ¼ rY + ¼ ry
|
|
Female gametes |
¼ RY + ¼ Ry + ¼ rY + ¼ ry
|
|
|
RY |
Ry |
rY |
ry |
|
RY |
RRYY |
RRYy |
RyYY |
RrYy |
|---|---|---|---|---|
|
Ry |
RRYy |
RRyy |
RrYy |
Rryy |
|
rY |
RrYY |
RrYy |
RrYY |
RrYy |
|
ry |
RrYy |
Rryy |
rrYy |
rryy |
Note that with both the Mendel algebra and Punnett square, the RRYY genotype occurs one time and the RrYy genotype occurs four times (Table 4). Mendel’s algebra and Punnett’s squares can be summarized to give the same results.
Selfing the F2 to produce F3
| Phenotype | Number | Fraction |
| Round, yellow | 315 | 9/16 |
| Round, green | 108 | 3/16 |
| Wrinkled, yellow | 101 | 3/16 |
| Wrinkled, green | 32 | 1/16 |
The easiest experiment to perform was to let the plants self-pollinate and then keep good records. After scoring his 556 F2 seeds (Table 5) he took the 315 that were round and yellow and planted them in one part of his garden. The plants that grew were allowed to self-pollinate. Of the 315 round and yellow seeds planted, 301 plants matured and produced seed. The seed produced was the F3 generation. At harvest, Mendel needed to exercise the utmost care. Each F2 plant was handled separately. The seeds from the plant were harvested and Mendel then scored the F3 seeds that came from the same F2 plant. This can be referred to as F2:3 data and the table below summarizes his complete experiment using all of the F2 phenotypes.
Mendel’s F2 data supported his principle of independent assortment. There were four different types of round yellow F2 based on the kinds of progeny they could produce or their breeding behaviors. Based on the F3 progeny produced, the F2 genotype was deduced. For example, if a round, yellow seed gave all round progeny it must have the genotype RR. If it gave both round and wrinkled it was Rr.
Furthermore, the numbers of F2 plants with each breeding behavior were in agreement with what was expected with independent assortment. There were four times as many round and yellow F2 that gave all four phenotypes of F3 seeds (138) compared to the round and yellow F2 that were true breeding (38). Overall, there were nine types of breeding behaviors demonstrated in the F2 demonstrating that there were nine F2 genotypes. In all cases, the fractions observed in the F2 agreed to the principle of independent assortment. Mendel’s well-planned experiment provided a convincing demonstration that genes behaved in this predictable manner.
The only thing better than performing an experiment that shows you were right about a new hypothesis is performing two experiments that show that you were right. That is what Gregor Mendel did! In his second experiment he crossed dihybrid F1 plants with homozygous recessive plants in a test cross. This type of cross is named because the geneticist wants to perform a cross that will test or reveal the genotype of an organism. Therefore, a test cross is usually made between an organism with a dominant trait and a partner with a recessive version of this trait. Mendel performed the RrYy x rryy testcross and the expected progeny are shown in the Punnett square below:
RrYy gametes: RY, Ry, rY, ry
rryy gametes: all ry
| RY | Ry | rY | ry | |
| ry | RrYy | Rryy | rrYy | rryy |
|---|
Mendel established a rigorous precedent for using carefully planned multi-generation experiments to reveal the principles that governed trait inheritance. The beauty of Mendel’s accomplishments is that both the principles and his experimental approach can be applied to understanding the genetic control and inheritance of traits in many kinds of organisms still today.
Mendel’s principles of segregation and independent assortment are valid explanations for genetic variation observed in many organisms. Alleles of a gene pair may interact in a dominant vs. recessive manner or show a lack of dominance. Even so, these principles can be used to predict the future…at least the potential outcome of specific crosses.
Watch this video about Punnett Squares for more information
