
Chapter 4: Gene Segregation and Genetic Recombination
Deborah Muenchrath; Arden Campbell; Laura Merrick; Thomas Lübberstedt; Shui-Zhang Fei; and Walter Suza
Introduction
Plant breeders take advantage of the variation that occurs within a population to develop improved cultivars. Ordinarily, the goal of the plant breeder is to combine the favorable characteristics of one plant or cultivar with the desirable traits of another plant or cultivar to obtain a new combination that has the best of both. Understanding the genetics of desired, as well as undesirable, characteristics enhances the efficiency of the plant improvement process.
- Understand the molecular basis of genes and chromosomes.
- Understand the basic principles of transcription and translation.
- Understand Mendelian mechanisms and patterns of inheritance.
- Be able to differentiate among different types of gene action.
- Determine genotypic and phenotypic consequences of independently inherited genes through generations of self-pollination.
- Know how epistasis occurs through interaction of genes and alteration of expected phenotypic ratios.
Overview of Genetics
The Science of Genetics
Genetics is one of the principal sciences that underlie plant breeding. Genetics is the study of heredity, genes, chromosomes, and variation in biological organisms. The science of genetics is often divided into four major subdisciplines:
- Transmission genetics (also called classical or Mendelian genetics)
- Quantitative genetics
- Population genetics, and
- Molecular genetics
Transmission genetics deals with how genes and genetic traits are transmitted from generation to generation and how genes recombine. The foundation of modern genetics is recognized to have occurred in the mid-1800s when Gregor Mendel analyzed the results of crosses he made among garden pea plants. Mendel concluded that inherited characteristics (now called traits or phenotypes) are determined by factors (now known as genes) that he observed. He also realized that each organism contained two copies of each “factor” (gene), one inherited from its mother and one from its father. Mendel discovered the principles of heredity when he noticed how inherited traits (e.g., seed shape round vs. wrinkled; pod color yellow vs. green; flower position axial vs. terminal; or plant height tall vs. short) are passed from parents to offspring. Transmission (Mendelian) genetics is the focus of this module.
Genetic Subdisciplines
Quantitative genetics focuses on the study of inheritance when phenotypes exhibit continuous variation or distribution. In particular, it considers the effects of many genes that could be simultaneously influencing such traits, as well as the relative contributions of the environment and the interaction between genotype and environment. Quantitative genetics is the focus of the module on Inheritance of Quantitative Traits.
Population genetics entails a study of heredity in groups of individuals for traits that are usually determined by one or only a few genes. It deals with gene distribution and genetic diversity within and among populations and subpopulations. Population genetics includes assessment and prediction of response to selection. It describes relationships between allele and genotype frequencies due to four main evolutionary forces: natural selection, genetic drift, mutation, and gene flow. Population genetics is the focus of the module on Inbreeding and Heterosis.
Molecular genetics is concerned with the molecular structure and function of genes. It includes the study of DNA structure and replication and deals with gene expression and regulation.
Gene Structure
Genes and Chromosomes
To understand inheritance, it is essential to understand gene structure and action. Let’s review key terminologies and principles. For a more in-depth review, please refer to biology or genetic textbooks, for example, From Genes to Genomes (Hartwell et al. 2011), Genetics: A Conceptual Approach (Pierce 2012), or iGenetics: A Molecular Approach (Russell 2010).
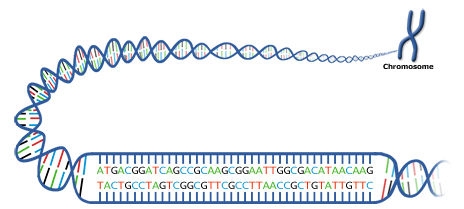
Genes are encoded with DNA. Most of the DNA in plants is located in the nucleus of cells and arranged in groups of genes along multiple, linearly-shaped, chromosomes. Nuclear DNA is subject to Mendelian inheritance, which will be discussed later in this module. In addition to its occurrence in chromosomes in the nucleus, DNA is also located in organelles present in the cytoplasm of plant cells.
In plants, DNA is not just present in the nucleus of cells. It is also located in other membrane-bound, specialized subunits known as organelles that are found within the cytoplasm, or cell fluid. Two plant cell organelles that contain DNA are chloroplasts (which are plastids or organelles that carry pigments-specifically green chlorophyll) and mitochondria (singular, mitochondrion; organelles that break down complex carbohydrates and sugars into usable forms, and thus supply energy for the plant).
The non-nuclear, organellar DNA located in plants follows cytoplasmic inheritance and is not subject to Mendelian inheritance. Cytoplasmic inheritance is also known as extrachromosomal or extranuclear inheritance, and is of significance in certain types of male sterility where the genes for those traits are present in the mitochondria, not in nuclear chromosomes.
Molecular Basis of Chromosomes
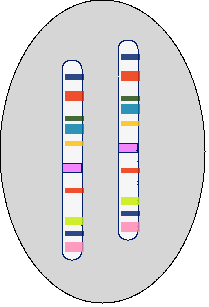
Chromosome – Each chromosome contains a single DNA molecule (Fig. 2).
DNA
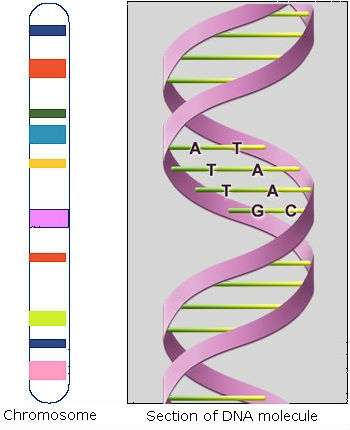
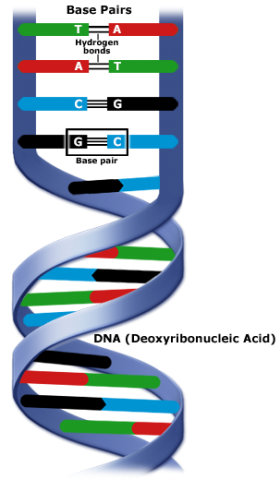
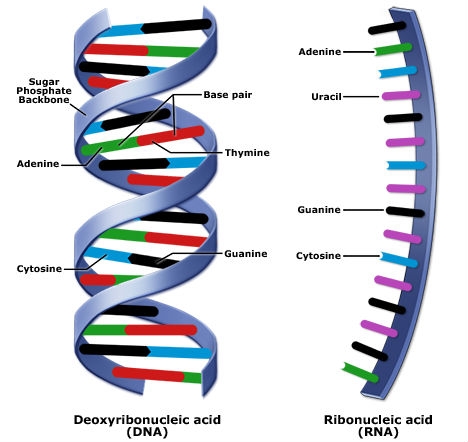
DNA (deoxyribonucleic acid) is composed of two chains of polynucleotides. Polynucleotides are also called nucleic acids, and consist of linear polymers that are macromolecules formed by the chemical joining of many identical or similar units called nucleotides. Every nucleotide in each chain consists of a nitrogen-containing base, deoxyribose (a sugar), and a phosphate group. Nucleotides within each chain are held together by sugar-phosphate (phospho-diester) bonds (Fig. 3).
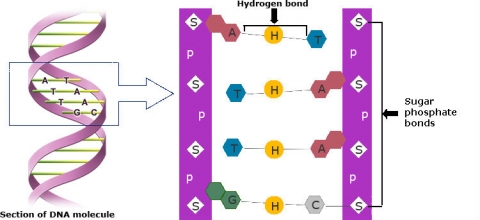
Nitrogen-containing bases are purines (adenine, A, and guanine, G) and pyrimidines (cytosine, C, and thymine, T). Pairing occurs between one purine and one pyrimidine and is specific. Sequences of consecutive nucleotides constitute genes (Fig. 4).
C always pairs with G
T always pairs with A
DNA replication is semiconservative.
The process of DNA replication is not yet fully understood. Basically, there are three steps.
- Two strands of DNA unwind and pull apart.
- Free (unbound) nucleotides bind to complementary bases on an original strand of DNA.
- One newly formed strand and a template DNA strand re-coil to form a double helix.
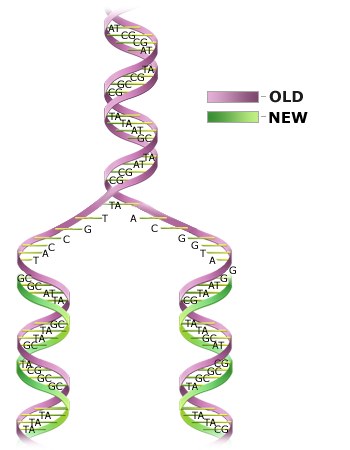
This process is semiconservative because each resulting double-stranded DNA molecule is composed of a newly synthesized strand and a template strand (Fig. 4). Since one strand of each DNA molecule is an original strand, there is less probability of error occurring during replication.
Genes
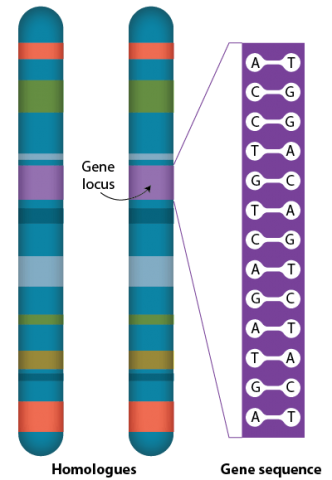
Many genes are present in each chromosome. Each specific gene occurs at a defined point on a chromosome, the gene locus, on each of the two homologous chromosomes. More than one form of a particular gene, alleles, may occupy the same locus on homologous chromosomes.
Alleles
Alleles are variants that differ slightly in their DNA sequence. Diploid plant species have two sets of chromosomes, each of which can possess a different allele for a particular gene. For example, a gene for seed color might have the two alleles, A and a. Allele A causes one phenotype (e.g., brown seed color) and allele a causes a different phenotype (e.g., white seed color). For that gene, the genotype could be either AA, Aa, or aa.
If one allele at a locus on a homologous chromosome partially or completely masks the expression of the other in influencing the phenotype, the allele that is expressed is termed dominant and the allele that is masked is termed recessive. By convention, we often write the dominant form with an uppercase letter, and the recessive form in lowercase. In the example above for seed color, allele A is the dominant allele. If the A allele is completely dominant to the a allele, individuals with either the AA or Aa genotypes would have the brown seed color phenotype, while aa individuals would have white seeds.
An individual is heterozygous (Aa) when two different alleles are present at a locus and is homozygous—in this example, either homozygous dominant (AA) or homozygous recessive (aa)—when the same alleles are present on both chromosomes. Alleles at a locus can interact in several ways that are revealed by their phenotype, whether heterozygous or homozygous.
For a given locus, an individual with a genotype of either AA or aa is homozygous for that gene and is known as a homozygote; the status of the gene is referred to as homozygosity. An individual with the genotype Aa is heterozygous for that gene and is called a heterozygote; the status is known as heterozygosity. In the case of polyploid individuals, those with the genotypes AAAA (tetraploid) or aaa (triploid) would be examples of homozygotes and those with genotypes of AAaa (tetraploid) or AAaaaa (hexaploid) would be examples of heterozygotes.
The terms homozygous and heterozygous are used to describe the status of single genes or all gene loci within an individual, not within a population. There may be many different alleles of a gene present in a population of individuals, but for each diploid individual there are only two alleles per gene. For each individual, there is one allele from each parent and each allele per gene is present at corresponding loci on homologous chromosomes.
With regard to populations, a homogeneous population would be one in which all individuals in the population would have the same genotype and possess the same alleles for one or more genes. In contrast, a heterogeneous population would be characterized by differing alleles at one or more loci. Note that a cross between two homozygous parents produces progeny that are homogeneous because all of the individual offspring are genetically identical. However, the offspring would be heterozygous for all loci for which different alleles occurred in the two parents.
Gene Expression, Translation, and Transcription
DNA, Protein, and Other Gene Products
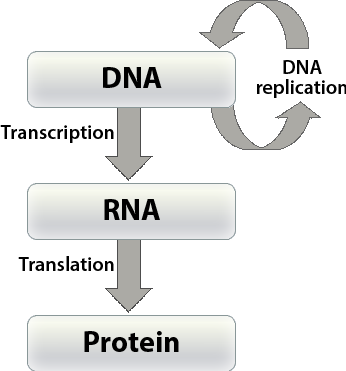
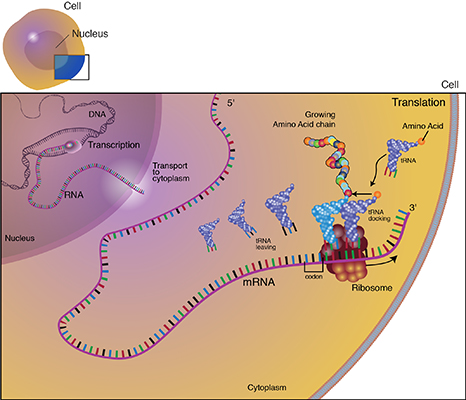
In order to have a better understanding of the concept of gene that will be the focus of this and the following lesson on linkage, it is critical to understand the chemical nature of DNA . Let’s review the pathways by which the genetic information in DNA is transferred from one DNA molecule to another (the process termed DNA replication) and from DNA to ribonucleic acid (RNA) molecules (called transcription), and then transferred from RNA to a protein (termed translation) by a code that specifies the amino acid sequence of the protein (see Fig. 6).
A gene is a stretch of DNA along a chromosome consisting of sequences of consecutive nucleotides. Recall that genetic information in DNA is coded in the sequence of four nucleotides that are abbreviated by the type of nitrogen-containing base that each contains—the purines A and G and the pyrimidines C and T. Through DNA replication, genetic information of an individual is transmitted from cell to cell during development and from generation to generation during reproduction.
DNA Structure
Examine the following for a better understanding of the chemical structure of the nucleotides that comprise the basic building blocks of DNA and the process of DNA replication:
Review the chemical structure of DNA and what occurs during the process of DNA replication. DNA replication occurs within the synthesis phase of the cell cycle.
Four types of chemical bases—A, G, C, T—in gene sequences carry the instructions for assembling a protein (Fig.8). The base pairs are bonded together by H-bonds to form the “rungs of a DNA ladder” (Fig. 8).
Nucleotides
Nucleotides are the basic building blocks of nucleic acids such as DNA and RNA, which are polymers made of long chains of nucleotides. DNA is double-stranded and RNA is single-stranded (Fig. 9). Note that in RNA, the chemical base uracil (U) replaces thymine (T).
Genes generally express their effect by coding for polypeptide chains, which are polymers consisting of ten or more aminoacids linked by peptide bonds. One or more polypeptides make up a protein. The DNA sequence of a gene is used as the basis for producing a specific protein sequence. Proteins are the complex molecules responsible for most biological functions in the cell.
Gene Expression, RNA, Translation, and Transcription
Amino acids are the building blocks of proteins. A protein is composed of one or more long chains of amino acids, the sequence of which corresponds to the DNA sequence of the gene that encodes it. The process of creating proteins from the genetic code in DNA is referred to as gene expression. The general process of gene expression in the cells of eukaryotes such as plants involves numerous steps, which are described below.
Plants are multicellular organisms known as eukaryotes, which are organisms possessing cells that contain DNA in a nucleus and other membrane-bound, specialized subunits known as organelles that are found within the cytoplasm, or cell fluid. Two plant cell organelles that contain DNA are chloroplasts (which are plastids or organelles that carry pigments—specifically green chlorophyll) and mitochondria (singular, mitochondrion; organelles that break down complex carbohydrates and sugars into usable forms, and thus supply energy for the plant).
The non-nuclear, organellar DNA located in plants follows cytoplasmic inheritance and is not subject to Mendelian inheritance. Cytoplasmic inheritance is also known as extrachromosomal or extranuclear inheritance, and is of significance in certain types of male sterility where the genes for those traits are present in the mitochondria, not in nuclear chromosomes.
In contrast to eukaryotes, prokaryotes such as bacteria are often unicellular and lack a cell nucleus and usually have their DNA in a single circular molecule.
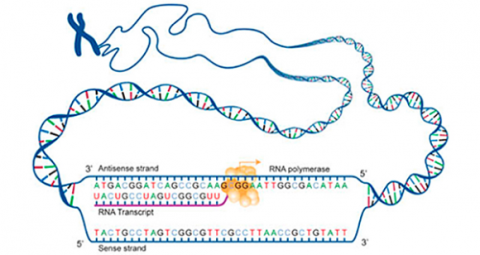
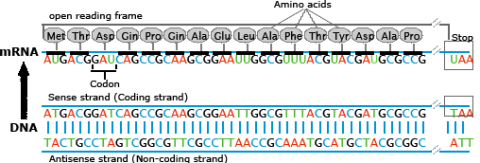
Transcription is a process in which the sequence of nucleotides in one DNA strand of a gene is copied into the nucleotides of an RNA molecule. The order of nucleic acids in RNA complements those on the DNA strand from which it is transcribed. In the RNA strand, however, uracil(U), rather than thymine (T), is the base that complements adenine (A). As the RNA transcript is formed, each base in the DNA is paired with a base in an RNA nucleotide, which is progressively added to the RNA strand as it grows. Transcription occurs in the nucleus of the cell (Fig. 13).
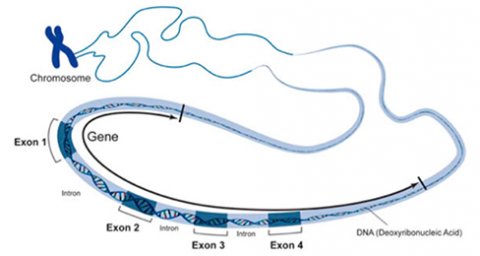
In a procedure known as RNA processing, intervening sequences or introns are removed from the RNA transcript by splicing. Introns are a special type of so-called non-coding DNA sequences that do not code for amino acids, but are located within genes until such sequences are removed during RNA processing. (Note that aside from intron sequences, most non-coding DNA found in chromosomes is located between (not within) gene loci along the chromosome.) The regions between the introns in the fully processed RNA are called exons, the sequences that code for proteins (Fig. 10). The ends of the transcript are also modified. The fully processed RNA is referred to as mRNA (messenger RNA). mRNA is a single-stranded sequence of nucleic acid and it moves from the cell nucleus to the cytoplasm where proteins are made (Fig. 10).
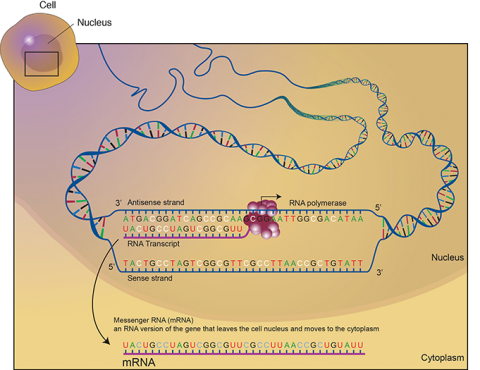
Translation is the process through which mRNA directs the assembly of amino acids in the proper sequence to synthesize the particular protein. Ribosomes in the cell cytoplasm read the base sequence of the mRNA (Fig. 10).
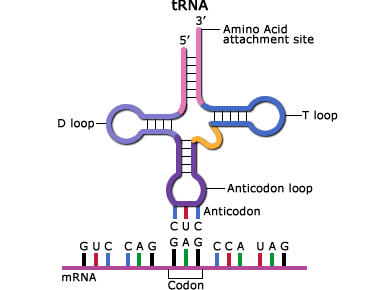
In the translated part of the mRNA, each adjacent group of three nucleotides constitutes a coding group or codon. Each codon specifies an amino acid subunit in the polypeptide chain. Adapter molecules, tRNA (transfer RNA) are complexed with the specific amino acid corresponding to the base sequence of the given mRNA. tRNA molecules bring the amino acids specified by the mRNA to the ribosomes where they are added to the growing protein chain. When the polypeptide chain is complete, it is released from the mRNA and forms a protein molecule. The order of amino acids determines the structure of the protein which affects its action.
Basic Steps of Transcription
These are the basic steps of transcription and translation:
- During transcription, a region of double-stranded DNA is momentarily pushed open, separating the two strands and allowing an enzyme known as RNA polymerase to build a strand of mRNA corresponding to that region of DNA.
- The tRNA anticodon attaches to the mRNA codon. The tRNA has a region called the “anticodon” that complements the codon sequence of the mRNA (Fig. 14).
- The specific amino acid complexed with the tRNA is held in place while the tRNA-amino acid complex corresponding to the next codon moves into place. A peptide bond is formed between the adjacent amino acids, building the protein molecule.
Inheritance and Gene Action
Mechanisms
Inheritance is based on the behavior of chromosomes and the genes that they carry. During meiosis and gametogenesis, homologous chromosomes separate. Each gamete receives one (haploid) set of chromosomes. The particular chromosome of a homologous pair that is distributed to a given gamete is random. When two gametes fuse during fertilization, the zygote receives from each parent one set of chromosomes, and the alleles that they each carry. The resulting combination of alleles in the zygote determines its genotype.
Because the distribution of homologous chromosomes to gametes is random, the fusion of gametes to form the zygote may produce different genetic combinations. Thus, within a population, variation for specific traits or characters may be observed. If the variation for a given trait is due to contrasting alleles at one or more loci, rather than to responses to the environment, the variation is heritable and can be transmitted from parent to progeny. Plant breeders select plants that exhibit desirable characteristics and those plants carry the desired allele of the gene that encodes the characteristic of interest.
Each gene or combination of genes and alleles, as influenced by the environment, determines the phenotype or observed expression of the particular trait. An individual’s allelic composition at corresponding loci on homologous chromosomes confers the expression of that gene. Alleles at corresponding loci interact. One allele may mask the presence of the other allele(s).
Alleles at a locus can interact in different ways, including no dominance (also referred to as additive gene action), partial dominance, complete dominance, and over-dominance.
Gene Action
There are several general types of gene action. The type of gene action and the alleles present for a given gene affect the phenotype. Let’s consider the gene action as indicated by the phenotype of a diploid individual heterozygous at the given single locus compared to the phenotype of its parents.
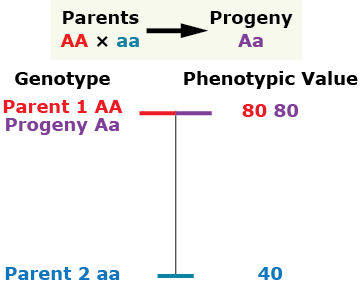
Addictive gene action (no dominance)
The progeny’s phenotypic value is at the midpoint between both parents.
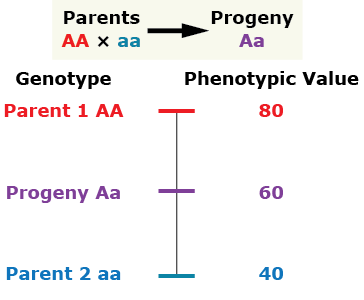
Complete dominance
The phenotype of the heterozygous progeny equals the phenotype of the homozygous dominant parent.
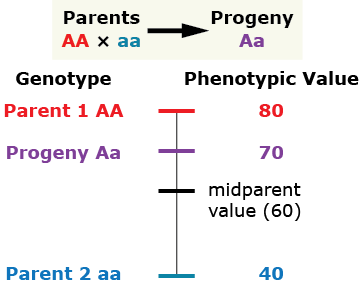
Partial (incomplete) dominance
The heterozygous progeny has a phenotypic value greater than that of the mid-parent value (MPV), but less than that of the homozygous dominant parent.
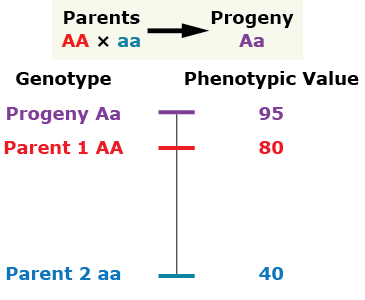
Over-dominance
The phenotype of the heterozygous progeny is greater than either parent.
Two diploid plants having different phenotypes for characters A, B, and C are mated. The progeny are grown out and their phenotypes are evaluated. Assume that both parents are homozygous at each locus. Compare the parental and progeny values for each character. Select the gene action at each locus.
| A Locus | Genotype | Phenotype value |
|---|---|---|
| Parent One | AA | 75 |
| Parent Two | aa | 40 |
| Progeny | Aa | 75 |
| B Locus | Genotype | Phenotype value |
|---|---|---|
| Parent One | BB | 60 |
| Parent Two | bb | 20 |
| Progeny | Bb | 55 |
Deviations from Expected Phenotypes
Multiple Alleles
With complete dominance of the type that we have been discussing, two different alleles exist for a trait, but only one of the alleles is observed in the phenotype. But it is important to understand that dominance does not affect the way in which genes are inherited. For some characters, there are reasons other than dominance among alleles at the same locus that explain deviations from expected phenotypes.
Multiple alleles—rather than just two—can occur at a single locus. Examples of multiple alleles at a single locus include the ABO blood group system in humans or the S alleles that control self-incompatibility in plants. Multiple alleles at a locus are sometimes referred to as an allelic series. However, while there may be more than two alleles per gene present in a population, be aware that the genotype of any given individual diploid plant in the population possesses only two alleles.
Penetrance is a measure of the percentage of individuals having a particular genotype that express the expected phenotype. Incomplete penetrance occurs when a genotype does not always produce the expected phenotype.
Expressivity is a related concept that describes the degree to which a character is expressed.
Incomplete Penetrance
Incomplete penetrance and variable expressivity are due to effects of other genes or environmental factors that change the effect of a particular gene. For example, a phenotype produced by an enzyme encoded by a particular gene may be expressed only within a narrow temperature range. In barley, a recessive allele occurs that produces albino plants when they are grown at lower temperatures. The allele inhibits chlorophyll production. But if barley plants that are homozygous recessive for this allele are grown above a critical temperature, the effect is not present so the plants have normal chlorophyll and are green.
Lethal alleles can change expected phenotypic ratios as well. Lethal alleles cause death when present, so that one or more genotypes will be missing from the offspring of a cross. Lethal alleles can be recessive (causing death only in homozygotes) or dominant (both homozygotes and heterozygotes with the allele will die). Dominant lethal alleles are rarely maintained in populations.
Essential genes are genes that when mutated can result in a lethal phenotype.
An example of a recessive lethal allele is one that controls chlorophyll production in the aurea strain of golden-leaved snapdragons. Aurea plants are heterozygous for the gene. A cross between two aurea plants produces progeny in the ratio of 2:1 golden to green. The expected phenotypic ratios in the progeny would be 1:2:1 white to golden to green. However, the white-leaved offspring die before germination or in the seedling stage due to a lack of ability to make chlorophyll.
What are the genotypes for each of these leaf phenotypes in the progeny of a cross between aurea snapdragons?
Mendelian Heredity
Gregor Mendel analyzed the segregation of hereditary traits. We now know that the genotype is the genetic constitution of an organism and the phenotype is the observable characteristic or set of characteristics of an organism produced by interactions between its genotype and the environment. The phenotype is influenced by not only the genotype but also environmental effects and developmental events and by actions of other genes and their products. Therefore, individuals with the same genotype can have different phenotypes and conversely, individuals with the same phenotype can have different genotypes.
Terminology
The parental generation of a cross is often called the P generation. Using symbolism based on what is called the F Symbol, the progeny of the mating of two parents is typically called the F1 or first filial generation. The subsequent generation produced by either self-pollination or crossing among the F1 offspring (a type of mating called inbreeding) is referred to as the F2 generation, or the second filial generation. The progeny resulting from self-pollination of each consecutive generation following the F2 is referred to as F3, F4, F5, and so on. Another kind of symbolism is based on the S Symbol. The S symbol is used to describe the offspring of a single cross—specifically the cross between two homozygous parents. F and S symbolism have been developed to describe progeny developed by hybridization and self-pollination.
It is important to note on pages 28-33 of Fehr’s textbook, plant breeders have developed a variety of systems using either the F or the S symbol to describe progeny developed by hybridization and self-pollination. What is challenging is that depending on the plant breeder, F and S symbols may be used in different, often contradictory, ways. The table below depicts examples of the particular system chosen and the way in which symbols are defined for use (Fehr, 1987, p. 28-33).
| Symbol | Description |
|---|---|
| F1 | Hybrids produced from the mating of homozygous parents. |
| F2 = S0 | First segregating generation produced from the cross of two or more parents |
| F3 = S1 | Offspring from self-pollination of F2 (or S0) plants |
| F5 = S3 | Offspring from self-pollination of F4 (or S2) plants |
| Syn 1 | Synthetic 1 = Offspring from random mating of an F2 population |
| Syn 4 | Synthetic 4 = Offspring from random mating of a Syn3 population |
| F2:5 line | F2-derived line in F5 = an F5 generation line available for planting that originated from an F2 generation |
| S2:9 line | S2 -derived line in S9 = an S9 generation line available fro planting that originated from an S2 generation |
Crosses
A cross involving a single trait (e.g., seed color) is referred to as a monohybrid cross, while one involving two traits (e.g., seed color and plant height) is termed a dihybrid cross. Conventionally, in equations used to symbolize a cross, the female parent is listed first and the male parent second, as in this example involving a single locus in diploid individuals:
AA x aa ⇒ Aa
Crosses that are done both ways are referred to as reciprocal crosses. For example, the reciprocal cross of the one above would be:
aa x AA ⇒ Aa
Predicting Segregation Ratios
If the genetic basis of a trait is known, principles developed by Mendel can be used to predict the outcome of crosses. There are three common approaches used to analyze segregation results, two of which use the listing of all possible genotypes and phenotypes of zygotes and gametes by systematic enumeration and the other of which uses mathematical rules.
- The Punnett Square Method is best for situations involving one or two genes. All possible gametes are written down in a square and then combined systematically to depict an array of genotypes of the offspring.
- The Branching or Forked-Line Method [See Appendix C for some examples] also works well for situations involving one or two genes. It uses a tally system in a diagram of branching lines.
- The Probability Method is based on two rules in mathematical probability theory—the Multiplicative Rule and the Additive Rule—and deals with the frequency of events.
Punnett Square Examples
Parental Monohybrid Cross
| Trait | Seed color |
|---|---|
| Alleles | Y yellow y green |
| Cross | yellow seeds x green seeds YY x yy (homozygous dominant x homozygous recessive) |
| Offspring called | F1 generation |
| Genotype | all alike Yy (heterozygous) |
| Phenotype | all alike Yy (green) |
Results:
| Pollen | |||
|---|---|---|---|
| Egg | 1/2y | 1/2y | |
| 1/2Y | 1/4Yy | 1/4Yy | |
| 1/2Y | 1/4Yy | 1/4Yy | |
F1 Monohybrid Cross
| Alleles | Y yellow y green |
|---|---|
| Cross | yellow seeds x green seeds Yy x Yy (heterozygous x heterozygous) |
| Offspring called | F2 generation |
| Genotypic ratio | 1:2:1 YY (homozygous dominant): Yy (heterozygous): yy (homozygous recessive) |
| Phenotypic ratio | 3:1 Y_ (yellow): yy (green) |
Results:
| Pollen | |||
|---|---|---|---|
| Egg | 1/2Y | 1/2y | |
| 1/2Y | 1/4 YY | 1/4 Yy | |
| 1/2y | 1/4 Yy | 1/4 yy | |
Dihybrid Cross
| Trait | Seed shape and seed color |
|---|---|
| Alleles | R round, r wrinkled, Y yellow, y green |
| Cross | Round, yellow seeds x round, yellow seeds RrYy x RrYy (heterozygous x heterozygous) |
| Offspring called | F3 generation |
| Genotypic ratio | 1:2:1:2:4:2:1:2:1 RRYY:RRYy:RRyy:RrYY:RrYy:Rryy:rrYY:rrYy:rryy |
| Phenotypic ratio | 9:3:3:1 R_Y_ (round, yellow): R_yy (round, green): rrY_ (wrinkled, yellow): rryy (wrinkled, green) |
Results:
| Pollen | |||||
|---|---|---|---|---|---|
| Egg | 1/4 RY | 1/4 Ry |
1/4 rY | 1/4 ry | |
| 1/4 RY | 1/16 RRYY | 1/16 RRYy | 1/16 RrYY | 1/16 RrYy | |
| 1/4 Ry |
1/16 RRYy | 1/16 RRyy | 1/16 RrYy | 1/16 Rryy | |
| 1/4 rY | 1/16 RrYY | 1/16 RrYy | 1/16 rrYy | 1/16 rrYy | |
| 1/4 ry | 1/16 RrYy | 1/16 Rryy | 1/16 rrYy | 1/16 rryy | |
Branching or Forked-Line Method
Below is an example of the forked-line or branch diagram method for determining the outcome of an intercross involving three independently assorting genes in peas.
| Traits | Plant height, seed color and seed texture |
|---|---|
| Alleles | D tall / d dwarf G yellow / g green W round / w wrinkled |
| Cross | Tall plants with yellow, round seeds x dwarf plants with green, wrinkled seeds DDGGWW x ddggww (homozygous dominant x homozygous recessive) |
| F1 | DdGgWw |
Expected F2 phenotypes for each trait
| Segregation of gene for plant height | Segregation of gene for seed color | Segregation of gene for seed texture | Combined phenotype of all three genes | |
| 3/4 D_(tall) | 3/4 G_(yellow) | 3/4 W_(round) | ⇒ | 27/64 D_G_W(tall, yellow, round) |
| 1/4 ww(winkled) | ⇒ | 9/64 D_G_ww(tall, yellow, wrinkled) | ||
| 1/4 gg(green) | 3/4 W_(round) | ⇒ | 9/64 D_ggW_(tall, green, round) | |
| 1/4 ww(wrinkled) | ⇒ | 3/64 D_ggww(tall, green, wrinkled) | ||
| 1/4 dd(dwarf) | 3/4 G_(yellow) | 3/4 W_(round) | ⇒ | 9/64 ddG_W_(dwarf, yellow, round) |
| 1/4 ww(wrinkled) | ⇒ | 3/64 ddG_ww(dwarf, yellow, wrinkled) | ||
| 1/4gg(green) | 3/4 W_(round) | ⇒ | 3/64 ddggW_(dwarf, green, round) | |
| 1/4 ww(wrinkled) | ⇒ | 1/64 ddggww(dwarf, green, wrinkled) | ||
Rules of Probability
Using probability theory can allow for accounting of the frequency of events, such as the chance of obtaining a head on a coin toss or obtaining a dominant homozygote (AA) from the mating between two heterozygotes (Aa). To figure out the probability of an event, all possible outcomes must be determined. For a coin toss, there are two possible events—heads or tails—each with a probability of ½ that it would occur. For the progeny produced by a heterozygote, the probability associated with each type of offspring is ¼ (AA), ½ (Aa) and ¼ (aa).
The Multiplicative Rule states that if events X and Y are independent, the probability that they occur together (that is A and B), is the probability of A times the probability of B. It is denoted as:
[latex]P(A)\times P(B)[/latex]
The Additive Rule states that if events X and Y are independent, the probability that at least one of them occurs (that is A or B), is the probability of A plus the probability of B minus the probability that both A and B occur together. It is denoted as:
[latex]P(A) + P(B) - [P(A) \times P(B)][/latex]
Mendel’s Principles
Mendel’s analysis of monohybrid crosses identified three key principles:
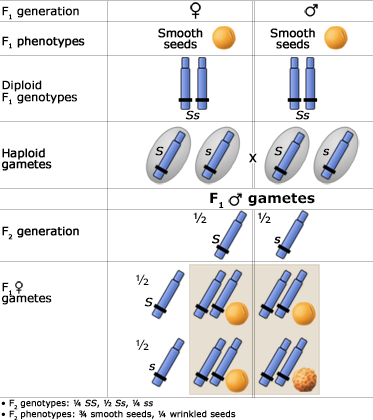
The Principle of Uniformity
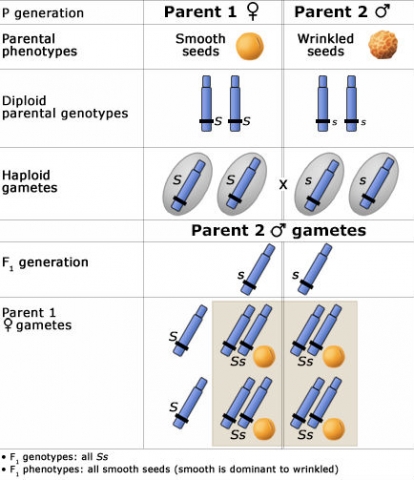
If both parents are homozygous, their F1 is genetically uniform.
To the right is a Punnett Square showing an example of this phenomenon, depicting the genotypic and phenotypic ratios and chromosomes of the diploid parents, haploid gametes, and the F1 generation.
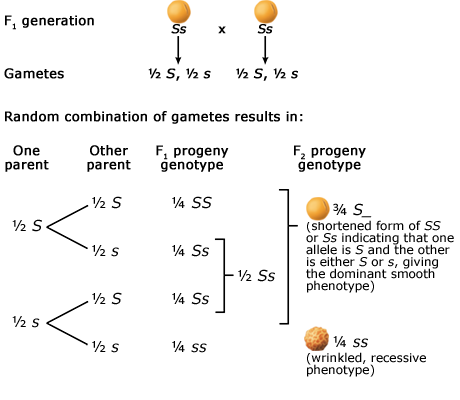
The Principle of Segregation
In a heterozygote, two different alleles of a gene locus segregate from each other in the formation of gametes. Below are two figures (one using a Punnett Square and the other the fork or branch diagram method) showing an example of Mendel’s law of segregation. The figures depict the genotypic and phenotypic ratios and chromosomes of the F1 heterozygote, haploid gametes, and the F2 generation.
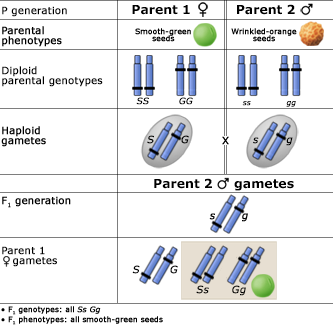
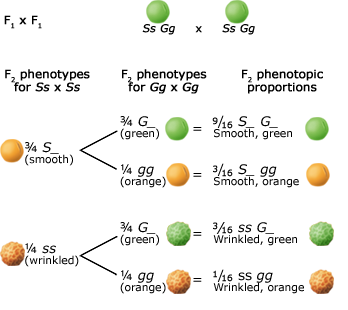
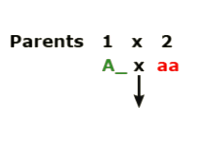
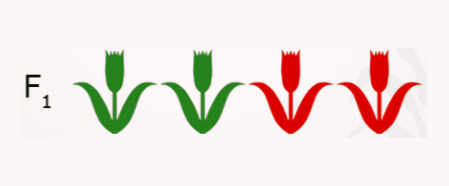
The Principle of Independent Assortment
Alleles at different gene loci are transmitted independently of one another during the production of gametes. Below are two figures (one using a Punnett Square and the other the fork or branch diagram method) showing an example of Mendel’s law of independent assortment. The figures depict the genotypic and phenotypic ratios and chromosomes of the parents, the F1 heterozygote, haploid gametes, and the F2 generation.
Inheritance
A trait or characteristic may be under the control of one or more genes. The range of variation for a particular characteristic indicates the mode of inheritance of that characteristic.
- Qualitative inheritance — simple inheritance of a characteristic under the control of single gene or a few major genes. The expression of simply inherited characteristics is discrete. That is, the phenotypic variation of the characteristic can be separated into distinct classes. Generally, the environment has little influence on the characteristic’s expression.
- Quantitative inheritance — inheritance of characteristics influenced by numerous genes (multiple genes or polygenes). The involved genes have small, cumulative effects on the phenotype of the characteristic. The expression of such characteristics can be measured in quantitative units that are continuous, rather than discrete, and is often considerably influenced by the environment. Quantitative inheritance is the subject of the module on Inheritance of Quantitative Traits.
The inheritance of some characteristics cannot easily be categorized as either qualitative or quantitative. These characteristics are usually under the control of one or few major genes as modified by multiple genes with small effects. Together with environmental effects, the phenotype of such characteristics may show continuous variation.
Drag the correct inheritance to the appropriate trait graph
Progeny Ratios
To determine the mode of inheritance of a particular character, plant breeders mate plants and evaluate the performance of their offspring. The proportion of progeny exhibiting different phenotypes provides information about the proportion of progeny possessing different genotypes.
- Phenotypic ratio — the proportion of progeny exhibiting different phenotypes
- Genotypic ratio — the proportion of progeny possessing different genotypes
These ratios are commonly determined by crossing two plants having contrasting phenotypes for a given character. The parents may or may not be homozygous. The progeny are heterozygous for the trait. Self-pollinating the F1 progeny produces the F2 generation, and so forth (Fn). In each generation, the ratio of plants displaying contrasting phenotypes for the particular trait reveals information about the genotypes of the parents, as well as gene action (e.g., dominant or recessive alleles).
In the exercise concerning phenotypic and genotypic ratios, with each consecutive generation, the proportion of heterozygotes (Gg) is reduced. With continued self-pollination, the heterozygotes will segregate, decreasing the proportion of heterozygotes in the population by half each generation. Notice that the homozygotes can only produce homozygotes.
A cross is made between a plant homozygous for green seeds (GG) and a plant homozygous for white seed (gg) — a monohybrid cross. Assume: the species is diploid and normally self-pollinating, and the G allele is completely dominant. By convention, “X” means cross-pollinating, and the “ ” symbol indicates self-pollinating.
At each generation, you will determine and fill in the missing phenotypic and genotypic ratios. You will drag a fraction from the options provided below to its respective empty box.
Successive Generations
| Generation | Heterozygosity (%) |
|---|---|
| F1 | 100.0 |
| F2 | 50. |
| F3 | 25.0 |
| F4 | 12.5 |
| F5 | 6.25 |
| F6 | 3.12 |
For each successive generation of offspring resulting from one F1 individual, by the F8 generation, the population is essentially homozygous. When no further segregation for the trait occurs, all progeny derived from that F1 will “breed true” because they are homozygous for the trait.
The proportion of plants that are expected to be heterozygous at any gene when starting with a heterozygous F1 and selfing can be determined by using the formula (½)n, where n = the number of segregating generations, e.g., in F2, n = 1 and in F5, n = 4. Using this we get the following proportions of heterozygous plants in F4: (½)n = (½)3 = ⅛ = 12.5%.
The proportion of homozygous plants in any generation is then given by 1 − (½)n which, when algebraically converted, is equal to:
[latex]\frac{2^n - 1}{2^n}[/latex].
Applying this to F4 we get [latex]\frac{2^3-1}{2^3} = \frac{8 - 1}{8} = {7 \over 8} = 87.5\%[/latex]
When working with actual genotypes we must remember that in any segregating generation there are two homozygous genotypes and we expect equal quantities of each. Using the example of an F1 that is Aa, in F2, we expect ¼ AA + ½ Aa + ¼ aa.
In F4 we expect to be homozygous with half of those AA and half aa. Thus overall we expect the following F4 genotypic frequencies:
[latex]{7 \over 16} \textrm{AA} + {1 \over 8} \textrm{aa} + {7 \over 16} \textrm{aa}[/latex]
Scenarios under cross-pollination — with and without selection — will be discussed in more detail in the module on Population Genetics.
Progeny Test
There are two principal procedures that allow the plant breeder to determine the basis of phenotypes (genetic or environmental), gene action, and the genotypes of individual plants. Which procedure is used depends on the specific objectives of the breeder.
Progeny Test
The progeny test evaluates the genotype of an individual based on the performance of its offspring. The progeny test can be used to:
- Distinguish heritable phenotypes from phenotypes attributable to environmental effects.
- Determine the genotype or the allelic composition of an individual.
Steps in Progeny Test
- Hybridize (mate) two plants, A and B.
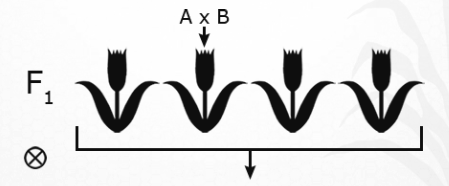
Fig.23 Hyridization - Grow out and self-pollinate the F1 plants.
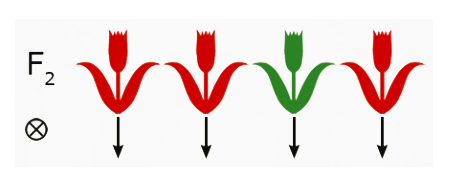
Fig.24 Self-pollination. - Grow out and self-pollinate F2 plants.
- Determine the phenotypic ratio of trait(s) of interest.
- Harvest seed separately from each plant.
- Plant a portion of the F3 seed from each phenotype separately.
- Determine the phenotypic ratio in each group—the phenotypic ratio reveals which of the F2 plants were homozygous and which were heterozygous for the trait(s) of interest.
- Based on the phenotype information, calculate the genotypic ratio.
In this example, the phenotypic ratios of the F3 plants reveal the following genotypic information about each of the F2 parents:
| F2 Parent | Genotype |
|---|---|
| a | Homozygous red |
| b | Heterozygous red |
| c | Homozygous green |
| d | Heterozygous red |
Both the red and green phenotypes occur in ratios consistent with those of heritable traits. Thus, there is a genetic basis for these phenotypes (i.e., these phenotypes are not just the result of environmental conditions).
Testcross
The testcross procedure is used to determine the genotype of an individual or linkage groups. Linkage is a condition in which genes located on the same chromosome are inherited together due to their close proximity. Linkage will be discussed in greater detail in “Linkage” module.
Steps in Testcross
- Hybridize (mate) two plants. The genotype of Parent 1 is unknown, A (?). Parent 2 is homozygous recessive for the trait of interest, aa.
- Grow out F1 plants and evaluate the phenotypic ratio:
- If segregating 1:1, then you know that the genotype of Parent 1 was heterozygous, Aa.
- If all plants have the phenotype of Parent 1, than you know that Parent 1 was homozygous dominant, AA.
- If segregating 1:1, then you know that the genotype of Parent 1 was heterozygous, Aa.
The backcross is a special type of progeny test. It is a cross of an F1 to either of the original parents. This procedure is used extensively in basic genetic studies but not often used by plant breeders to determine genotypes of plants.
For each of the following situations, identify which procedure(s) would be most appropriate.
Determine Linkage
To determine linkage groups, hybridize two plants:
- Parent 1 is heterozygous at two (or more) loci.
- Parent 2 is homozygous recessive at these loci.
The interpretation of the results of this cross will be discussed in the module on Linkage.
Genetic Recombination and Its Effects
Develop Improved Cultivars
To develop improved cultivars, plant breeders usually combine the favorable characteristics of one plant or cultivar with the desirable traits of another plant or cultivar, accumulating desirable alleles for key characters. To obtain an improved genetic combination, breeders make a series of matings, selecting the best offspring to produce the next generation. Plant breeders rely on several genetic mechanisms to obtain new genetic combinations.
- Segregation — Homologous chromosomes derived from different parents separate and distribute randomly to cells during meiosis.
- Recombination — Formation of new gene combinations by mating individuals having differing genotypes.
Segregation
Segregation is the result of the independent assortment or chance distribution of homologous chromosomes and the genes that they carry to gametes. Through meiosis, allelic pairs are separated and distributed to different cells, which subsequently undergo gametogenesis.
Genes located on different chromosome pairs assort independently. That is, the chance distribution of a particular chromosome, say one of these green chromosomes, to one cell, has no effect on the distribution of a yellow chromosome. Independent assortment facilitates recombination and leads to segregation in subsequent generations.
Recombination
Mating two plants possessing different genotypes results in progeny with genotypes that may differ from the parental types. The progeny having genotypes that differ from the parents are referred to as “recombinants.”
Try this! Recombination Exercise
Mate two plants, one heterozygous and the other homozygous at the G and H loci. Determine all possible gamete types and then all possible genotypes that would result from this mating progeny. Let Parent 1 be the female and Parent 2 be the male parent in this cross. Check each step and make corrections if needed before proceeding to the next step.
| Parent 1 | Parent 2 | ||
| Genotype | GgHh | X | gghh |
Step 1: Among the following types, select the possible gamete types for the eggs, and drag the 4 appropriate types into the boxes below.
Step 2: Among the following types, select the possible gamete types for the sperm, and drag the 4 appropriate type into the box below.
Step 3: Fertilization: When gametes fuse, the zygote receives half of its genes from each parent. Given below are all possible combinations of the genotypes. Select the correct combinations and drag them to their respective places on the table.
| Combination of genes in sperm | ||||
|---|---|---|---|---|
| Combination of genes in eggs | gh | gh | gh | gh |
| GH | GgHh | GgHh | GgHh | GgHh |
| Gh | Gghh | Gghh | Gghh | Gghh |
| gH | ggHh | ggHh | ggHh | ggHh |
| gh | gghh | gghh | gghh | gghh |
Step 4: What is the genotypic ratio of these progeny?
| Combination of genes in sperm | ||||
|---|---|---|---|---|
| Combination of genes in eggs | gh | gh | gh | gh |
| GH | GgHh | GgHh | GgHh | GgHh |
| Gh | Gghh | Gghh | Gghh | Gghh |
| gH | ggHh | ggHh | ggHh | ggHh |
| gh | gghh | gghh | gghh | gghh |
Step 5: What is the phenotypic ratio of these progeny?
| Ratio | Genotype |
|---|---|
| 4/16 | GgHh |
| 4/16 | Gghh |
| 4/16 | ggHh |
| 4/16 | gghh |
Step 6: Identify the parental types and recombinants by clicking on the correct button under each example.
Study Questions 4
A homozygous plant that was
- high yielding (Y_ = high, yy = low),
- low in protein (P_ = high, pp = low),
- early maturing (E_ = late, ee = early), and
- with white flowers (W_ = purple, ww = white)
was crossed with a homozygous plant that was low yielding, high in protein, early maturing, and with purple flowers.
| Option | Genotype | Phenotype | |||
|---|---|---|---|---|---|
| Yield | Protein | Maturity | Flowers | ||
| A | YyPpEeWw | High | High | Late | Purple |
| B | YyPPeeWw | High | High | Early | Purple |
| C | YyPpeeWw | High | High | Early | Purple |
| D | yyPpeeWW | Low | High | Early | Purple |
| E | YyppEeWw | High | Low | Late | Purple |
| F | YYPpeeww | High | High | Early | White |
Helpful Hint
- 3/4 will be high yielding (Y_)
- 3/4 will be high protein (P_)
- all will be early maturing (ee)
- 1/4 will have white flowers (ww)
Let’s verify this by looking at the combinations of genes possible in the gametes. There are eight combinations.
YPeW YPew YpeW Ypew yPeW yPew ypeW ypew
To ascertain all the genotypes in the F2, we can create a Punnett Square with these eight combinations for the eggs and for the sperm, producing an 8 x 8 table showing 64 combinations in the F2 zygotes. Only those F2 with a Y_P_eeww genotype (indicated with an X in the table below) will have the phenotype: high yielding, high protein, early maturity, and with white flowers.
| Pollen | ||||||||
| Eggs | YPeW | YPew | YpeW | Ypew | yPeW | yPew | ypeW | ypew |
| yPeW | ||||||||
| YPew | X | X | X | X | ||||
| YpeW | ||||||||
| Ypew | X | X | ||||||
| yPeW | ||||||||
| yPew | X | X | ||||||
| ypeW | ||||||||
| ypew | X | |||||||
Restrictions with Independent Assortment
Hybrid Characteristics
A breeder cannot improve a characteristic unless there is some variability for that characteristic within which to make selections. Hybridizing plants differing in their phenotypes (and genotypes) and selecting from among the recombinants provide the breeder with the opportunity to make progress towards crop improvement. However, recombination and segregation may fail to provide the expected variation for two general reasons.
- Population size — A minimum of progeny from a cross must be grown out and evaluated. If the number is too small, the likelihood of the desired recombinant occurring in the population is reduced. As the number of independently assorting genes increases, the number of plants that must be evaluated increases exponentially. Thus, an adequate population is essential to make efficient progress towards the breeding goals. The minimum population size required for all genotypes to be represented in the population can be calculated as follows:
- Determine the number of segregating gene pairs. Let that number equal “n”.
- Calculate the minimum population size: minimum population size = 4n
- Gene Interaction — Although the genes involved in epistatic and pleiotropic interactions may assort independently, their interactions often affect phenotypic and genotypic ratios.
- Linkage — As stated earlier, loci in close proximity on the same chromosome tend to be transmitted together and do not assort independently.
Genetic Cross-Data
When analyzing data from genetic crosses, it is frequently appropriate to use some kind of statistical analysis because such data is often quantitative. One statistical procedure commonly used for testing results of segregation data is called a chi-square (χ2) test. The chi-square test is also known as a “goodness-of-fit” test.
Breeders wonder if data support or fit a particular hypothesis and therefore help to explain the results. For example, does the range of phenotypes observed within the progeny of a cross-fit a particular segregation ratio, e.g., 3:1 or 9:3:3:1? The chi-square procedure helps breeders understand the significance of deviation of observed results from results predicted by the hypothesis being tested. A null hypothesis is formed that states there is no real difference between the observed and expected data. If differences are due to chance, then the hypothesis can be accepted, otherwise, the null hypothesis is rejected and the breeder can modify the hypothesis in favor of a better one. The equation used to calculate the (χ2) statistics is as follows
[latex]\chi^2 = \sum \dfrac{(\textrm{observed} - \textrm{expected})^2}{\textrm {expected}}[/latex]
The chi-square procedure will be covered in more detail in the Quantitative Methods course.
Gene Interactions
Traits
When multiple genes control a particular trait or set of traits, gene interactions can occur. Generally, such interactions are detected when genetic ratios deviate from common phenotypic or genotypic proportions.
- Pleiotropy — Genes that affect the expression of more than one character
- Epistasisepistasis — Genes at different loci interact, affecting the same phenotypic trait. Epistasis occurs whenever two or more loci interact to create new phenotypes. Epistasis also occurs whenever an allele at one locus either masks the effects of alleles at one or more loci or if an allele at one locus modifies the effects of alleles at one or more loci. There are numerous types of epistatic interactions.
Epistasis is expressed at the phenotypic level. It is important to note that genes that are involved in an epistatic interaction may still exhibit independent assortment at the genotypic level. The following slides show some examples of epistasis drawn from various types of plants.
Duplicate Recessive Epistasis
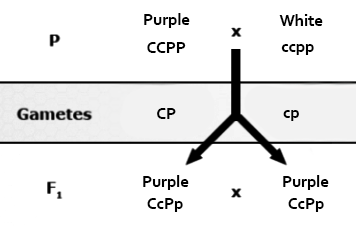
Duplicate recessive epistasis (also known as complementary action): 9:7 ratio observed in flower color of progeny of crosses between a pure line pea plant with purple flowers (genotype CCPP) with a pure line, homozygous recessive plant with white flowers (ccpp). The F1 plants are all purple and have a genotype of CcPp, but the F2 progeny will have a modified ratio of 9:7 because color is only produced if both genes have at least one dominant allele. These genes control flower color by controlling the expression of biochemical compounds known as anthocyanins that impart pigment to the flower. Pigmentation in this case is controlled by a two-step chemical reaction. One of these genes controls the first step and the other controls the second step.
| Male Gametes | |||||
|---|---|---|---|---|---|
| CP | Cp | cP | cp | ||
| Female Gametes | CP | CCPP Purple |
CCPp Purple |
CcPP Purple |
CcPp Purple |
| Cp | CCPp Purple |
CCpp White |
CcPp Purple |
Ccpp White |
|
| cP | CcPP Purple |
CcPp Purple |
ccPP White |
ccPp White |
|
| cp | CcPp Purple |
Ccpp White |
ccPp White |
ccpp White |
|
Dominant Epistasis
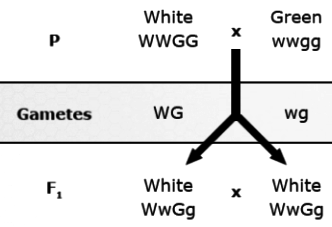
Dominant epistasis (also known as masking action): 12:3:1 ratio observed in fruit color of progeny of crosses of squash. In the F2, fruits are white if the genotypes are either W_G_or W_gg because the dominant allele for the first gene (W) masks the effect of either allele for the other gene (G or g). Color is present only if the first gene is homozygous recessive (ww). Yellow squash have the genotype wwG_ and green ones have the genotype wwgg.
| Male Gametes | |||||
|---|---|---|---|---|---|
| Female Gametes | WG | Wg | wG | wg | |
| WG | WWGG White |
WWGg White |
WwGG White |
WwGg White |
|
| Wg | WWGg White |
WWgg White |
WwGg White |
WwGg Yellow |
|
| wG | WwGG White |
WwGg White |
wwGG Yellow |
wwGg Yellow |
|
| wg | WwGg White |
Wwgg White |
wwGg Yellow |
wwgg Green |
|
Duplicate Dominant Epistasis
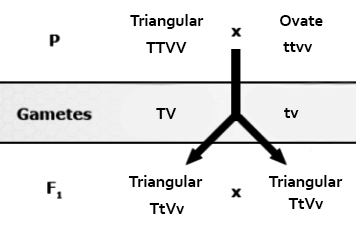
Duplicate dominant epistasis (also known as duplicate action): 15:1 ratio observed in fruit shape of progeny of crosses of the common shepherds purse. If either of the two genes involved in fruit shape (T or V) are present alone or both together (TV), then the plants will all produce triangular-shaped fruit. Only the homozygous recessive genotype (ttvv) produces a seed capsule with an ovate shape.
| Male Gametes | |||||
|---|---|---|---|---|---|
| Female Gametes | TV | Tv | tV | tv | |
| TV | TTVV Triangular |
TTVv Triangular |
TtVV Triangular |
TtVv Triangular |
|
| Tv | TTVv Triangular |
TTvv Triangular |
TtVv Triangular |
Ttvv Triangular |
|
| tV | TtVV Triangular |
TtVv Triangular |
ttVV Triangular |
ttVv Triangular |
|
| tv | TtVv Triangular |
Ttvv Triangular |
ttVv Triangular |
ttvv Ovate |
|
Identify the type of epistasis that best explains the observed effect.
References
Hartwell, L., L. Hood, M. Goldberg, A. Reynolds, and L. Silver. 2011. Genetics: From Genes to Genomes. 4th edition. McGraw-Hill Publ., Boston, MA.
National Institutes of Health. National Human Genome Research Institute. “Talking Glossary of Genetic Terms.” http://www.genome.gov/glossary/
Pierce, B. 2010. Genetics: A Conceptual Approach. 4th edition. W. H. Freeman, NY.
Pierce, B. A. 2008. Genetics: A Conceptual Approach. 3rd edition. W. H. Freeman, NY.
Russell, P. J. 2010. iGenetics: A Molecular Approach. 3rd edition. Benjamin Cummings, San Francisco, CA
A method used to determine the response relationship of data. This method determines whether data is linear (form y=ax+b), parabolic (y=ax2+bx+c), or higher order.
(1) A genotype that contains one dominant and one recessive gene or two different co-dominant genes (Aa,bB,CD).
(2) An individual that has two copies of the same allele at a locus, e.g., AA or aaa or AAAA.
Presence of different alleles, or contrasting gene forms, at corresponding loci on homologous chromosomes.
The haploid, sexual generation or phase in the plant's life cycle that produces haploid gametes via mitosis.
Augmented designs, originally conceived by W.T. Federer, feature replicated check varieties arranged in a standard experimental design and unreplicated plots of new varieties to be tested.
Often abbreviated to ANOVA, a general term for a set of statistical procedures to differentiate treatment effects by separating combined variability in an experiment
Condition of an individual possessing incomplete sets of chromosomes.
Often abbreviated to ANOVA, a general term for a set of statistical procedures to differentiate treatment effects by separating combined variability in an experiment
A polyploid having genetically different sets of chromosomes.
A polyploid having genetically different sets of chromosomes.
A plant possessing the sum of the somatic chromosome number of two species.
Abundance of a specific allele at a locus in a population
Maturity group ranges from 000 (extreme north latitude) to 9 (near the equator) in soybean, with ranking based on photoperiod sensitivity and thus its flowering date (date that 50% of plants have begun to flower).
Interruption of the transcription or translation of DNA such that a gene is not expressed phenotypically.
Nurseries that facilitate planting and cultivation of materials at times other than the growing season in the target market region. For example, programs in temperate regions may seek facilities in the alternative hemisphere where seasons are flipped.
The donor plants in the case of DH are the F1 or F2 progeny resulting from a breeding cross from which homozygous lines are desired.
Enzymes are organic catalysts. They cause chemical reactions to occur rapidly which would otherwise occur very slowly or not at all. Most of them are very specific— for example, urease catalyzes the hydrolysis of urea. Many enzymes require a metallic cofactor to work with them. Also, enzymes are large complex of globular proteins consisting of one or more polypeptide chains.
Evaluation of the homogeneity of variance by calculating a Chi-squares value with the formula given in the "Mean Comparisons" module.
A population is considered to be homogeneous when all members have similar traits.
The donor parent; the line serving as a source of favorable gene(s). See also recurrent parent.
Qualitative variables that can be used to group data. However, their order has no inherent meaning.
First-generation (F1) progenies from a cross, produced through controlling the pollination, between (I) two inbred lines; (ii) two single crosses; (iii) a single cross and an inbred line; (iv) an inbred line or a single cross and an open-pollinated or a synthetic variety; or (v) two selected clones, seed lines, varieties, or species.
A line resulting from pre-breeding.
The change in allele frequency that occurs by chance (particularly in small populations) as a result of random sampling of the gametes that form the next generation.
