
Physical Development in Middle Adulthood
Diana Lang; Nick Cone; Martha Lally; Suzanne Valentine-French; and Ronnie Mather
- Explain the difference between primary and secondary aging
- Describe sensory changes that occur during middle adulthoodIdentify health concerns in middle adulthood
- Explain what occurs during the climacteric for females and males
- Describe sexuality during middle adulthood
- Explain the importance of sleep and the consequences of sleep deprivation
- Describe the importance of exercise and nutrition for optimal health
- Describe brain functioning in middle adulthood
- Detail the most important physiological changes occurring in men and women during middle adulthood
- Describe how physiological changes during middle adulthood can impact life experience, health, and sexuality
- Describe cognitive and neurological changes during middle adulthood
- Outline cognitive gains/deficits typically associated with middle adulthood
- Explain changes in fluid and crystallized intelligence during adulthood
- Analyze emotional and social development in middle adulthood
- Explain the sources of stress confronting adults in midlife and the strategies to cope
- Summarize Erikson’s seventh psychosocial task of generativity vs stagnation
- Evaluate Levinson’s notion of the midlife crisis
- Examine key theories on aging, including socio-emotional selectivity theory (SSC) and selection, optimization, and compensation (SOC)
- Explain how relationships are maintained and changed during middle adulthood
- Describe the link between intimacy and subjective well-being
- Discuss issues related to family life in middle adulthood
Middle adulthood, or midlife, refers to the period of the lifespan between early adulthood and late adulthood. Although ages and tasks are culturally defined, the most common age definition is from 40-45 to 60-65. This may be the least studied time of the lifespan, and research on this developmental period is relatively new as many aspects of midlife are still being explored. In the United States, the large Baby Boom cohort (those born between 1946 and 1964) are now midlife adults (and some even late adults) and this has led to increased interest in this developmental stage. We do know that this stage reflects both developmental gains and losses and that there are considerable individual differences, but there is still much to learn about this age group.[1]
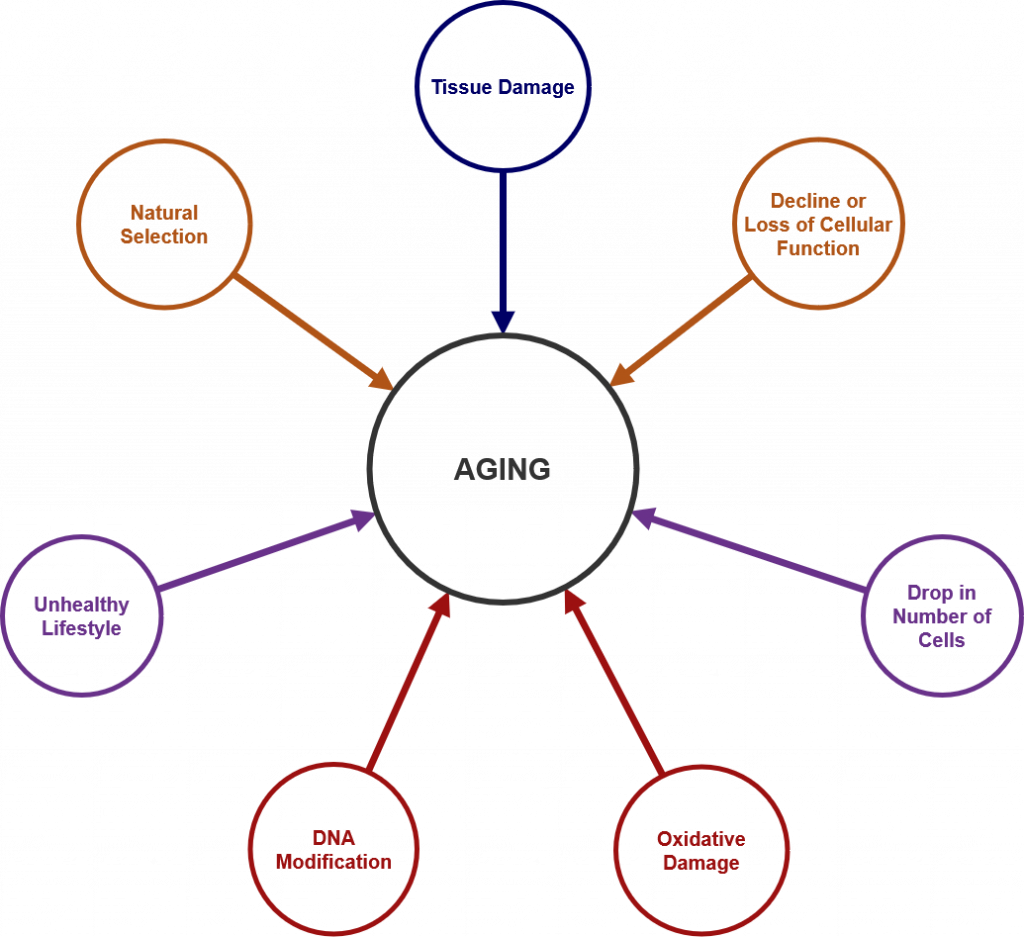
Each person experiences age-related physical changes based on many factors: biological factors, such as molecular and cellular changes, and oxidative damage are called primary aging, while aging that occurs due to controllable factors, such as an unhealthy lifestyle including lack of physical exercise and poor diet, is called secondary aging.[2] These factors are shown in Figure 1.
Getting out of shape is not an inevitable part of aging; it is probably due to the fact that middle adults become less physically active and have experienced greater stress. Smoking tobacco, drinking alcohol, poor diet, stress, physical inactivity, and chronic disease such as diabetes or arthritis reduce overall health. However, there are things can be done to combat many of these changes by adopting healthier lifestyles.

Hippocrates (author of the famous “Hippocratic oath”) was of the opinion that “walking is the best medicine.” This was his learned opinion in 400 BCE and there is now considerable, and increasing, evidence that he may have been correct.
As we will see, there are simple physiological changes that accompany middle adulthood. These are somewhat inevitable, but the importance of physical activity at this age range would be difficult to overstate looking at the evidence. Exercise does not necessarily mean running marathons, it may simply mean a commitment to using your legs in a brisk fashion for thirty minutes. “Use it or lose it” is a good mantra for this stage of development—the technical term for the the loss of muscle tissue and function as we age is sarcopenia. From age 30, the body loses 3-8% of its muscle mass per decade, and this accelerates after the age of 60.[3] Diet and exercise can ameliorate both the extent and lifestyle consequences of these kinds of processes. In this section, we will examine some of the changes associated with middle adulthood and consider how they impact human life.[4]
Physical Mobility in Middle Adulthood

The importance of not succumbing to the temptations of a sedentary lifestyle was as obvious to Hippocrates in 400 BCE as it is now. Piasecki et al[5] are of the opinion that sarcopenia (loss of muscle tissue and function as we age) in legs might be the result of leg muscles becoming detached from the nervous system. Further, Piasescki et al [6] believe that exercise encourages new nerve growth slowing the progression of sarcopenia (Figure 2). Persons aged 75 may have up to 30-60% fewer nerve endings in their leg muscles than they did in their early 20s.
Sarcopenia has only recently been recognized as an independent disease entity since 2016 (ICD-10). In 2018 the U.S. Center for Disease Control and prevention assigned sarcopenia its own discrete medical code. Disease entities that affect mobility will become an increasingly costly phenomenon, and will affect the quality of life of millions of people as the population ages. In many ways it is a natural phenomenon, and many doctors and researchers have been reticent to overly pathologize natural changes associated with age. However, mobility is now becoming a central concern, and some researchers are now identifying some conditions like osteosarcopenia, which describes the decline of both muscle tissue (sarcopenia) and bone tissue (osteoporosis). Diagnoses and pharmaceuticals which deal with the central question of mobility will become ever more important, even more so as the burgeoning costs associated with caring for those with mobility issues becomes apparent.
The years between 30 and 60 can see the onset of rheumatoid arthritis (RA). This is the third most common form of arthritis and its specific etiology is unknown at this time. RA occurs when antibodies attack normal synovial fluid in the joints mistaking them for an alien threat. It affects women more than men by a factor of around 3 to 1. Peak onset for women is reckoned to be sometime in the early 40s. This has led to the conclusion, albeit a preliminary one, that RA is caused by hormonal changes. Women who are pregnant, and have RA, often experience a temporary remission, again leading to the identification of hormonal changes in the body as the most likely culprit. Women also experience symptoms at an earlier age. This condition is often associated with people in their 60s, but only about a third first experience symptoms at this age, though they become more acute with the passage of time.
Human beings reach peak bone mass around 35-40. Osteoporosis is a “silent disease” which progresses until a fracture occurs. The sheer scale and cost of this illness is radically underestimated. It is often associated with women due to the fact that bone mass can deteriorate in women much more quickly in middle age due to menopause. After menopause women can lose 5-10% bone mass per year, rendering it advisable to monitor intakes of calcium and Vitamin D, and evaluate individual risk factors. Beginning in their 60s, though, men and women lose bone mass at roughly the same rate. The number of American men diagnosed with osteoporosis is currently around the 2 million mark, with a further 12 million reckoned to be at risk. The National Osteoporosis Foundation (NOF) estimates that 50% of women and 25% of men over the age of 50 will suffer a bone fracture due to osteoporosis. Attention at this stage of the life may bring pronounced health benefits now and later for both women and men. Fixing the damage takes a considerable amount of the Medicare budget.
The health benefits that walking and other physical activity have on the nervous system are becoming increasingly obvious to those who study aging. Adami et al[7] found pronounced links between weight bearing exercise and neuron production. We tend to think of the brain as a central processing unit giving instructions to the body via the conduit of the central nervous system, but contemporary science is now coalescing around the idea that muscles and nerves also communicate with the brain—it is a two-way informational and sustaining process. Many studies suggest that voluntary physical activity (VPA) extends and improves quality of life. Such studies show that even moderate physical activity can bring large gains.
In addition, there is often an increase in chronic inflammation at this time of life with no discernible discrete cause (as opposed to acute inflammation associated with something like an infection). Inflammation is the body’s natural way of responding to injury or harmful pathogens in the body. The function of inflammation is to eliminate the initial cause of injury and initiate tissue repair, but when this happens consistently and for longer periods of time, the body’s stress response systems become overworked. This can have serious effects on health, such as fatigue, fever, chest or abdominal pain, rashes, or greater susceptibility to diseases such as cancer, rheumatoid arthritis, and heart disease. Untreated acute inflammation, autoimmune disorders, or long-term exposure to irritants are some contributing factors,[8] as is social isolation.[9]
Chronic inflammation has been implicated as part of the cause of the muscle loss that occurs with aging.[10] Chronic inflammatory disorder is now implicated in a whole series of chronic diseases such as dementia, and the biomedical evidence for its centrality is now emerging in the medical research literature.
Because of the aging population, health issues associated with autoimmune disease, chronic inflammation, and bone mass density will become central concerns in health and social policy in the coming decades.
Try It
Normal Physiological Changes in Middle Adulthood
There are a few primary biological physical changes in midlife. There are changes in vision, hearing, more joint pain, and weight gain.[11] Vision is affected by age. As we age, the lens of the eye gets larger but the eye loses some of the flexibility required to adjust to visual stimuli. This is known as presbyopia. Middle aged adults often have trouble seeing up close as a result. Night vision is also affected as the pupil loses some of its ability to open and close to accommodate drastic changes in light.
Presbycusis is the most common cause of hearing loss, afflicting one out of four persons between ages 65 and 74, and one out of two by age 75. This loss accumulates after years of being exposed to intense noise levels, and is generally due to the loss or damage of nerve hair cells inside the cochlea. It is more common in men, but men are also more likely to work in noisy occupations, which may explain their nearly doubled rates of hearing loss levels.[12] Hearing loss is also exacerbated by cigarette smoking, high blood pressure, and stroke. High frequency sounds are the first affected by such hearing loss. Hearing loss could be prevented by guarding against being exposed to extremely noisy environments.
There is new concern over hearing loss as early as childhood with the widespread use of headphones, as loud and/or prolonged listening can cause damage to the cilia, or the tiny sensory hairs, within the cochlea. Another cause of hearing loss in middle age is otosclerosis, a physiological condition affecting the middle ear and its bone structure. This occurs when one of the bones in the middle ear, the stapes, acquires a rigidity via abnormal bone growth which it should not have. Unable to vibrate, it induces hearing impairment. Otosclerosis is often described as a rare condition, but it afflicts a good number of Americans, with white women being more prone, though there has been some speculation that this was the origin of deafness in the composer Beethoven. Its cause is unknown, but chronic inflammation may be a risk factor. We tend to associate hearing loss with older adults, but peak onset is in the middle adulthood age bracket.
Weight gain, sometimes referred to as the middle-aged spread, or the accumulation of fat in the abdomen is one of the common complaints of midlife adults. Men tend to gain fat on their upper abdomen and back while women tend to gain more fat on their waist and upper arms. Many adults are surprised at this weight gain because their diets have not changed. However, the metabolism slows by about one-third during midlife.[13] Consequently, midlife adults have to increase their level of exercise, eat less, and watch their nutrition to maintain their earlier physique.
Many of the changes that occur in midlife can be easily compensated for (by buying glasses, exercising, and watching what one eats, for example.) Most midlife adults experience generally good health. However, the percentage of adults who have a disability increases through midlife; while 7 percent of people in their early 40s have a disability, the rate jumps to 30 percent by the early 60s. This increase is highest among those of lower socioeconomic status.[14]
What can we conclude from this information? Again, lifestyle has a strong impact on the health status of midlife adults. Smoking tobacco, drinking alcohol, poor diet, stress, physical inactivity, and chronic disease such as diabetes or arthritis reduce overall health. It becomes important for midlife adults to take preventative measures to enhance physical well-being. Those midlife adults who have a strong sense of mastery and control over their lives, who engage in challenging physical and mental activity, who engage in weight bearing exercise, monitor their nutrition, and make use of social resources are most likely to enjoy a plateau of good health through these years. Not only that, but those who begin an exercise regimen in their 40s may enjoy comparable benefits to those who began in their 20s according to Saint-Maurice et al (2019), who also found that while it is never too late to begin, continuing to do as much as possible, is just as important.[15]
The Climacteric
One biologically based change that occurs during midlife is the climacteric. During midlife, men may experience a reduction in their ability to reproduce. Women, however, lose their ability to reproduce once they reach menopause.
Menopause
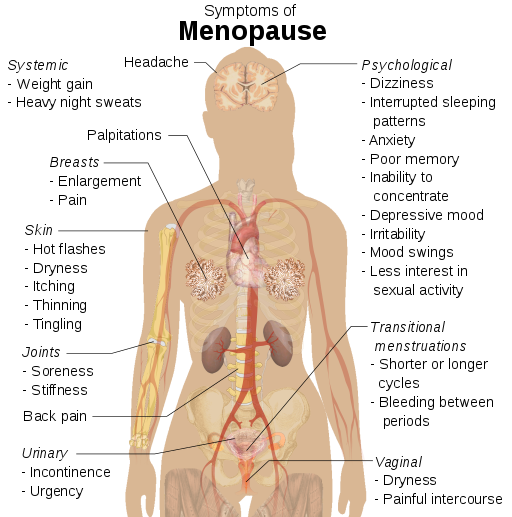
Menopause refers to a period of transition in which a woman’s ovaries stop releasing eggs and the level of estrogen and progesterone production decreases (Figure 3). After menopause, a woman’s menstruation ceases.[16]
Changes typically occur between the mid 40s and mid 50s. The median age range for a woman to have her last menstrual period is 50-52, but ages vary. A woman may first begin to notice that her periods are more or less frequent than before. These changes in menstruation may last from 1 to 3 years. After a year without menstruation, a woman is considered menopausal and no longer capable of reproduction. (Keep in mind that some women, however, may experience another period even after going for a year without one.) The loss of estrogen also affects vaginal lubrication which diminishes and becomes more watery. The vaginal wall also becomes thinner, and less elastic.
Menopause is not seen as universally distressing.[17] Changes in hormone levels are associated with hot flashes and sweats in some women, but women vary in the extent to which these are experienced. Depression, irritability, and weight gain are not necessarily due to menopause.[18][19] Depression and mood swings are more common during menopause in women who have prior histories of these conditions rather than those who have not. The incidence of depression and mood swings is not greater among menopausal women than non-menopausal women.
Cultural influences seem to also play a role in the way menopause is experienced. For example, once after listing the symptoms of menopause in a psychology course, a woman from Kenya responded, “We do not have this in my country or if we do, it is not a big deal,” to which some U.S. students replied, “I want to go there!” Indeed, there are cultural variations in the experience of menopausal symptoms. Hot flashes are experienced by 75 percent of women in Western cultures, but by less than 20 percent of women in Japan.[20]
Women in the United States respond differently to menopause depending upon the expectations they have for themselves and their lives. White, career-oriented women, African-American, and Mexican-American women overall tend to think of menopause as a liberating experience. Nevertheless, there has been a popular tendency to erroneously attribute frustrations and irritations expressed by women of menopausal age to menopause and thereby not take her concerns seriously. Fortunately, many practitioners in the United States today are normalizing rather than pathologizing menopause.
Concerns about the effects of hormone replacement have changed the frequency with which estrogen replacement and hormone replacement therapies have been prescribed for menopausal women. Estrogen replacement therapy was once commonly used to treat menopausal symptoms. But more recently, hormone replacement therapy has been associated with breast cancer, stroke, and the development of blood clots.[21] Most women do not have symptoms severe enough to warrant estrogen or hormone replacement therapy (HRT). Women who do require HRT can be treated with lower doses of estrogen and monitored with more frequent breast and pelvic exams. There are also some other ways to reduce symptoms. These include avoiding caffeine and alcohol, eating soy, remaining sexually active, practicing relaxation techniques, and using water-based lubricants during intercourse.
Fifty million women in the USA aged 50-55 are post-menopausal. During and after menopause a majority of women will experience weight gain. Changes in estrogen levels lead to a redistribution of body fat from hips and back to stomachs. This is more dangerous to general health and wellbeing because abdominal fat is largely visceral, meaning it is contained within the abdominal cavity and may not look like typical weight gain. That is, it accumulates in the space between the liver, intestines and other vital organs. This is far more harmful to health than subcutaneous fat which is the kind of fat located under the skin. It is possible to be relatively thin and retain a high level of visceral fat, yet this type of fat is deemed especially harmful by medical research.
Andropause
Do males experience a climacteric? Yes. While they do not lose their ability to reproduce as they age, they do tend to produce lower levels of testosterone and fewer sperm. However, men are capable of reproduction throughout life after puberty. It is natural for sex drive to diminish slightly as men age, but a lack of sex drive may be a result of extremely low levels of testosterone. About 5 million men experience low levels of testosterone that results in symptoms such as a loss of interest in sex, loss of body hair, difficulty achieving or maintaining erection, loss of muscle mass, and breast enlargement. This decrease in libido and lower testosterone (androgen) levels is known as andropause, although this term is somewhat controversial as this experience is not clearly delineated, as menopause is for women. Low testosterone levels may be due to glandular disease such as testicular cancer. Testosterone levels can be tested and if they are low, men can be treated with testosterone replacement therapy. This can increase sex drive, muscle mass, and beard growth. However, long term HRT for men can increase the risk of prostate cancer.[22]
The debate around declining testosterone levels in men may hide a fundamental fact. The issue is not about individual males experiencing individual hormonal change at all. We have all seen the adverts on the media promoting substances to boost testosterone: “Is it low-T?” The answer is probably in the affirmative, if somewhat relative. That is, in all likelihood they will have lower testosterone levels than their fathers. However, it is equally likely that the issue does not lie solely in their individual physiological make up, but is rather a generational transformation.[23] Why this has occurred in such a dramatic fashion is still unknown. There is evidence that low testosterone may have negative health effects on men. In addition, there are studies which show evidence of rapidly decreasing sperm count and grip strength. Exactly why these changes are happening is unknown and will likely involve more than one cause.
The Climacteric and Sexuality
Sexuality is an important part of people’s lives at any age. Midlife adults tend to have sex lives that are very similar to that of younger adulthood. And many women feel freer and less inhibited sexually as they age. However, a woman may notice less vaginal lubrication during arousal and men may experience changes in their erections from time to time. This is particularly true for men after age 65. Men who experience consistent problems are likely to have other medical conditions (such as diabetes or heart disease) that impact sexual functioning.[24]
Couples continue to enjoy physical intimacy and may engage in more foreplay, oral sex, and other forms of sexual expression rather than focusing as much on sexual intercourse. Risk of pregnancy continues until a woman has been without menstruation for at least 12 months, however, and couples should continue to use contraception. People continue to be at risk of contracting sexually transmitted infections such as genital herpes, chlamydia, and genital warts. Seventeen percent of new cases of AIDS in the United States are in people 50 and older.[25] Of all people living with HIV, 47% are aged 50 or over.[26] Practicing safe sex is important at any age- safe sex is not just about avoiding an unwanted pregnancy… it is about protecting yourself from STDs as well. Hopefully, when partners understand how aging affects sexual expression, they will be less likely to misinterpret these changes as a lack of sexual interest or displeasure in the partner and be more able to continue to have satisfying and safe sexual relationships.
Exercise, Nutrition, and Health
The impact of exercise

Exercise is a powerful way to combat the changes we associate with aging. Exercise builds muscle, increases metabolism, helps control blood sugar, increases bone density, and relieves stress. Unfortunately, fewer than half of midlife adults exercise and only about 20 percent exercise frequently and strenuously enough to achieve health benefits. Many stop exercising soon after they begin an exercise program-particularly those who are very overweight. The best exercise programs are those that are engaged in regularly—regardless of the activity, but a well-rounded program that is easy to follow includes walking and weight training. Having a safe, enjoyable place to walk can make the difference in whether or not someone walks regularly. Weight lifting and stretching exercises at home can also be part of an effective program. Exercise is particularly helpful in reducing stress in midlife (Figure 4). Walking, jogging, cycling, or swimming can release the tension caused by stressors, and learning relaxation techniques can have healthful benefits. Exercise can be thought of as preventative health care; promoting exercise for the 78 million “baby boomers” may be one of the best ways to reduce health care costs and improve quality of life.[27]
Nutrition
Aging brings about a reduction in the number of calories a person requires. Many Americans respond to weight gain by dieting. However, eating less does not necessarily mean eating right and people often suffer vitamin and mineral deficiencies as a result. Very often, physicians will recommend vitamin supplements to their middle aged patients. As stated above, chronic inflammation is now identified as one of the so called “pillars of aging”. The link between diet and inflammation is yet unclear, but there is now some information available on the Diet Inflammation Index[28], which in popular parlance, supports a diet rich in plant-based foods, healthy fats, nuts, fish in moderation, and sparing use of red meat— often referred to as “the Mediterranean Diet.”
The ideal diet is one low in fat, low in sugar, high in fiber, low in sodium, and low in cholesterol. In 2005, the Food Pyramid, a set of nutritional guidelines established by the U. S. Government was updated to accommodate new information on nutrition and to provide people with guidelines based on age, sex, and activity levels. The ideal diet is low in sodium (less than 2300 mg per day). Sodium causes fluid retention which may in turn exacerbate high blood pressure. The ideal diet is also low in cholesterol (less than 300 mg per day) and high in fiber. Fiber is thought to reduce the risk of certain cancers and heart disease. Finally, an ideal diet is low in sugar. Sugar is not only a problem for diabetics; it is also a problem for most people. Sugar satisfies the appetite but provides no protein, vitamins or minerals. It provides empty calories. High starch diets are also a problem because starch is converted to sugar in the body. A 1-2 ounce serving of red wine (or grape juice) may have beneficial effects on health, as red wine can increase “good cholesterol” or HDLs (high density lipoproteins) in the blood and provide antioxidants important for combating aging.[29]
Try It
Health Concerns
Heart Disease: According to the most recent National Vital Statistics Reports[30] heart disease continues to be the number one cause of death for Americans as it claimed 23.5% of those who died in 2013. It is also the number one cause of death worldwide.[31] Heart disease develops slowly over time and typically appears in midlife.[32]
Heart disease can include heart defects and heart rhythm problems, as well as narrowed, blocked, or stiffened blood vessels referred to as cardiovascular disease. The blocked blood vessels prevent the body and heart from receiving adequate blood. Atherosclerosis, or a buildup of fatty plaque in the arteries, is the most common cause of cardiovascular disease. The plaque buildup thickens the artery walls and restricts the blood flow to organs and tissues. Cardiovascular disease can lead to a heart attack, chest pain (angina), or stroke[33]. Figure 5 illustrates atherosclerosis.

Symptoms of cardiovascular disease differ for men and women. Males are more likely to suffer chest pain, while women are more likely to demonstrate shortness of breath, nausea, and extreme fatigue. Symptoms can also include pain in the arms, legs, neck, jaw, throat, abdomen or back.[34]
According to the Mayo Clinic[35] there are many risk factors for developing heart disease, including medical conditions, such as high blood pressure, high cholesterol, diabetes, and obesity. Other risk factors include:
- Advanced Age-increased risk for narrowed arteries and weakened or thickened heart muscle.
- Sex-males are at greater risk, but a female’s risk increases after menopause.
- Family History-increased risk, especially if male parent or brother developed heart. disease before age 55 or female parent or sister developed heart disease before age 65.
- Smoking-nicotine constricts blood vessels and carbon monoxide damages the inner lining.
- Poor Diet-a diet high in fat, salt, sugar, and cholesterol.
- Stress-unrelieved stress can damage arteries and worsen other risk factors.
- Poor Hygiene-establishing good hygiene habits can prevent viral or bacterial infections that can affect the heart. Poor dental car can also contribute to heart disease.
Complications of heart disease can include heart failure, when the heart cannot pump enough blood to the meet the body’s needs, and a heart attack, when a blood clot blocks the blood flow to the heart. This blockage can damage or destroy a part of the heart muscle, and atherosclerosis is a factor in a heart attack. Treatment for heart disease includes medication, surgery, and lifestyle changes including exercise, healthy diet, and refraining from smoking.
Sudden cardiac arrest is the unexpected loss of heart functioning, breathing, and consciousness, often caused by an arrhythmia or abnormal heartbeat. The heart beat may be too quick, too slow, or irregular. With a healthy heart, it is unlikely for a fatal arrhythmia to develop without an outside factor, such as an electric shock or illegal drugs. If not treated immediately, sudden cardiac arrest can be fatal and result in sudden cardiac death.
Hypertension, or high blood pressure, is a serious health problem that occurs when the blood flows with a greater force than normal. One in three American adults (70 million people) have hypertension and only half have it under control.[36] It can strain the heart, increase the risk of heart attack and stroke, or damage the kidneys[37]. Uncontrolled high blood pressure in early and middle adulthood can also damage the brain’s white matter (axons), and may be linked to cognitive problems later in life.[38] Normal blood pressure is under 120/80 (see Table 1). The first number is the systolic pressure, which is the pressure in the blood vessels when the heart beats. The second number is the diastolic pressure, which is the pressure in the blood vessels when the heart is at rest. High blood pressure is sometimes referred to as the silent killer, as most people with hypertension experience no symptoms.
|
|
Systolic Pressure |
Diastolic Pressure |
|
Normal |
Under 120 |
Under 80 |
|
Prehypertension (at risk) |
120-139 |
80-89 |
|
Hypertension |
140 or higher |
90 or higher |
Table Source: adapted from CDC (2014c)[39]
Risk factors for high blood pressure include:
- Family history of hypertension
- Diet that is too high in sodium, often found in processed foods, and too low in potassium
- Sedentary lifestyle
- Obesity
- Too much alcohol consumption
- Tobacco use, as nicotine raises blood pressure[40].
Making lifestyle changes can often reduce blood pressure in many people.
Cancer
After heart disease, cancer was the second leading cause of death for Americans in 2013 as it accounted for 22.5% of all deaths.[41] According to the National Institutes of Health[42], cancer is the name given to a collection of related diseases in which the body’s cells begin to divide without stopping and spread into surrounding tissues. These extra cells can divide and form growths called tumors, which are typically masses of tissue. Cancerous tumors are malignant, which means they can invade nearby tissues. When removed malignant tumors may grow back. Unlike malignant tumors, benign tumors do not invade nearby tissues. Benign tumors can sometimes be quite large, and when removed usually do not grow back. Although benign tumors in the body are not cancerous, benign brain tumors can be life threatening.
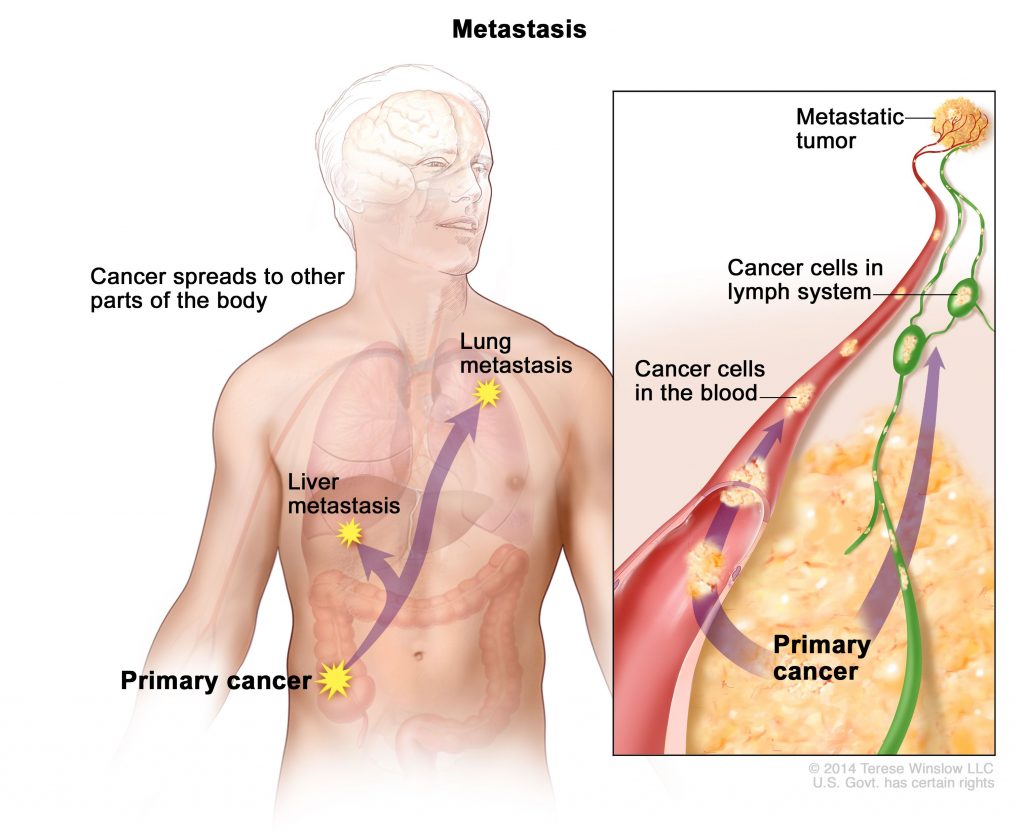
Cancer cells can prompt nearby normal cells to form blood vessels that supply the tumors with oxygen and nutrients, which allows them to grow. These blood vessels also remove waste products from the tumors. Cancer cells can also hide from the immune system, a network of organs, tissues, and specialized cells that protects the body from infections and other conditions. Lastly, cancer cells can metastasize, which means they can break from where they first formed, called the primary cancer, and travel through the lymph system or blood to form new tumors in other parts of the body. This new metastatic tumor is the same type as the primary tumor.[43] Figure 6 illustrates how cancers can metastasize.
Cancer can start almost anywhere in the human body. While normal cells mature into very distinct cell types with specific functions, cancer cells do not and continue to divide without stopping. Further, cancer cells are able to ignore the signals that normally tell cells to stop dividing or to begin a process known as programmed cell death which the body uses to get rid of unneeded cells. With the growth of cancer cells, normal cells are crowded out and the body is unable to work the way it is supposed to. For example, the cancer cells in lung cancer form tumors which interfere with the functioning of the lungs and how oxygen is transported to the rest of the body.
There are more than 100 types of cancer. The American Cancer Society assemblies a list of the most common types of cancers in the United States. To qualify for the 2016 list, the estimated annual incidence had to be 40, 000 cases or more. The most common type of cancer on the list is breast cancer, with more than 249,000 new cases expected in 2016. The next most common cancers are lung cancer and prostate cancer. Table 2 lists the estimated number of new cases and deaths for each common cancer type.[44]
|
Cancer Type |
Estimated New Cases |
Estimated Deaths |
|
Bladder |
76,960 |
16,390 |
|
Breast (Female – Male) |
246,660 – 2,600 |
40,450 – 440 |
|
Colon and Rectal (Combined) |
134,490 |
49,190 |
|
Endometrial |
60,050 |
10,470 |
|
Kidney (Renal Cell and Renal Pelvis) Cancer |
62,700 |
14,240 |
|
Leukemia (All Types) |
60,140 |
24,400 |
|
Lung (Including Bronchus) |
224,390 |
158,080 |
|
Melanoma |
76,380 |
10,130 |
|
Non-Hodgkin Lymphoma |
72,580 |
20,150 |
|
Pancreatic |
53,070 |
41,780 |
|
Prostate |
180,890 |
26,120 |
|
Thyroid |
64,300 |
1,980 |
Cholesterol is a waxy fatty substance carried by lipoprotein molecules in the blood. It is created by the body to create hormones and digest fatty foods, and is also found in many foods. Your body needs cholesterol, but too much can cause heart disease and stroke. Two important kinds of cholesterol are low-density lipoprotein (LDL) and high-density lipoprotein (HDL). A third type of fat is called triglycerides. Your total cholesterol score is based on all three types of lipids (see Table 3). Total cholesterol is calculated by adding HDL plus LDL plus 20% of the Triglycerides.
| Cholesterol Type | Normal |
| Total Cholesterol | Less than 200 md/dl* |
| LDL | Less than 100 mg/dl |
| HDL | 40mg/dl or higher |
| Triglycerides | Less than 150mg/dl |
LDL cholesterol makes up the majority of the body’s cholesterol, however, it is often referred to as “bad” cholesterol because at high levels it can form plaque in the arteries leading to heart attack and stroke. HDL cholesterol, often referred to as “good” cholesterol, absorbs cholesterol and carries it back to the liver, where it is then flushed from the body. Higher levels of HDL can reduce the risk of heart attack and stroke. Triglycerides are a type of fat in the blood used for energy. High levels of triglycerides can also increase your risk for heart disease and stroke when coupled with high LDL and low HDL. All adults 20 or older should have their cholesterol checked. In early adulthood, doctors may check every few years if the numbers have previously been normal, and there are no other signs of heart disease. In middle adulthood, this may become part of the annual check-up.[45]
Risk factors for high cholesterol include: A family history for high cholesterol, diabetes, a diet high in saturated fats, trans fat, and cholesterol, physical inactivity, and obesity. Almost 32% of American adults have high LDL cholesterol levels, and the majority do not have it under control, nor have they made lifestyle changes (Figure 7).[46]

Diabetes (Diabetes Mellitus) is a disease in which the body does not control the amount of glucose in the blood. This disease occurs when the body does not make enough insulin or does not use it the way it should.[47]. Insulin is a type of hormone that helps glucose in the blood enter cells to give them energy. In adults, 90% to 95% of all diagnosed cases of diabetes are type 2.[48] Type 2 diabetes usually begins with insulin resistance, a disorder in which the cells in the muscles, liver, and fat tissue do not use insulin properly.[49] As the need for insulin increases, cells in the pancreas gradually lose the ability to produce enough insulin. In some Type 2 diabetics, pancreatic beta cells will cease functioning, and the need for insulin injections will become necessary. Some people with diabetes experience insulin resistance with only minor dysfunction of the beta cell secretion of insulin. Other diabetics experience only slight insulin resistance, with the primary cause being a lack of insulin secretion.[50]
| Population | Number with Diabetes (millions) | Percentage with Diabetes (unadjusted) |
| All people 20 years and older | 28.9 | 12.3 |
| All men | 15.5 | 13.6 |
| All women | 13.4 | 11.2 |
| 20-44 years old | 4.3 | 4.1 |
| 45-64 years old | 13.4 | 16.2 |
| 65-years or older | 11.2 | 25.9 |
One in three adults are estimated to have prediabetes, and 9 in 10 of them do not know. According to the CDC[51] without intervention, 15% to 30% of those with prediabetes will develop diabetes within 5 years. In 2012, 29 million people (over 9% of the population) were living with diabetes in America, mostly adults age 20 and up. Table 4 shows the numbers in millions and percentage of adults, by age and gender, living with diabetes. The median age of diagnosis is 54[52]. During middle adulthood, the number of people with diabetes dramatically increases; with 4.3 million living with diabetes prior to age 45, to over 13 million between the ages of 45 to 64; a four-fold increase. Men are slightly more likely to experience diabetes than are women.
Diabetes also affects ethnic and racial groups differently. Non-Hispanic Whites (7.6%) are less likely to be diagnosed with diabetes than are Asian Americans (9%), Hispanics (12.8%), non- Hispanic Blacks (13.2%), and American Indians/Alaskan Natives (15.9%). However, these general figures hide the variations within these groups. For instance the rate of diabetes was less for Central, South, and Cuban Americans than for Mexican Americans and Puerto Ricans, and four times less for Alaskan Natives than the American Indians of southern Arizona.[53]
The risk factors for diabetes include:
- Those over age 45
- Obesity
- Family history of diabetes
- History of gestational diabetes (see Chapter 2)
- Race and ethnicity
- Physical inactivity
- Diet
Diabetes has been linked to numerous health complications. Adults with diabetes are 1.7 times more likely to have cardiovascular disease, 1.8 times more likely to experience a heart attack, and 1.5 times more likely to experience stroke than adults without diabetes. Diabetes can cause blindness and other eye problems. In diabetics age 40 or older, 28.5% showed signs of diabetic retinopathy, damage to the small blood vessels in the retina that may lead to loss of vision. More than 4% showed advanced diabetic retinopathy. Diabetes is linked as the primary cause of almost half (44%) of new cases of kidney failure each year. About 60% of non-traumatic limb amputations occur in people with diabetes. Diabetes has been linked to hearing loss, tinnitus (ringing in the ears), gum disease, and neuropathy (nerve disease).[54]
Typical tests for diabetes include a fasting glucose test and the A1C (See Table 5). Fasting glucose levels should be under 100mg/dl.[55] The A1C provides information about the average levels of blood glucose over the last 3 months.[56] The A1C should be under 5.7, where a 5.0 = 97mg/dl and a 6.0 = 126 mg/dl.[57]
|
|
Normal |
Prediabetes |
Diabetes |
|
Fasting Glucose |
Below 100mg/dl |
100-125mg/dl |
126mg/dl + |
|
A1C |
Under 5.7 |
5.7-6.9 |
7+ |
Adapted from the American Diabetes Association (2016)[58]
Metabolic Syndrome is a cluster of several cardiometabolic risk factors, including large waist circumference, high blood pressure, and elevated triglycerides, LDL, and blood glucose levels, which can lead to diabetes and heart disease.[59] The prevalence of metabolic syndrome in the U.S. is approximately 34% and is especially high among Hispanics and African Americans[60]. Prevalence increases with age, peaking in one’s 60s[61]. Metabolic syndrome increases morbidity from cardiovascular disease and diabetes.[62][63] Hu and colleagues found that even having one or two of the risk factors for metabolic syndrome increased the risk of mortality. Crist et al.[64] found that increasing aerobic activity and reducing weight led to a drop in many of the risk factors of metabolic syndrome, including a reduction in waist circumference and blood pressure, and an increase in HDL cholesterol.
Rheumatoid arthritis

Rheumatoid arthritis (RA) is an inflammatory disease that causes pain, swelling, stiffness, and loss of function in the joints.[65] RA occurs when the immune system attacks the membrane lining the joints (see Figure 8). RA is the second most common form of arthritis after osteoarthritis, which is the normal wear and tear on the joints discussed in chapter 9. Unlike osteoarthritis, RA is symmetric in its attack of the body, thus, if one shoulder is affected so is the other. In addition, those with RA may experience fatigue and fever. Below are the common features of RA.[66]
Features of Rheumatoid Arthritis
- Tender, warm, swollen joints
- Symmetrical pattern of affected joints
- Joint inflammation often affecting the wrist and finger joints closest to the hand
- Joint inflammation sometimes affecting other joints, including the neck, shoulders, elbows, hips, knees, ankles, and feet
- Fatigue, occasional fevers, a loss of energy
- Pain and stiffness lasting for more than 30 minutes in the morning or after a long rest
- Symptoms that last for many years
- Variability of symptoms among people with the disease.
About 1.5 million people (approximately 0.6%) of Americans experience rheumatoid arthritis. It occurs across all races and age groups, although the disease often begins in middle adulthood and occurs with increased frequency in older people. Like some other forms of arthritis, rheumatoid arthritis occurs much more frequently in women than in men. About two to three times as many women as men have the disease.[67] The lifetime risk for RA for women is 3.6% and 1.7% for men.[68]
Genes play a role in the development of RA. However, individual genes by themselves confer only a small risk of developing the disease, as some people who have these particular genes never develop RA. Scientists think that something must occur to trigger the disease process in people whose genetic makeup makes them susceptible to rheumatoid arthritis. For instance, some scientists also think hormonal factors may be involved. In women who experience RA, the symptoms may improve during pregnancy and flare after pregnancy. Women who use oral contraceptives may increase their likelihood of developing RA. This suggests hormones, or possibly deficiencies or changes in certain hormones, may increase the risk of developing RA in a genetically susceptible person.[69]
Rheumatoid arthritis can affect virtually every area of a person’s life, and it can interfere with the joys and responsibilities of work and family life. Fortunately, current treatment strategies allow most people with RA to lead active and productive lives. Pain-relieving drugs and medications can slow joint damage, and establishing a balance between rest and exercise can also lessen the symptoms of RA.[70]
Digestive Issues
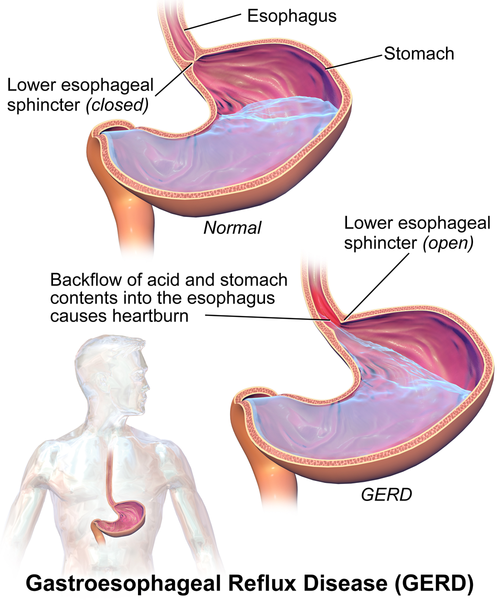
Heartburn, also called acid indigestion or pyrosis, is a common digestive problem in adults and is the result of stomach acid backing up into the esophagus (Figure 9). Prolonged contact with the digestive juices injures the lining of the esophagus and causes discomfort. Heartburn that occurs more frequently may be due to gastroesophageal reflux disease, GERD. Normally the lower sphincter muscle in the esophagus keeps the acid in the stomach from entering the esophagus. In GERD this muscle relaxes too frequently and the stomach acid flows into the esophagus. In the U.S. 60 million people experience heartburn at least once a month, and 15 million experience it every day. Prolonged problems with heartburn can lead to more serious complications, including esophageal cancer, one of the most lethal forms of cancer in the U.S. Problems with heartburn can be linked to eating fatty or spicy foods, caffeine, smoking, and eating before bedtime.[71]
Gallstones are hard particles, including fatty materials, bile pigments, and calcium deposits, that can develop in the gallbladder. Ranging in size from a grain of sand to a golf ball, they typically take years to develop, but in some people have developed over the course of a few months. About 75% of gallstones do not create any symptoms, but those that do may cause sporadic upper abdominal pain when stones block bile or pancreatic ducts. If stones become lodged in the ducts, it may necessitate surgery or other medical intervention as it could become life-threatening if left untreated.[72]
Gallstones are present in about 20% of women and 10% of men over the age of 55.[73] Risk factors include a family history of gallstones, diets high in calories and refined carbohydrates (such as, white bread and rice), diabetes, metabolic syndrome, Crohn’s disease, and obesity, which increases the cholesterol in the bile and thus increases the risk of developing gallstones[74].
Sensory Changes

Vision (Figure 10): A normal change of the eye due to age is presbyopia, which is Latin for “old vision.” It refers to a loss of elasticity in the lens of the eye that makes it harder for the eye to focus on objects that are closer to the person. When we look at something far away, the lens flattens out; when looking at nearby objects tiny muscle fibers around the lens enable the eye to bend the lens. With age these muscles weaken and can no longer accommodate the lens to focus the light. Anyone over the age of 35 is at risk for developing presbyopia. According to the National Eye Institute (NEI)[75], signs that someone may have presbyopia include:
- Hard time reading small print
- Having to hold reading material farther than arm’s distance
- Problems seeing objects that are close
- Headaches
- Eyestrain
Another common eye problem people experience as they age are floaters, little spots or “cobwebs” that float around the field of vision. They are most noticeable if you are looking at the sky on a sunny day, or at a lighted blank screen. Floaters occur when the vitreous, a gel-like substance in the interior of the eye, slowly shrinks. As it shrinks, it becomes somewhat stringy, and these strands can cast tiny shadows on the retina. In most cases, floaters are harmless, more of an annoyance than a sign of eye problems. However, floaters that appear suddenly, or that darken and obscure vision can be a sign of more serious eye problems, such a retinal tearing, infection, or inflammation. People who are very nearsighted (myopic), have diabetes, or who have had cataract surgery are also more likely to have floaters.[76]
During midlife, adults may begin to notice a drop in scotopic sensitivity, the ability to see in dimmer light. By age 60, the retina receives only one third as much light as it did at age 20, making working in dimmer light more difficult (Jackson & Owsley, 2000). Night vision is also affected as the pupil loses some of its ability to open and close to accommodate drastic changes in light. Eyes become more sensitive to glare from headlights and street lights making it difficult to see people and cars, and movements outside of our direct line of sight.[77]
Finally, some people experience dry eye syndrome, which occurs when the eye does not produce tears properly, or when the tears evaporate too quickly because they are not the correct consistency.[78] While dry eye can affect people at any age, nearly 5 million Americans over the age of 50 experience dry eye. It affects women more than men, especially after menopause. Women who experienced an early menopause may be more likely to experience dry eye, which can cause surface damage to the eye.

Hearing: Hearing problems increase during middle adulthood. According to a recent UK study[79], the rate of hearing problems in their sample doubled between the ages of 40 and 55 and tripled by age 64 (Figure 11). Similar statistics are found in U.S. samples of middle-aged adults. Prior to age 40, about 5.5% of adults report hearing problems. This jumps to 19% among 40 to 69 year-olds.[80] Middle-aged adults may experience more problems understanding speech when in noisy environments, in comparison to younger adults.[81][82] As we age we also lose the ability to hear higher frequencies.[83] Hearing changes are more common among men than women, but males may underestimate their hearing problems.[84] For many adults, hearing loss accumulates after years of being exposed to intense noise levels. Men are more likely to work in noisy occupations. Hearing loss is also exacerbated by cigarette smoking, high blood pressure, and stroke. Most hearing loss could be prevented by guarding against being exposed to extremely noisy environments.
- This chapter was adapted from select chapters in Lumen Learning's Lifespan Development, authored by Martha Lally and Suzanne Valentine-French available under a Creative Commons Attribution-NonCommercial-ShareAlike license, and Waymaker Lifespan Development, authored by Ronnie Mather for Lumen Learning and available under a Creative Commons Attribution license. Some selections from Lumen Learning were adapted from previously shared content from Laura Overstreet's Lifespan Psychology. ↵
- Busse, E. W. (1969). Theories of aging. In E. W. Busse & E/. Pfeiffer (Eds.), Behavior and adaptation in later life (pp. 11-31). Boston, MA: Little Brown. ↵
- Volpi, E., Nazemi, R., & Fujita, S. (2004). Muscle tissue changes with aging. Current opinion in clinical nutrition and metabolic care, 7(4), 405-10. ↵
- Volpi, E., Nazemi, R., & Fujita, S. (2004). Muscle tissue changes with aging. Current opinion in clinical nutrition and metabolic care, 7(4), 405-10. ↵
- Piasecki, M., Piasecki, J., Stashuk, D. W., Swiecicka, A., Rutter, M. K., Jones, D. A., & McPhee, J. S. (2018, March 23). Failure to expand the motor unit size to compensate for declining motor unit numbers distinguishes sarcopenic from non‐sarcopenic older men. https://physoc.onlinelibrary.wiley.com/doi/full/10.1113/JP275520 ↵
- Piasecki, M., Piasecki, J., Stashuk, D. W., Swiecicka, A., Rutter, M. K., Jones, D. A., & McPhee, J. S. (2018, March 23). Failure to expand the motor unit size to compensate for declining motor unit numbers distinguishes sarcopenic from non‐sarcopenic older men. https://physoc.onlinelibrary.wiley.com/doi/full/10.1113/JP275520 ↵
- Adami, R., Pagano, J., Colombo, M., Platonova, N., Recchia, D., Chiaramonte, R., Bottinelli, R., Canepari, M., & Bottai, D. (2018). Reduction of movement in neurological diseases: Effects on neural stem cells characteristics. Frontiers in Neuroscience, 12, 336. https://doi.org/10.3389/fnins.2018.00336 ↵
- Santos-Longhurst, Adrienne. Understanding and Managing Chronic Inflammation. Healthline. https://www.healthline.com/health/chronic-inflammation#symptoms. ↵
- Nersesian, P. V., Han, H.-R., Yenokyan, G., Blumenthal, R. S., Nolan, M. T., Hladek, M. D., & Szanton, S. L. (2018). Loneliness in middle age and biomarkers of systemic inflammation: Findings from Midlife in the United States. Social Science & Medicine (1982), 209, 174–181. https://doi.org/10.1016/j.socscimed.2018.04.007 ↵
- Toth, M. J., Matthews, D. E., Tracy, R. P., & Previs, M. J. (2005). Age-related differences in skeletal muscle protein synthesis: relation to markers of immune activation. American Journal of Physiology. Endocrinology and Metabolism, 288(5), E883-91. https://doi.org/10.1152/ajpendo.00353.2004 ↵
- Lachman, M. E. (2004). Development in midlife. Annual Review of Psychology, 55(1), 305–331. https://doi.org/10.1146/annurev.psych.55.090902.141521 ↵
- National Institute on Deafness and Other Communication Disorders. Quick Statistics on Hearing. https://www.nidcd.nih.gov/health/statistics/quick-statistics-hearing. ↵
- Berger, K. S. (2005). The developing person through the life span (6th ed.). New York: Worth. ↵
- Bumpass, L. L., & Aquilino, W. S. (1995). A social map of midlife: Family and work over the life course. Prepared for the MacArthur Foundation Research Network on Successful Midlife Development. ↵
- Saint-Maurice, P. F., Coughlan, D., Kelly, S. P., Keadle, S. K., Cook, M. B., Carlson, S. A., Fulton, J. E., & Matthews, C. E. (2019). Association of leisure-time physical activity across the adult life course with all-cause and cause-specific mortality. JAMA Network Open, 2(3), e190355. https://doi.org/10.1001/jamanetworkopen.2019.0355 ↵
- National Institutes of Health. (2007). Menopause: MedlinePlus Medical Encyclopedia. http://www.nlm.nih.gov/medlineplus/ency/article/000894.htm ↵
- Lachman, M. E. (2004). Development in midlife. Annual Review of Psychology, 55(1), 305–331. https://doi.org/10.1146/annurev.psych.55.090902.141521 ↵
- Rossi, A. (2019). Chapter Six. The Menopausal Transition and Aging Processes. In O. Brim, C. Ryff & R. Kessler (Ed.), How Healthy Are We?: A National Study of Well-Being at Midlife (pp. 153-202). Chicago: University of Chicago Press. https://doi.org/10.7208/9780226074764-007 ↵
- Reid, J. D. (1999). Women’s health in midlife. In N. E. Avis (Author) & S. L. Willis (Ed.), Life in the Middle: Psychological and Social Development in Middle Age (pp. 105-147). San Diego, CA: Academic. ↵
- Berk, L. (2007). Development through the life span (4th ed.). Boston: Allyn and Bacon. ↵
- National Institutes of Health. (2007). Menopause: MedlinePlus Medical Encyclopedia. http://www.nlm.nih.gov/medlineplus/ency/article/000894.htm ↵
- Patient Education Institute. (n.d.). Low Testosterone: MedlinePlus Interactive Health Tutorial. http://www.nlm.nih.gov/medlineplus/tutorials/lowtestosterone/htm/index.htm ↵
- Travison, T. G., Araujo, A. B., O’Donnell, A. B., Kupelian, V., & McKinlay, J. B. (2007). A population-level decline in serum testosterone levels in American men. The Journal of Clinical Endocrinology and Metabolism, 92(1), 196–202. https://doi.org/10.1210/jc.2006-1375 ↵
- National Institute on Aging. (2005). Sexuality in Later Life. http://www.niapublications.org/agepages/sexuality.asp ↵
- Centers for Disease Control and Prevention. (2022). HIV: HIV in the United States by age. https://www.cdc.gov/hiv/group/age/olderamericans/index.html ↵
- National Institute of Health. (n.d.) Understanding HIV/AIDS. https://aidsinfo.nih.gov/understanding-hiv-aids/fact-sheets/25/80/hiv-and-older-adults ↵
- Shure, J., & Cahan, V. (1998, September 10). Launch an Exercise Program Today. National Institute on Aging. http://www.nia.nih.gov/NewsAndEvents/PressReleases/PR19980910Launch.htm ↵
- Shivappa, N., Steck, S. E., Hurley, T. G., Hussey, J. R., & Hébert, J. R. (2014). Designing and developing a literature-derived, population-based dietary inflammatory index. Public Health Nutrition, 17(8), 1689–1696. https://doi.org/10.1017/S1368980013002115 ↵
- Nersesian, P. V., Han, H.-R., Yenokyan, G., Blumenthal, R. S., Nolan, M. T., Hladek, M. D., & Szanton, S. L. (2018). Loneliness in middle age and biomarkers of systemic inflammation: Findings from Midlife in the United States. Social Science & Medicine (1982), 209, 174–181. https://doi.org/10.1016/j.socscimed.2018.04.007 ↵
- Xu, J., Murphy, S. L., Kochanek, K. D., & Bastian, B. A. (2016). Deaths: Final data for 2013. National Vital Statistics Reports, 64(2), 1-119. ↵
- World Health Organization (WHO). (2013). A global brief on hypertension: Silent killer, global public health crisis. http://apps.who.int/iris/bitstream/10665/79059/1/WHO_DCO_WHD_2013.2_eng.pdf?ua=1 ↵
- Hooker, E., & Pressman, S. (2016). The healthy life. NOBA. http://nobaproject.com/modules/the-healthy-life ↵
- Mayo Clinic. (2014a). Heart disease. http://www.mayoclinic.org/diseases-conditions/heart- disease/basics/definition/con-20034056 ↵
- Mayo Clinic. (2014a). Heart disease. http://www.mayoclinic.org/diseases-conditions/heart- disease/basics/definition/con-20034056 ↵
- Mayo Clinic. (2014a). Heart disease. http://www.mayoclinic.org/diseases-conditions/heart- disease/basics/definition/con-20034056 ↵
- Nwankwo T., Yoon S. S., Burt, V., & Gu, Q. (2013) Hypertension among adults in the US: National Health and Nutrition Examination Survey, 2011-2012. NCHS Data Brief, No. 133. Hyattsville, MD: National Center for Health Statistics, Centers for Disease Control and Prevention, US Dept of Health and Human Services. ↵
- Centers for Disease Control and Prevention (2014a). About high blood pressure. http://www.cdc.gov/bloodpressure/about.htm ↵
- Maillard, P., Sashardi, S., Beiser, A., Himail, J. J., Au, R., Fletcher, E., …. DeCarli, C. (2012). Effects of systolic blood pressure on white-matter integrity in young adults in the Farmington Heart Study: A cross-sectional study. The Lancet: Neurology, 11(12), 1039-1047. ↵
- Centers for Disease Control and Prevention. (2014c). Measuring high blood pressure. http://www.cdc.gov/bloodpressure/measure.htm ↵
- Centers for Disease Control and Prevention. (2014b). Behaviors that increase the risk for high blood pressure. http://www.cdc.gov/bloodpressure/behavior.htm ↵
- Xu, J., Murphy, S. L., Kochanek, K. D., & Bastian, B. A. (2016). Deaths: Final data for 2013. National Vital Statistics Reports, 64(2), 1-119. ↵
- National Institutes of Health. (2015). Cancer. Retrieved from https://www.cancer.gov/about-cancer/understanding/what-is-cancer ↵
- National Institutes of Health. (2015). Cancer. https://www.cancer.gov/about-cancer/understanding/what-is-cancer ↵
- American Cancer Society. (2016). Cancer Facts and Figures 2016. Atlanta, Ga: American Cancer Society. http://patients.gi.org/topics/acid-reflux/http://patients.gi.org/topics/digestive-health-tips/ ↵
- Centers for Disease Control and Prevention. (2015) Facts about high cholesterol. http://www.cdc.gov/cholesterol/facts.htm ↵
- Centers for Disease Control and Prevention. (2015) Facts about high cholesterol. http://www.cdc.gov/cholesterol/facts.htm ↵
- National Institutes of Health. (2016a) Facts about diabetes. http://www.niddk.nih.gov/health-information/health- topics/Diabetes/diabetes-facts/Pages/default.aspx ↵
- American Diabetes Association (2016). Standards of medical care in diabetes. Diabetes Care, 39(1), 1-112. ↵
- Centers for Disease Control and Prevention. (2014d). National diabetes statistics report, 2014. http://www.cdc.gov/diabetes/pubs/statsreport14/national-diabetes-report-web.pdf ↵
- Centers for Disease Control and Prevention. (2014d). National diabetes statistics report, 2014. http://www.cdc.gov/diabetes/pubs/statsreport14/national-diabetes-report-web.pdf ↵
- Centers for Disease Control and Prevention. (2014d). National diabetes statistics report, 2014. http://www.cdc.gov/diabetes/pubs/statsreport14/national-diabetes-report-web.pdf ↵
- Centers for Disease Control and Prevention. (2014d). National diabetes statistics report, 2014. http://www.cdc.gov/diabetes/pubs/statsreport14/national-diabetes-report-web.pdf ↵
- Centers for Disease Control and Prevention. (2014d). National diabetes statistics report, 2014. http://www.cdc.gov/diabetes/pubs/statsreport14/national-diabetes-report-web.pdf ↵
- Centers for Disease Control and Prevention. (2014d). National diabetes statistics report, 2014. http://www.cdc.gov/diabetes/pubs/statsreport14/national-diabetes-report-web.pdf ↵
- ADA, 2016 ↵
- National Institutes of Health. (2014a). The A1C and diabetes. http://www.niddk.nih.gov/health- information/health-topics/diagnostic-tests/a1c-test-diabetes/Pages/index.aspx ↵
- American Diabetes Association (2016). Standards of medical care in diabetes. Diabetes Care, 39(1), 1-112. ↵
- American Diabetes Association (2016). Standards of medical care in diabetes. Diabetes Care, 39(1), 1-112. ↵
- Crist, L. A., Champagne, C. M., Corsino, L., Lien, L. F., Zhang, G., & Young, D. R. (2012). Influence of change in aerobic fitness and weight on prevalence of metabolic syndrome. Preventing Chronic Disease 9,110171. http://dx.doi.org/10.5888/pcd9.110171 ↵
- Ford, E. S., Li, C., & Zhao, G. (2010). Prevalence and correlates of metabolic syndrome based on a harmonious definition among adults in the US. Journal of Diabetes, 2(3), 180-193. ↵
- Ford, E. S., Li, C., & Zhao, G. (2010). Prevalence and correlates of metabolic syndrome based on a harmonious definition among adults in the US. Journal of Diabetes, 2(3), 180-193. ↵
- Hu, G., Qiao, Q., Tuomilehto, J., Balkau, B., Borch, Johnsen, K., & Pyorala, K. (2004). Prevalence of metabolic syndrome and its relation to all-cause and cardiovascular mortality in non-diabetic European men and women. Archives of Internal Medicine, 164(10), 1066-1076. ↵
- Malik, S. (2004). Impact of the metabolic syndrome on mortality from coronary heart disease, cardiovascular disease, and all causes in United States adults. Circulation, 110(10), 1245-1250. ↵
- Crist, L. A., Champagne, C. M., Corsino, L., Lien, L. F., Zhang, G., & Young, D. R. (2012). Influence of change in aerobic fitness and weight on prevalence of metabolic syndrome. Preventing Chronic Disease 9,110171. http://dx.doi.org/10.5888/pcd9.110171 ↵
- National Institutes of Health (2016b). Handout on Health: Rheumatoid Arthritis. http://www.niams.nih.gov/health%5Finfo/rheumatic%5Fdisease/ ↵
- National Institutes of Health (2016b). Handout on Health: Rheumatoid Arthritis. http://www.niams.nih.gov/health%5Finfo/rheumatic%5Fdisease/ ↵
- National Institutes of Health (2016b). Handout on Health: Rheumatoid Arthritis. http://www.niams.nih.gov/health%5Finfo/rheumatic%5Fdisease/ ↵
- Crowson, C. S., Matteson, E. L., Myasoedova, E., Michet, C. J., Ernste, F. C., Warrington, K. J., …Gabriel, S. E. (2011). The lifetime risk of adult-onset rheumatoid arthritis and other inflammatory autoimmune rheumatic diseases. Arthritis and Rheumatism, 63(3), 633-639. https://doi.org/10.1002/art.30155. ↵
- National Institutes of Health (2016b). Handout on Health: Rheumatoid Arthritis. http://www.niams.nih.gov/health%5Finfo/rheumatic%5Fdisease/ ↵
- National Institutes of Health (2016b). Handout on Health: Rheumatoid Arthritis. http://www.niams.nih.gov/health%5Finfo/rheumatic%5Fdisease/ ↵
- American College of Gastroenterology. (2016a) Acid reflex: Overview. https://gi.org/topics/acid-reflux/ ↵
- American College of Gastroenterology. (2016b) Biliary tract dsorders, gallbladder disorders, and gallstone pancreatitis. https://gi.org/topics/acid-reflux/ ↵
- American College of Gastroenterology. (2016b) Biliary tract dsorders, gallbladder disorders, and gallstone pancreatitis. https://gi.org/topics/acid-reflux/ ↵
- National Institutes of Health. (2013). Gallstones. U.S. Department of Health and Human Services. http://www.niddk.nih.gov/health-information/health-topics/digestive-diseases/gallstones/Pages/facts.aspx ↵
- National Eye Institute. (2016). Facts about presbyopia. Department of Health and Human Services. https://nei.nih.gov/health/errors/presbyopia ↵
- National Eye Institute. (2009). Facts about floaters. Department of Health and Human Services. https://nei.nih.gov/health/floaters/floaters ↵
- National Institutes of Health. (2016c). Older drivers: How health affects driving. http://nihseniorhealth.gov/olderdrivers/howhealthaffectsdriving/01.html ↵
- National Eye Institute. (2013). Facts about dry eye. Department of Health and Human Services. Retrieved from https://nei.nih.gov/health/dryeye/dryeye ↵
- Dawes, P., DicMonrokinson, C., Emsley, R., Bishop, P. N., Cruickshanks, K. J., Edmundson-Jones, M., …. Munro, K. (2014). Vision impairment and dual sensory problems in middle age. Ophthalmic Physiological Optics, 34, 479–488. https://doi.org/10.1111/opo.12138479 ↵
- American Psychological Association (2016). By the numbers: Hearing loss and mental health. Monitor on Psychology, 47(4), 9. ↵
- Füllgrabe, C., Moore, B. C. J., & Stone, M. A. (2015). Age-group differences in speech identification despite matched audio metrically normal hearing: contributions from auditory temporal processing and cognition. Frontiers in Aging Neuroscience, 6, 1-25. https://doi.org/10.3389/fnagi.2014.00347 ↵
- Neidleman, M. T., Wambacq, I., Besing, J., Spitzer, J. B., & Koehnke, J. (2015). The Effect of Background Babble on Working Memory in Young and Middle-Aged Adults. Journal of the American Academy of Audiology, 26(3), 220-228. https://doi.org/10.3766/jaaa.26.3.3 ↵
- Humes, L. E., Kewley-Port, D., Fogerty, D., & Kinney, D. (2010). Measures of hearing threshold and temporal processing across the adult lifespan. Hearing Research, 264(1/2), 30-40. https://doi.org/10.1016/j.heares.2009.09.010 ↵
- Uchida, Y., Nakashima, T., Ando, F., Niino, N., & Shimokata, H. (2003). Prevalence of Self-perceived Auditory Problems and their Relation to Audiometric Thresholds in a Middle-aged to Elderly Population. Acta Oto-Laryngologica, 123(5), 618 ↵

.svg)