
Psychosocial Development in Middle Adulthood
Diana Lang; Nick Cone; Martha Lally; Suzanne Valentine-French; and Ronnie Mather

In the popular imagination (and academic press) middle adulthood has been referenced in relation to a “mid-life crisis.” There is an emerging view that this may have been an overstatement—certainly, the evidence on which it is based has been seriously questioned. However, there is some support for the view that people do undertake a sort of emotional audit, reevaluate their priorities, and emerge with a slightly different orientation to emotional regulation and personal interaction in this time period. Why, and the mechanisms through which this change is affected, are a matter of some debate. We will examine the ideas of Erikson, Baltes, and Carstensen, and how they might inform a more nuanced understanding of this vital part of the lifespan.[1]
Psychosocial Development
What do you think is the happiest stage of life?[2] What about the saddest stages? Perhaps surprisingly, Blanchflower & Oswald[3] found that reported levels of unhappiness and depressive symptoms peak in the early 50s for men in the U.S., and interestingly, the late 30s for women. In Western Europe, minimum happiness is reported around the mid 40s for both men and women, albeit with some significant national differences. There is now a view that “older people” (50+) may be “happier” than younger people, despite some cognitive and functional losses. This is often referred to as “the paradox of aging.” Positive attitudes to the continuance of cognitive and behavioral activities, interpersonal engagement, and their vitalizing effect on human neural plasticity, may lead not only to more life, but to an extended period of both self-satisfaction and continued communal engagement.
Erikson’s Theory
As you know by now, Erikson’s theory is based on an idea called epigenesis, meaning that development is progressive and that each individual must pass through the eight different stages of life—all while being influenced by context and environment. Each stage forms the basis for the following stage, and each transition to the next is marked by a crisis which must be resolved. The sense of self, each “season”, was wrested, from and by, that conflict. The ages 40-65 are no different. The individual is still driven to engage productively, but the nurturing of children and income generation assume lesser functional importance. From where will the individual derive their sense of self and self-worth?
Generativity versus Stagnation is Erikson’s characterization of the fundamental conflict of adulthood. It is the seventh conflict of his famous “8 seasons of man” (1950) and negotiating this conflict results in the virtue of care. Generativity is “primarily the concern in establishing and guiding the next generation.”[4] Generativity is a concern for a generalized other (as well as those close to an individual) and occurs when a person can shift their energy to care for and mentor the next generation. One obvious motive for this generative thinking might be parenthood, but others have suggested intimations of mortality by the self. John Kotre[5] theorized that generativity is a selfish act, stating that its fundamental task was to outlive the self. He viewed generativity as a form of investment. This form of investment can often be seen through volunteering. However, a commitment to a “belief in the species” can be taken in numerous directions, and it is probably correct to say that most modern treatments of generativity treat it as collection of facets or aspects—encompassing creativity, productivity, commitment, interpersonal care, and so on.
On the other side of generativity is stagnation. It is the feeling of lethargy and a lack of enthusiasm and involvement in both individual and communal affairs. It may also denote an underdeveloped sense of self, or some form of overblown narcissism. Erikson sometimes used the word “rejectivity” when referring to severe stagnation.
Try It
The Stage-Crisis View and the Midlife Crisis
In 1977, Daniel Levinson published an extremely influential article that would be seminal in establishing the idea of a profound crisis which lies at the heart of middle adulthood. The concept of a midlife crisis is so pervasive that over 90% of Americans are familiar with the term, although those who actually report experiencing such a crisis is significantly lower.[6]
Levinson based his findings about a midlife crisis on biographical interviews with a limited sample of 40 men (no women!), and an entirely American sample at that (Figure 1). Despite these severe methodological limitations, his findings proved immensely influential. Levinson[7] identified five main stages or “seasons” of a man’s life as follows:
- Preadulthood: Ages 0-22 (with 17 – 22 being the Early Adult Transition years)
- Early Adulthood: Ages 17-45 (with 40 – 45 being the Midlife Transition years)
- Middle Adulthood: Ages 40-65 (with 60-65 being the Late Adult Transition years)
- Late Adulthood: Ages 60-85
- Late Late Adulthood: Ages 85+

Levinson’s theory is known as the stage-crisis view. He argued that each stage overlaps, consisting of two distinct phases—a stable phase, and a transitional phase into the following period. The latter phase can involve questioning and change, and Levinson believed that 40-45 was a period of profound change, which could only culminate in a reappraisal, or perhaps reaffirmation, of goals, commitments and previous choices—a time for taking stock and recalibrating what was important in life. Crucially, Levinson would argue that a much wider range of factors, involving, primarily, work and family, would affect this taking stock – what he had achieved, what he had not; what he thought important, but had brought only a limited satisfaction.
In 1996, two years after his death, the study he was conducting with his co-author and wife Judy Levinson, was published on “the seasons of life” as experienced by women. Again, it was a small-scale study, with 45 women who were professionals, academics, and homemakers, in equal proportion. The changing place of women in society was reckoned by Levinson to be a profound moment in the social evolution of the human species, however, it had led to a fundamental polarity in the way that women formed and understood their social identity. Levinson referred to this as the “dream.” For men, the “dream” was formed in the age period of 22-28, and largely centered on the occupational role and professional ambitions. Levinson understood the female “dream” as fundamentally split between this work-centered orientation, and the desire/imperative of marriage/family; a polarity that heralded both new opportunities, and fundamental angst.
Levinson found that the men and women he interviewed sometimes had difficulty reconciling the “dream” they held about the future with the reality they currently experienced. “What do I really get from and give to my wife, children, friends, work, community-and self?” a man might ask.[8] Tasks of the midlife transition include:
- ending early adulthood;
- reassessing life in the present and making modifications if needed; and
- reconciling “polarities” or contradictions in one’s sense of self.
Perhaps early adulthood ends when a person no longer seeks adult status but feels like a full adult in the eyes of others. This “permission” may lead to different choices in life—choices that are made for self-fulfillment instead of social acceptance. While people in their 20s may emphasize how old they are (to gain respect, to be viewed as experienced), by the time people reach their 40s, they tend to emphasize how young they are (few 40-year-olds cut each other down for being so young: “You’re only 43? I’m 48!!”).
This new perspective on time brings about a new sense of urgency to life. The person becomes focused more on the present than the future or the past. The person grows impatient at being in the “waiting room of life,” postponing doing the things they have always wanted to do. “If it’s ever going to happen, it better happen now.” A previous focus on the future gives way to an emphasis on the present. Neugarten[9] notes that in midlife, people no longer think of their lives in terms of how long they have lived. Rather, life is thought of in terms of how many years are left. If an adult is not satisfied at midlife, there is a new sense of urgency to start to make changes now.
Changes may involve ending a relationship or modifying one’s expectations of a partner. These modifications are easier than changing the self.[10] Midlife is a period of transition in which one holds earlier images of the self while forming new ideas about the self of the future. A greater awareness of aging accompanies feelings of youth, and harm that may have been done previously in relationships haunts new dreams of contributing to the well-being of others. These polarities are the quieter struggles that continue after outward signs of “crisis” have gone away.
Levinson characterized midlife as a time of developmental crisis. However, like any body of work, it has been subject to criticism. Firstly, the sample size of the populations on which he based his primary findings is too small. By what right do we generalize findings from interviews with 40 men and 45 women, however thoughtful and well conducted? Secondly, Chiriboga[11] could not find any substantial evidence of a midlife crisis, and it might be argued that this, and further failed attempts at replication, indicate a cohort effect. The findings from Levinson’s population indicated a shared historical and cultural situatedness, rather than a cross-cultural universal experience by all or even most individuals. Midlife is a time of revaluation and change, that may escape precise determination in both time and geographical space, but people do emerge from it, and seem to enjoy a period of contentment, reconciliation, and acceptance of self.
This video explains the research and controversy surrounding the concept of a midlife crisis.
You can view the transcript for “Does Everyone Have a ‘Midlife Crisis’?” here (opens in new window).
Try It
Socio-Emotional Selectivity Theory (SST)
It is the inescapable fate of human beings to know that their lives are limited. As people move through life, goals and values tend to shift. What we consider priorities, goals, and aspirations are subject to renegotiation. Attachments to others, current and future, are no different. Time is not the unlimited good as perceived by a child under normal social circumstances; it is very much a valuable commodity, requiring careful consideration in terms of the investment of resources. This has become known in the academic literature as mortality salience.
Mortality salience posits that reminders about death or finitude (at either a conscious or subconscious level), fills us with dread. We seek to deny its reality, but awareness of the increasing nearness of death can have a potent effect on human judgement and behavior. This has become a very important concept in contemporary social science. It is with this understanding that Laura Carstensen developed the theory of socioemotional selectivity theory, or SST. The theory maintains that as time horizons shrink, as they typically do with age, people become increasingly selective, investing greater resources in emotionally meaningful goals and activities. According to the theory, motivational shifts also influence cognitive processing. Aging is associated with a relative preference for positive over negative information. This selective narrowing of social interaction maximizes positive emotional experiences and minimizes emotional risks as individuals become older. They systematically hone their social networks so that available social partners satisfy their emotional needs. An adaptive way of maintaining a positive affect might be to reduce contact with those we know may negatively affect us, and avoid those who might.
SST is a theory which emphasizes a time perspective rather than chronological age. When people perceive their future as open ended, they tend to focus on future-oriented development or knowledge-related goals. When they feel that time is running out, and the opportunity to reap rewards from future-oriented goals’ realization is dwindling, their focus tends to shift towards present-oriented and emotion or pleasure-related goals. Research on this theory often compares age groups (e.g., young adulthood vs. old adulthood), but the shift in goal priorities is a gradual process that begins in early adulthood. Importantly, the theory contends that the cause of these goal shifts is not age itself, i.e., not the passage of time itself, but rather an age-associated shift in time perspective. The theory also focuses on the types of goals that individuals are motivated to achieve. Knowledge-related goals aim at knowledge acquisition, career planning, the development of new social relationships and other endeavors that will pay off in the future. Emotion-related goals are aimed at emotion regulation, the pursuit of emotionally gratifying interactions with social partners, and other pursuits whose benefits which can be realized in the present.
This shift in emphasis, from long term goals to short term emotional satisfaction, may help explain the previously noted “paradox of aging.” That is, that despite noticeable physiological declines, and some notable self-reports of reduced life-satisfaction around this time, post- 50 there seems to be a significant increase in reported subjective well-being. SST does not champion social isolation, which is harmful to human health, but shows that increased selectivity in human relationships, rather than abstinence, leads to more positive affect. Perhaps “midlife crisis and recovery” may be a more apt description of the 40-65 period of the lifespan.
Watch Laura Carstensen in this TED talk explain how happiness actually increases with age.
You can view the transcript for “Older people are happier – Laura Carstensen” here (opens in new window).

Selection, Optimization, Compensation (SOC)
Another perspective on aging was identified by German developmental psychologists Paul and Margret Baltes. Their text Successful Aging[12] marked a seismic shift in moving social science research on aging from largely a deficits-based perspective to a newer understanding based on a holistic view of the life-course itself. The former had tended to focus exclusively on what was lost during the aging process, rather than seeing it as a balance between those losses and gains in areas like the regulation of emotion, experience and wisdom.
The Baltes’ model for successful aging argues that across the lifespan, people face various opportunities or challenges such as, jobs, educational opportunities, and illnesses. According to the SOC model, a person may select particular goals or experiences, or circumstances might impose themselves on them. Either way, the selection process includes shifting or modifying goals based on choice or circumstance in response to those circumstances. The change in direction may occur at the subconscious level. This model emphasizes that setting goals and directing efforts towards a specific purpose is beneficial to healthy aging. Optimization is about making the best use of the resources we have in pursuing goals. Compensation, as its name suggests, is about using alternative strategies in attaining those goals.[13]
The processes of selection, optimization, and compensation can be found throughout the lifespan. As we progress in years, we select areas in which we place resources, hoping that this selection will optimize the resources that we have, and compensate for any defects accruing from physiological or cognitive changes. Previous accounts of aging had understated the degree to which possibilities from which we choose had been eliminated, rather than reduced, or even just changed. As we select areas in which to invest, there is always an opportunity cost. We are masters of our own destiny, and our own individual orientation to the SOC processes will dictate “successful aging.” Rather than seeing aging as a process of progressive disengagement from social and communal roles undertaken by a group, Baltes argued that “successful aging” was a matter of sustained individual engagement, accompanied by a belief in individual self-efficacy and mastery.
The SOC model covers a number of functional domains—motivation, emotion, and cognition. We might become more adept at playing the SOC game as time moves on, as we work to compensate and adjust for changing abilities across the lifespan. For example, a soccer a player at 35 may no longer have the vascular and muscular fitness that they had at 20 but her “reading” of the game might compensate for this decline. She may well be a better player than she was at 20, even with fewer physical resources in a game which ostensibly prioritizes them. The work of Paul and Margaret Baltes was very influential in the formation of a very broad developmental perspective which would coalesce around the central idea of resiliency.[14]
Try It
Stress
Social Relationships and Stress
Research has shown that the impact of social isolation on our risk for disease and death is similar in magnitude to the risk associated with smoking regularly.[15][16] In fact, the importance of social relationships for our health is so significant that some scientists believe our body has developed a physiological system that encourages us to seek out our relationships, especially in times of stress.[17] Social integration is the concept used to describe the number of social roles that you have.[18] For example, you might be a daughter, a basketball team member, a Humane Society volunteer, a coworker, and a student. Maintaining these different roles can improve your health via encouragement from those around you to maintain a healthy lifestyle. Those in your social network might also provide you with social support (e.g., when you are under stress). This support might include emotional help (e.g., a hug when you need it), tangible help (e.g., lending you money), or advice. By helping to improve health behaviors and reduce stress, social relationships can have a powerful, protective impact on health, and in some cases, might even help people with serious illnesses stay alive longer.[19]
Caregiving and stress
A disabled child, spouse, parent, or other family member is part of the lives of some midlife adults. According to the National Alliance for Caregiving[20], 40 million Americans provide unpaid caregiving. The typical caregiver is a 49 year-old female currently caring for a 69 year-old female who needs care because of a long-term physical condition. Looking more closely at the age of the recipient of caregiving, the typical caregiver for those 18-49 years of age is a female (61%) caring mostly for her own child (32%) followed by a spouse or partner (17%). When looking at older recipients (50+) who receive care, the typical caregiver is female (60%) caring for a parent (47%) or spouse (10%).
Caregiving places enormous stress on the caregiver. Caregiving for a young or adult child with special needs was associated with poorer global health and more physical symptoms among both fathers and mothers.[21] Marital relationships are also a factor in how the caring affects stress and chronic conditions. Fathers who were caregivers identified more chronic health conditions than non-caregiving fathers, regardless of marital quality. In contrast, caregiving mothers reported higher levels of chronic conditions when they reported a high level of marital strain.[22] Age can also make a difference in how one is affected by the stress of caring for a child with special needs. Using data from the Study of Midlife in the Unites States, Ha, Hong, Seltzer and Greenberg[23] found that older parents were significantly less likely to experience the negative effects of having a disabled child than younger parents. They concluded that an age-related weakening of the stress occurred over time. This follows with the greater emotional stability noted at midlife.
Currently 25% of adult children, mainly baby boomers, provide personal or financial care to a parent.[24] Daughters are more likely to provide basic care and sons are more likely to provide financial assistance. Adult children 50+ who work and provide care to a parent are more likely to have fair or poor health when compared to those who do not provide care. Some adult children choose to leave the work force, however, the cost of leaving the work force early to care for a parent is high. For females, lost wages and social security benefits equals $324,044, while for men it equals $283,716.[25] This loss can jeopardize the adult child’s financial future. Consequently, there is a need for greater workplace flexibility for working caregivers.
Spousal care
Certainly caring for a disabled spouse would be a difficult experience that could negatively affect one’s health. However, research indicates that there can be positive health effect for caring for a disabled spouse. Beach, Schulz, Yee and Jackson[26] evaluated health related outcomes in four groups: Spouses with no caregiving needed (Group 1), living with a disabled spouse but not providing care (Group 2), living with a disabled spouse and providing care (Group 3), and helping a disabled spouse while reporting caregiver strain, including elevated levels of emotional and physical stress (Group 4). Not surprisingly, the participants in Group 4 were the least healthy and identified poorer perceived health, an increase in health-risk behaviors, and an increase in anxiety and depression symptoms. However, those in Group 3 who provided care for a spouse, but did not identify caregiver strain, actually identified decreased levels of anxiety and depression compared to Group 2 and were actually similar to those in Group 1. It appears that greater caregiving involvement was related to better mental health as long as the caregiving spouse did not feel strain. The beneficial effects of helping identified by the participants were consistent with previous research.[27][28]
When caring for a disabled spouse, gender differences have also been identified. Female caregivers of a spouse with dementia experienced more burden, had poorer mental and physical health, exhibited increased depressive symptomatology, took part in fewer health- promoting activities, and received fewer hours of help than male caregivers.[29] This recent study was consistent with previous research findings that women experience more caregiving burden than men, despite similar caregiving situations.[30][31] Explanations for why women do not use more external support, which may alleviate some of the burden, include women’s expectations that they should assume caregiving roles[32] and their concerns with the opinions of others.[33] Also contributing to women’s poorer caregiving outcomes is that disabled males are more aggressive than females, especially males with dementia who display more physical and sexual aggression toward their caregivers.[34][35] Female caregivers are certainly at risk for negative consequences of caregiving, and greater support needs to be available to them.
Work at midlife
Who is the U.S. workforce? The civilian, non-institutionalized workforce; that is the population of those aged 16 and older, who are employed has steadily declined since it reached its peak in the late 1990s, when 67% of the civilian workforce population was employed. In 2012 the rate had dropped to 64% and has declined to 58% in 2021.[36] However, these should also be considered within the lens of the COVID-19 pandemic occurring in 2020. In 1992, 26% of the population was 55+, in 2019, 29.3% of the population is 55+, and by 2040 it is projected to be 32.6%.[37] Table 1 shows the rates of employment by age. In 2021, ~64% of the workforce was male. For both genders and age groups the rate of participation in the labor force has improved from 2011 to 2021.
|
2011 (Men) |
2021 (Men) |
2011 (Women) |
2021 (Women) |
|
|
16-19 |
24.6 |
31.4 |
27.1 |
32.6 |
|
20-24 |
63.0 |
65.9 |
58.7 |
63.0 |
|
25-34 |
80.5 |
82.5 |
67.1 |
72.1 |
|
35-44 |
84.2 |
85.5 |
69.3 |
71.2 |
|
45-54 |
79.8 |
83.0 |
70.4 |
71.9 |
|
55-59 |
72.8 |
74.6 |
63.6 |
63.9 |
|
60-64 |
54.7 |
60.2 |
47.2 |
49.6 |
|
Totals |
63.9 |
63.9 |
53.2 |
53.2 |
*Adapted from (adapted from Monthly Labor Review).[38]
Hispanic males have the highest rate of participation in the labor force. In 2021, 70.5% of Hispanic males, compared with 58.6% of White, 68.3% of Asian, and 57.7% of Black men ages 16 or older were employed. Among women, Black women were more likely to be participating in the workforce, 54.1%, compared with 53.9% of Asian, 52.8% of White, and 51.8% of Hispanic females. [39]
Climate in the workplace for middle-aged adults
A number of studies have found that job satisfaction tends to peak in middle adulthood.[40][41] This satisfaction stems from not only higher wages, but often greater involvement in decisions that affect the workplace as they move from worker to supervisor or manager. Job satisfaction is also influenced by being able to do the job well, and after years of experience at a job many people are more effective and productive. Another reason for this peak in job satisfaction is that at midlife many adults lower their expectations and goals.[42] Middle-aged employees may realize they have reached the highest they are likely to in their career. This satisfaction at work translates into lower absenteeism, greater productivity, and less job hopping in comparison to younger adults.[43]
However, not all middle-aged adults are happy in the workplace. Women may find themselves up against the glass ceiling, organizational discrimination in the workplace that limits the career advancement of women. This may explain why females employed at large corporations are twice as likely to quit their jobs as are men.[44] Another problem older workers may encounter is job burnout, becoming disillusioned and frustrated at work. American workers may experience more burnout than do workers in many other developed nations because most developed nations guarantee by law a set number of paid vacation days[45], the United States does not.[46]
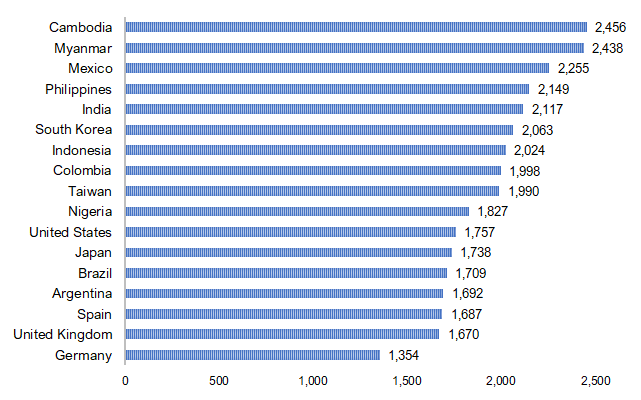
Not all employees are covered under overtime pay laws.[47] This is important when you considered that the 40-hour work week is a myth for most Americans. Only 4 in 10 U.S. workers work the typical 40-hour work week. The average work week for many is almost a full day longer (47 hours), with 39% working 50 or more hours per week.[48] In comparison to workers in many other developed nations, American workers work more hours per year.[49] As can be seen in Figure 3, Americans work more hours than most European nations, especially in western and northern Europe, although they work fewer hours than workers in other nations, especially Cambodia and Mexico.
Challenges in the workplace for middle-aged adults
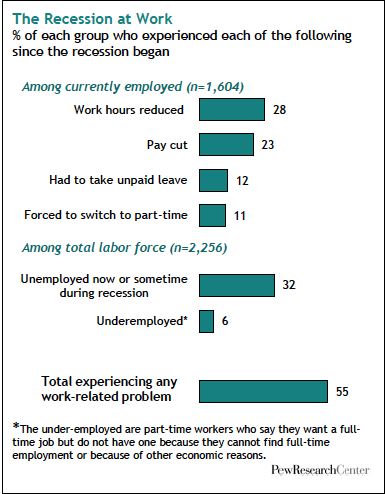
In recent years middle-aged adults have been challenged by economic downturns, starting in 2001, and again in 2008. Fifty-five percent of adults reported some problems in the workplace, such as fewer hours, pay cuts, having to switch to part-time, etc., during the most recent economic recession (see Figure 4).[50] While young adults took the biggest hit in terms of levels of unemployment, middle-aged adults also saw their overall financial resources suffer as their retirement nest eggs disappeared and house values shrank, while foreclosures increased.[51]
Not surprisingly, this age group reported that the recession hit them worse than did other age groups, especially those aged 50-64. Middle-aged adults who find themselves unemployed are likely to remain unemployed longer than those in early adulthood.[52] In the eyes of employers, it may be more cost-effective to hire a young adult, despite their limited experience, as they would be starting out at lower levels of the pay scale. In addition, hiring someone who is 25 and has many years of work ahead of them versus someone who is 55 and will likely retire in 10 years may also be part of the decision to hire a younger worker.[53] American workers are also competing with global markets and changes in technology. Those who are able to keep up with all these changes, or are willing to uproot and move around the country or even the world have a better chance of finding work. The decision to move may be easier for people who are younger and have fewer obligations to others.
Leisure
As most developed nations restrict the number of hours an employer can demand that an employee work per week, and require employers to offer paid vacation time, what do middle-aged adults do with their time off from work and duties, referred to as leisure? Around the world, the most common leisure activity in both early and middle adulthood is watching television.[54] On average, middle-aged adults spend 2-3 hours per day watching TV[55] and watching TV accounts for more than half of all leisure time.
In the United States, men spend about 5 hours more per week in leisure activities, especially on weekends, than do women.[56][57] The leisure gap between mothers and fathers is slightly smaller, about 3 hours a week, than among those without children under age 18.[58] Those age 35-44 spend less time on leisure activities than any other age group, 15 or older.[59] This is not surprising as this age group are more likely to be parents and still working up the ladder of their career, so they may feel they have less time for leisure.
Americans have less leisure time than people in many other developed nations. As you read earlier, there are no laws in many job sectors guaranteeing paid vacation time in the United States. Ray, Sanes and Schmitt[60] report that several other nations also provide additional time off for young and older workers and for shift workers. In the United States, those in higher-paying jobs and jobs covered by a union contract are more likely to have paid vacation time and holidays.[61]
Do U.S. workers take their time off?
According to Project Time-Off,[62] 55% of U.S. workers in 2015 did not take all of their paid vacation and holiday leave. A large percentage of this leave is lost. It cannot be rolled over into the next year or paid out. A total of 658 million vacation days, or an average of 2 vacation days per worker was lost in 2015. The reasons most often given for not taking time off was worry that there would be a mountain of work to return to (40%), concern that no one else could do the job (35%), not being able to afford a vacation (33%), feeling it was harder to take time away when you have or are moving up in the company (33%), and not wanting to seem replaceable (22%). Since 2000, more American workers are willing to work for free rather than take the time that is allowed to them. A lack of support from their boss and even their colleagues to take a vacation is often a driving force in deciding to forgo time off. In fact, 80% of the respondents to the survey above said they would take time away if they felt they had support from their boss. Two-thirds reported that they hear nothing, mixed messages, or discouraging remarks about taking their time off. Almost a third (31%) feel they should contact their workplace, even while on vacation.
Benefits of taking time away from work
Several studies have noted the benefits of taking time away from work. It reduces job stress burnout,[63] improves both mental health[64] and physical health,[65] especially if that leisure time also includes moderate physical activity.[66] Leisure activities can also improve productivity and job satisfaction[67] and help adults deal with balancing family and work obligations.[68]
There are many socioemotional changes that occur in how middle-aged adults perceive themselves. While people in their early 20s may emphasize how old they are to gain respect or to be viewed as experienced, by the time people reach their 40s they tend to emphasize how young they are. For instance, few 40-year-olds cut each other down for being so young stating: “You’re only 43? I’m 48!” A previous focus on the future gives way to an emphasis on the present. Neugarten[69] notes that in midlife, people no longer think of their lives in terms of how long they have lived. Rather, life is thought of in terms of how many years are left.
- This chapter was adapted from select chapters in Lumen Learning's Lifespan Development, authored by Martha Lally and Suzanne Valentine-French available under a Creative Commons Attribution-NonCommercial-ShareAlike license, and Waymaker Lifespan Development, authored by Ronnie Mather for Lumen Learning and available under a Creative Commons Attribution license. Some selections from Lumen Learning were adapted from previously shared content from Laura Overstreet's Lifespan Psychology and Wikipedia. ↵
- This section, Psychosocial Development, is adapted from Lifespan Development by Ronnie Mather for Lumen Learning, and licensed under a Creative Commons ShareAlike License. Selections from the content were originally taken from LifeSpan Psychology by Laura Overstreet and Wikipedia's article on socioemotional selectivity theory. ↵
- Blanchflower, D. G., & Oswald, A. J. (2008, April).Is well-being U-shaped over the life cycle? https://www.ncbi.nlm.nih.gov/pubmed/18316146 ↵
- Erikson, E. (1950). Childhood and society. p.267. New York: Norton & Company. ↵
- Kotre, J. (1985). Outliving the self: Generativity and the interpretation of lives. Johns Hopkins University Press. ↵
- Wethington, E. (2000). Expecting stress: Americans and the “midlife crisis.” Motivation and Emotion, 24(2), 85–103. https://doi.org/10.1023/a:1005611230993 ↵
- Levinson, D. J. (1986). A conception of adult development. American Psychologist, 41(1), 3–13. https://doi.org/10.1037/0003-066X.41.1.3 ↵
- Levinson, D. J. (1978). The seasons of a man’s life. p. 192. New York: Knopf. ↵
- Neugarten, B. L. (1968). The awareness of middle aging. In B. L. Neugarten (Ed.), Middle age and aging (pp. 93-98). Chicago: University of Chicago Press. ↵
- Levinson, D. J. (1978). The seasons of a man’s life. New York: Knopf. ↵
- Chiriboga, D. A. (1989). Mental health at the midpoint: Crisis, challenge, or relief? In S. Hunter & M. Sundel (Eds.), Midlife myths: Issues, findings, and practice implications (pp. 116–144). Sage Publications, Inc. ↵
- Baltes, P.B. and Baltes, M. (1990). Successful Aging: Perspectives from the Behavioral Sciences. Cambridge: University Press. ↵
- Stephanie, R., Margie, L., & Elizabeth, R. (2015). Self-Regulatory Strategies in Daily Life: Selection, Optimization, and Compensation and Everyday Memory Problems. International Journal of Behavioral Development, 40(2), 126-136. ↵
- Weiss, L. A., Westerhof, G. J., & Bohlmeijer, E. T. (2016). Can we increase psychological well-being? The effects of interventions on psychological well-being: A meta-analysis of randomized controlled trials. PloS One, 11(6), e0158092. https://doi.org/10.1371/journal.pone.0158092 ↵
- Holt-Lunstad, J., Smith, T. B., & Layton, J. B. (2010). Social relationships and mortality risk: a meta-analytic review. PLoS Medicine, 7(7), e1000316. ↵
- House, J. S., Landis, K. R., & Umberson, D. (1988). Social relationships and health. Science, 241, 540–545 ↵
- Taylor, S. E., Klein, L. C., Lewis, B. P., Gruenewald, T. L., Gurung, R. A., & Updegraff, J. A. (2000). Biobehavioral responses to stress in females: Tend-and-befriend, not fight-or-flight. Psychological Review, 107, 411–429. ↵
- Cohen, S., & Wills, T. A. (1985). Stress, social support, and the buffering hypothesis. Psychological Bulletin, 98, 310–357. ↵
- Spiegel, D., Kraemer, H., Bloom, J., & Gottheil, E. (1989). Effect of psychosocial treatment on survival of patients with metastatic breast cancer. The Lancet, 334, 888–891. ↵
- National Alliance for Caregiving. (2015). Caregiving in the U.S. 2015. http://www.caregiving.org/caregiving2015. ↵
- Seltzer, M. M., Floyd, F., Song, J., Greenberg, J., & Hong, J. (2011). Midlife and aging parents of adults with intellectual and developmental disabilities: Impacts of lifelong parenting. American Association on Intellectual and Developmental Disability, 116, 479-499. ↵
- Kang, S. W., & Marks, N. F. (2014). Parental caregiving for a child with special needs, marital strain, and physical health: Evidence from National Survey of Midlife in the U.S. 2005. Contemporary Perspectives in Family Research, 8A, 183- 209. ↵
- Ha, J., Hong, J., Seltzer, M. M., & Greenberg, J. S. (2008). Age and gender differences in the well-being of midlife and aging parents with children with mental health or developmental problems: Report of a national study. Journal of Health and Social Behavior, 49, 301-316. ↵
- Metlife. (2011). Metlife study of caregiving costs to working caregivers: Double jeopardy for baby boomers caring for their parents. http://www.caregiving.org/wp-content/uploads/2011/06/mmi-caregiving-costs-working- caregivers.pdf ↵
- Metlife. (2011). Metlife study of caregiving costs to working caregivers: Double jeopardy for baby boomers caring for their parents. http://www.caregiving.org/wp-content/uploads/2011/06/mmi-caregiving-costs-working- caregivers.pdf ↵
- Beach, S. R., Schulz, R., Yee, J. L., & Jackson, S. (2000). Negative and positive health effects of caring for a disabled spouse: Longitudinal findings from the caregiver health effects study. Psychology and Aging, 15(2), 259-271. ↵
- Krause, N. A., Herzog, R., & Baker, E. (1992). Providing support to others and well-being in later life. Journal of Gerontology: Psychological Sciences, 47, P300-311. ↵
- Schulz, R., Newsom, J., Mittelmark, M., Burton, L., Hirsch, C., & Jackson, S. (1997). Health effects of caregiving: The caregiver health effects study: An ancillary study of the Cardiovascular Health Study. Annals of Behavioral Medicine, 19, 110- 116. ↵
- Gibbons, C., Creese, J., Tran, M., Brazil, K., Chambers, L., Weaver, B., & Bedard, M. (2014). The psychological and health consequences of caring for a spouse with dementia: A critical comparison of husbands and wives. Journal of Women & Aging, 26, 3-21. ↵
- Torti, F. M., Gwyther, L. P., Reed, S. D., Friedman, J. Y., & Schulman, K. A. (2004). A multinational review of recent trends and reports in dementia caregiver burden. Alzheimer Disease and Associated Disorders, 18(2), 99-109. ↵
- Yeager, C. A., Hyer, L. A., Hobbs, B., & Coyne, A. C., (2010). Alzheimer’s disease and vascular dementia: The complex relationship between diagnosis and caregiver burden. Issues in Mental Health Nursing, 31(6), 376-384. ↵
- Torti, F. M., Gwyther, L. P., Reed, S. D., Friedman, J. Y., & Schulman, K. A. (2004). A multinational review of recent trends and reports in dementia caregiver burden. Alzheimer Disease and Associated Disorders, 18(2), 99-109. ↵
- Arai, Y., Sugiura, M., Miura, H., Washio, M., & Kudo, K. (2000). Undue concern for other’s opinions deters caregivers of impaired elderly from using public services in rural Japan. International Journal of Geriatric Psychiatry, 15(10), 961- 968. ↵
- Eastley, R., & Wilcock, G. K. (1997). Prevalence and correlates of aggressive behaviors occurring in patients with Alzheimer’s disease. International Journal of Geriatric Psychiatry, 12, 484-487. ↵
- Zuidema, S. U., de Jonghe, J. F., Verhey, F. R., & Koopman, R. T. (2009). Predictors of neuropsychiatric symptoms in nursing home patients: Influence of gender and dementia severity. International Journal of Geriatric Psychiatry, 24(10), 1079-1086. ↵
- Monthly Labor Review. (2021). Percentage of the non-institutionalized civilian workforce employed by gender & age. https://www.bls.gov/cps/tables.htm#otheryears ↵
- U.S. Census Bureau, Population Division. (2017). Projected 5-Year Age Groups and Sex Composition: Main Projections Series for the United States, 2017-2060. https://www.census.gov/data/tables/2017/demo/popproj/2017-summary-tables.html ↵
- Monthly Labor Review. (2021). Percentage of the non-institutionalized civilian workforce employed by gender & age. https://www.bls.gov/cps/tables.htm#otheryears ↵
- Monthly Labor Review. (2021). Percentage of the non-institutionalized civilian workforce employed by gender & age. https://www.bls.gov/cps/tables.htm#otheryears ↵
- Besen, E., Matz-Costa, C., Brown, M., Smyer, M. A., & Pitt-Catsouphers, M. (2013). Job characteristics, core self-evaluations, and job satisfaction. International Journal of Aging & Human Development, 76(4), 269-295. ↵
- Easterlin, R. A. (2006). Life cycle happiness and its sources: Intersections of psychology, economics, and demography. Journal of Economic Psychology, 27, 463-482. ↵
- Tangri, S., Thomas, V., & Mednick, M. (2003). Prediction of satisfaction among college-educated African American women. Journal of Adult Development, 10, 113-125. ↵
- Easterlin, R. A. (2006). Life cycle happiness and its sources: Intersections of psychology, economics, and demography. Journal of Economic Psychology, 27, 463-482. ↵
- Barreto, M., Ryan, M. K., & Schmitt, M. T. (2009). The glass ceiling in the 21st century: Understanding the barriers to gender equality. Washington, DC: American Psychological Association. ↵
- International Labour Organization. (2011). Global Employment Trends: 2011. http://www.ilo.org/wcmsp5/groups/public/@dgreports/@dcomm/@publ/documents/publication/wcms_150440.pdf ↵
- U.S. Department of Labor (2016). Vacation Leave. https://www.dol.gov/general/topic/workhours/vacation_leave ↵
- U.S. Department of Labor (2016). Vacation Leave. https://www.dol.gov/general/topic/workhours/vacation_leave ↵
- Saad, L. (2014). The 40-hour work week is actually longer – by 7 hours. Gallop. http://www.gallup.com/poll/175286/hour-workweek-actually-longer-seven-hours.aspx ↵
- Organisation for Economic Cooperation and Development. (2016). Average annual hours actually worked per worker. OECD Stat. Retrieved from http://stats.oecd.org/Index.aspx?DataSetCode=ANHRS ↵
- Pew Research Center. (2010a). How the great recession has changed life in America. http://www.pewsocialtrends.org/2010/06/30/how-the-great-recession-has-changed-life-in-america/ ↵
- Pew Research Center. (2010b). Section 5: Generations and the Great Recession. http://www.people- press.org/2011/11/03/section-5-generations-and-the-great-recession/ ↵
- U.S. Government Accountability Office. (2012). Unemployed older workers: Many experience challenges regaining employment and face reduced retirement security. http://www.gao.gov/products/GAO-12-445 ↵
- Lachman, M. E. (2004). Development in Midlife. Annual Review of Psychology, 55(1), 305-331. https://doi.org/10.1146/annurev.psych.55.090902.141521 ↵
- Marketing Charts Staff. (2014). Are young people watching less TV? http://www.marketingcharts.com/television/are-young-people-watching-less-tv-24817/ ↵
- Gripsrud, J. (2007). Television and the European public sphere. European Journal of Communication, 22, 479-492. ↵
- Drake, B. (2013). Another gender gap: Men spend more time in leisure activities. Pew Research Center. http://www.pewresearch.org/fact-tank/2013/06/10/another-gender-gap-men-spend-more-time-in-leisure-activities/ ↵
- U.S. Bureau of Labor Statistics (2016). American time use survey – 2015. Retrieved from http://www.bls.gov/news.release/pdf/atus.pdf ↵
- Drake, B. (2013). Another gender gap: Men spend more time in leisure activities. Pew Research Center. http://www.pewresearch.org/fact-tank/2013/06/10/another-gender-gap-men-spend-more-time-in-leisure-activities/ ↵
- U.S. Bureau of Labor Statistics (2016). American time use survey – 2015. http://www.bls.gov/news.release/pdf/atus.pdf ↵
- Ray, R., Sanes, M., & Schmitt, J. (2013). No-vacation nation revisited. Center for Economic Policy Research. http://cepr.net/publications/reports/no-vacation-nation-2013 ↵
- Ray, R., & Schmitt, J. (2007). No vacation nation USA: A comparison of leave and holiday in OECD countries. http://www.law.harvard.edu/programs/lwp/papers/No_Holidays.pdf ↵
- Project Time-Off (2016). The state of American vacation: How vacation became a casualty of our work culture. http://www.projecttimeoff.com/research/state-american-vacation-2016 ↵
- Nimrod, G., Kleiber, D. A., & Berdychevesky, L. (2012). Leisure in coping with depression. Journal of Leisure Research, 44(4), 414-449. ↵
- Qian, X., Yarnal, C. M., Almeida, D. M. (2013). Does leisure time as a stress coping source increase affective complexity? Applying the Dynamic Model of Affect (DMA). Journal of Leisure Research, 45(3), 393-414. ↵
- Stern, C., & Konno, R. (2009). Physical Leisure activities and their role in preventing dementia: A systematic review. International Journal of Evidence-Based Healthcare, 7, 270-282. ↵
- Lee, B., Lawson, K. M., Chang, P., Neuendorf, C., Dmitrieva, N. O., & Ameida, D. H. (2015). Leisure-time physical activity moderates the longitudinal associations between work-family spillover and physical health. Journal of Leisure Research, 47(4), 444-466. ↵
- Kühnel, J., & Sonnentag, S. (2011). How long do you benefit from vacation? A closer look at the fade-out vacation effects. Journal of Organizational Behavior, 32, 125-143. ↵
- Lee, B., Lawson, K. M., Chang, P., Neuendorf, C., Dmitrieva, N. O., & Ameida, D. H. (2015). Leisure-time physical activity moderates the longitudinal associations between work-family spillover and physical health. Journal of Leisure Research, 47(4), 444-466. ↵
- Neugarten, B. L. (1968). The awareness of middle aging. In B. L. Neugarten (Ed.), Middle age and aging (pp. 93-98). Chicago: University of Chicago Press. ↵
