
Understanding Death
Diana Lang; Nick Cone; Martha Lally; Suzanne Valentine-French; and Sarah Carter

While death has always been a universal component in the human experience, its prevalence and circumstances have changed over the years. Today, we associate death with the elderly, but looking back even one hundred years ago, death was more common among children and in various age ranges.[1] At that time, it was not uncommon for American families to lose a child during childbirth or infancy. Today less than 10% of all deaths worldwide occur to children under the age of 5, but as recently as 1990, that number was nearly 25%.[2]
The graph above shows data from 2016 (Figure 1), which reveal that nearly half of the 55 million global deaths occurred to those aged 70 years or older. There is still a great amount of disparity in death statistics based on location and access to medical care. In the United States, for example, deaths in that same age group of 70 years old or older accounted for 65% of total deaths. In this section, we’ll look more closely at the leading causes of deaths in the United States and throughout the globe.
Death Defined
According to the Uniform Determination of Death Act (UDDA),[3] death is defined clinically as the following:
An individual who has sustained either (1) irreversible cessation of circulatory and respiratory functions, or (2) irreversible cessation of all functions of the entire brain, including the brain stem, is dead. A determination of death must be made in accordance with accepted medical standards.
The UDDA was approved for the United States in 1980 by a committee of national commissioners, the American Medical Association, the American Bar Association, and the President’s Commission on Medical Ethics. This act has since been adopted by most states and provides a comprehensive and medically factual basis for determining death in all situations.
Causes of Death in the United States
In 1900, the most common causes of death were infectious diseases, which brought death quickly. Due to advances in healthcare and medicine over the years, this has changed, alongside an increase in average life expectancy. According to national data, chronic diseases, or those in which a slow and steady decline causes health deterioration, were the most common causes of death in the United States in 2016[4] In addition, accidents were more common than in previous years, often resulting in quick or unexpected death. How might this impact the way we think of death, the way we grieve, and the amount of control a person has over his or her own dying process, in comparison to the infectious diseases that were prevalent in 1900?
The 10 leading causes of death and number of deaths per category in 2018 and 2019 in the United States are listed below.[5]
| Rank | Cause of Death | Percentage of total deaths 2019 | Percentage of total deaths 2018 |
|---|---|---|---|
| 1 | Heart disease | 23.1 | 23.1 |
| 2 | Cancer | 21.0 | 21.1 |
| 3 | Accidents | 6.1 | 5.9 |
| 4 | Chronic lower respiratory diseases | 5.5 | 5.6 |
| 5 | Cerebrovascular diseases | 5.3 | 5.2 |
| 6 | Alzheimer’s Disease | 4.3 | 4.3 |
| 7 | Diabetes | 3.1 | 3.0 |
| 8 | Nephritis, nephrotic syndrome and nephrosis | 1.8 | 1.8 |
| 9 | Influenza and Pneumonia | 1.7 | 2.1 |
| 10 | Suicide | 1.7 | 1.7 |
All of these top causes of death, with the exception of two—accidents and suicides—continue to be related to physical illnesses. Many are linked at least in part to lifestyle choices, including diet, exercise, and substance abuse. Similarly, many are preventable, to some extent, and some are avoidable if the proper actions are taken. Although these causes of death remain very similar to what they were in 2004, the order has changed for several of them by 2019/2018. For example, accidents and unintentional injuries shifted from #5 in 2004 to #3 in 2019. Suicide moved from #11 to #10. In contrast, strokes became slightly less common, moving from #3 to #5, along with diabetes, which moved from #6 to #7. Septicemia (blood disease) followed a similar trend, shifting from #10 to #11. These changes are likely attributable to a variety of factors, including lifestyle choices, social pressures and norms, and changes in responsibilities and obligations.
Deadliest Diseases Worldwide
The top 10 deadliest diseases in the world from 2020 are listed below, along with the percentage of deaths for which they were accountable. These reflect disease-related deaths only, and do not reflect deaths due to violence or suicide.[7] Notice there are several similarities between these and the top 10 causes of death in the United States described above.
- Ischaemic heart disease 13.2%
- Stroke 10.7%
- Neonatal conditions 6.2%
- Lower respiratory infections 6.0%
- Chronic obstructive pulmonary disease 5.8%
- Diarrhoeal diseases 5.2%
- Tuberculosis 3.4%
- HIV/AIDS 2.7%
- Trachea, bronchus, lung cancers 2.4%
- Road injury 2.3%
Similar to the top 10 general causes of death listed above, these remained fairly consistent over the years, despite increases and decreases in each. Deaths caused by heart disease, for example, from 2000 to 2019 increased by 2.1 million, and deaths caused by stroke increased by .7 million.[8] Lung disorders and cancers also rose by .6 million deaths, while diabetes rose by .7 million. Alzheimer’s disease and other forms of dementia also accounted for an additional 1 million deaths. Decreases were seen in lower respiratory infections, which decreased by .4 million, as well as dehydration due to diarrheal diseases, which decreased by 1.1 million. Furthermore, tuberculosis deaths decreased by 1 million, and cirrhosis deaths decreased by .5 million.
While the top 10 causes of death presented previously were only for the United States, these top 10 deadliest diseases are for the entire world, including both developed and undeveloped nations. Differences in various factors including but not limited to economic status, access to medical care, belief systems, and natural resources play a major role in many of these causes of death, and tend to vary substantially between countries. This presents challenges for the interpretation of this list, making it difficult to determine the true prevalence of each in specific locations.
Watch this video to learn about another way to measure and compare life expectancies, known as years of life lost, which measures how many years short of the life expectancy people die. Looking at these data reveals some of the leading causes of death across the globe.
You can view the transcript for “The #1 reason people die early, in each country” here (opens in new window).
A Comparison of Death by Age in the United States
The major causes of death vary significantly among age groups. As you can see in Figure 2, congenital diseases and accidents are major causes of death among children, then accidents and suicides are the leading causes of death between ages 10 and 24. This changes again in middle and late-adulthood, as heart disease and cancer combined cause over 50% of deaths for those aged between 45 and 65.
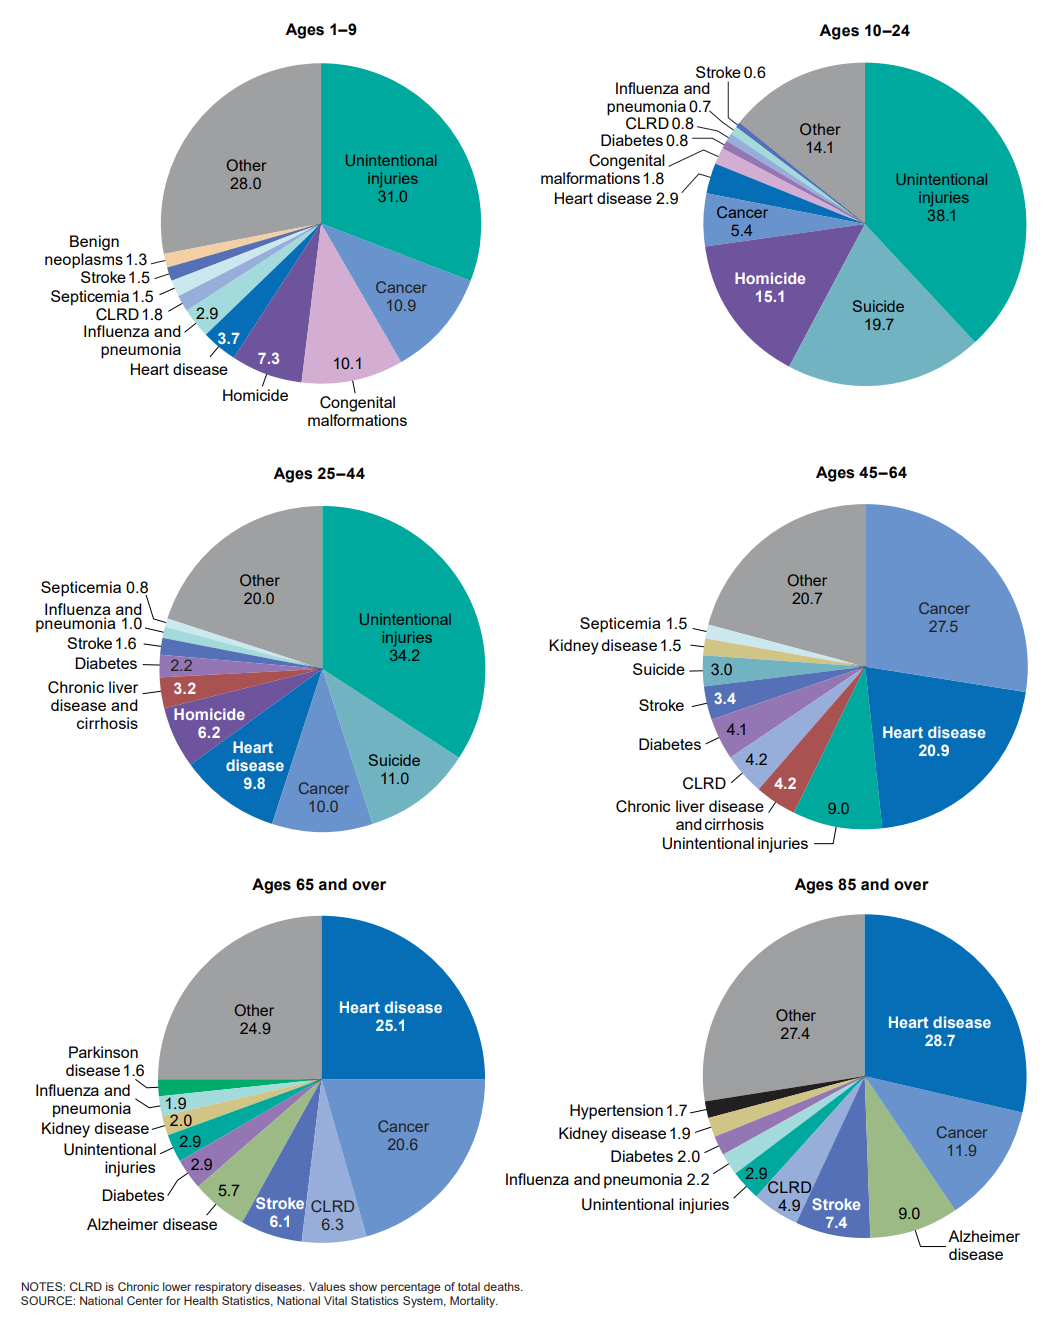
Notice that unintentional injuries are the leading cause of death for the widest variety of ages, and recall from the previous section above that accidents were also found to have become increasingly common as causes of death within the United States population.[9] For example, these were the top causes of death for various age groups in the United States in the year 2016 were:
- < 1 year – Congenital anomalies
- 1 – 4 years – Unintentional Injury
- 5 – 9 years – Unintentional Injury
- 10 – 14 years – Unintentional Injury
- 15 – 24 years – Unintentional Injury
- 25 – 34 years – Unintentional Injury
- 35 – 44 years – Unintentional Injury
- 45 – 54 years – Malignant Neoplasms (cancer)
- 55 – 64 years – Malignant Neoplasms (cancer)
- 65 + – Heart Disease
The causes of death on this list resemble the causes presented in the previous sections, but the breakdown of these causes by age group highlights the true prevalence of each. Unintentional injury (accidents), for example, was found to be the third most common cause of death within the United States population, but it becomes apparent from this list that it is the most common for the widest range of age groups or developmental stages.[10] Heart disease was found to be the most common cause of death overall, but this list shows that it is more restricted to one age group (65+) than other causes. Similarly, cancer was found to be the second most common cause of death within the United States population, but this list reveals that it is most prevalent for individuals in middle to late adulthood.
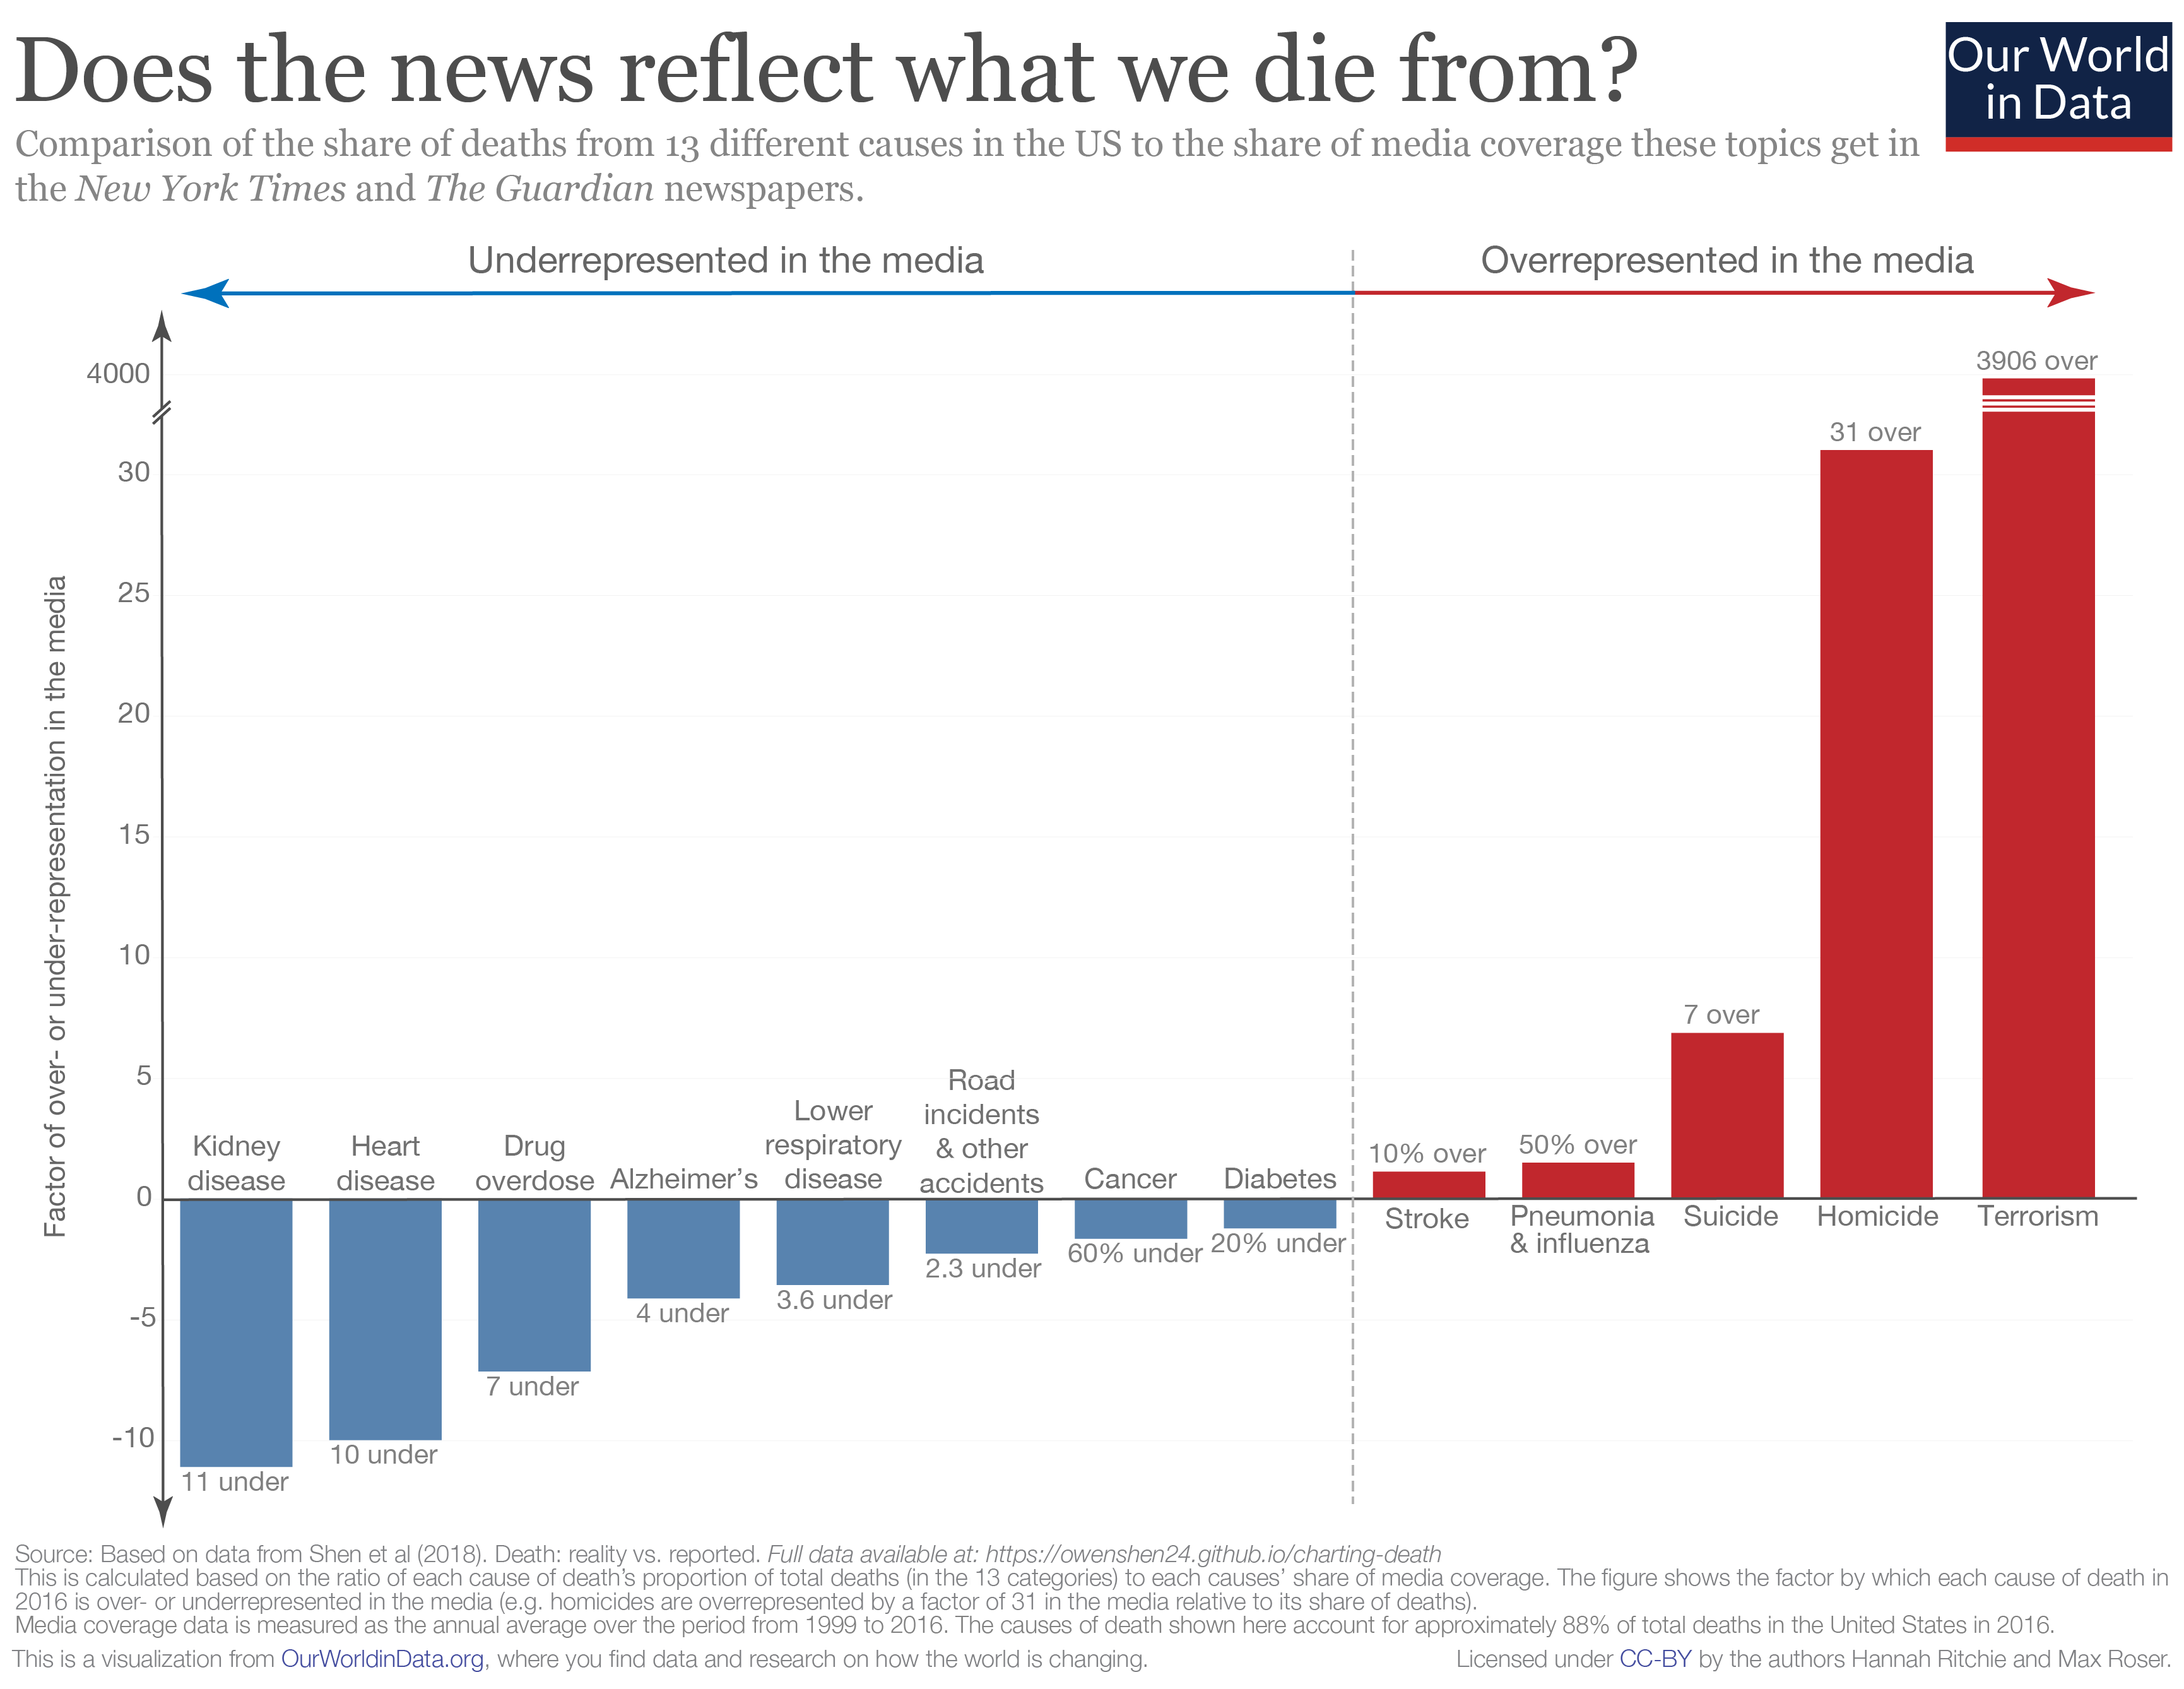
Interestingly, the things that actually result in death are not often the things we hear about on the news (Figure 3).[11] Because of the availability heuristic—a cognitive shortcut in which people rely heavily on information that is most readily available in their mind, people may erroneously be more afraid of sensational deaths than death by more normal causes, such as heart disease.
Try It
Aspects of Death
One way to understand death and dying is to look more closely at physiological death, social death, and psychological death. These deaths do not occur simultaneously, nor do they always occur in a set order. Rather, a person’s physiological, social, and psychological deaths can occur at different times.[12]
Physiological death
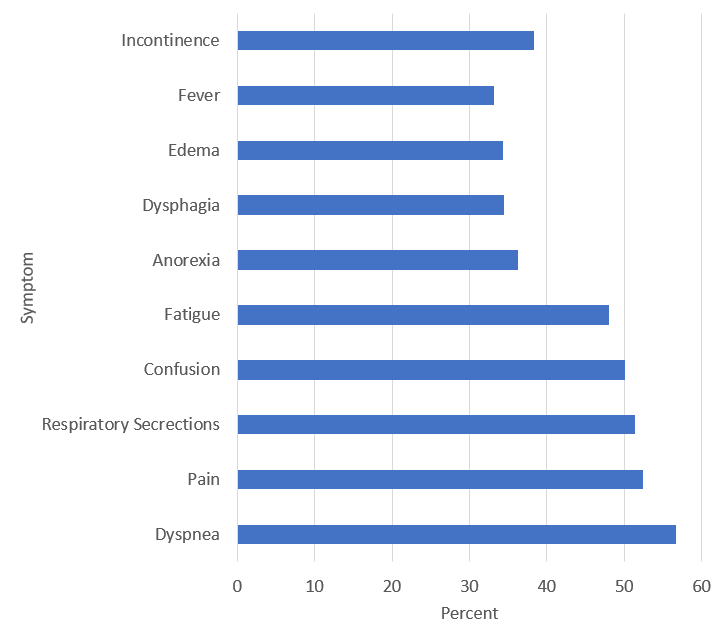
Physiological death occurs when the vital organs no longer function. The digestive and respiratory systems begin to shut down during the gradual process of dying. A dying person no longer wants to eat as digestion slows, the digestive track loses moisture, and chewing, swallowing, and elimination become painful processes. Circulation slows and mottling, or the pooling of blood, may be noticeable on the underside of the body, appearing much like bruising. Breathing becomes more sporadic and shallow and may make a rattling sound as air travels through mucus- filled passageways. Agonal breathing refers to gasping, labored breaths caused by an abnormal pattern of brainstem reflex. The person often sleeps more and more and may talk less, although they may continue to hear. The kinds of symptoms noted prior to death in patients under hospice care (care focused on helping patients die as comfortably as possible) are noted below (Figure 4).[13]
When a person is brain dead, or no longer has brain activity, they are clinically dead. Physiological death may take 72 or fewer hours. This is different than a vegetative state, which occurs when the cerebral cortex no longer registers electrical activity but the brain stem continues to be active. Individuals who are kept alive through life support may be classified this way.
This video explains the difference between a vegetative state, a coma, and being brain dead.
You can view the transcript for “Is A Brain Dead Person Actually Dead?” here (opens in new window).
Social death
Social death begins much earlier than physiological death. Social death occurs when others begin to withdraw from someone who is terminally ill or has been diagnosed with a terminal illness. Those diagnosed with conditions such as AIDS or cancer may find that friends, family members, and even health care professionals begin to say less and visit less frequently. Meaningful discussions may be replaced with comments about the weather or other topics of light conversation. Doctors may spend less time with patients after their prognosis becomes poor. Why do others begin to withdraw? Friends and family members may feel that they do not know what to say or that they can offer no solutions to relieve suffering. They withdraw to protect themselves against feeling inadequate or from having to face the reality of death. Health professionals, trained to heal, may also feel inadequate and uncomfortable facing decline and death. A patient who is dying may be referred to as “circling the drain,” meaning that they are approaching death. People in nursing homes may live as socially dead for years with no one visiting or calling. Social support is important for quality of life and those who experience social death are deprived from the benefits that come from loving interaction with others.
Psychological death
Psychological death occurs when the dying person begins to accept death and to withdraw from others and regress into the self. This can take place long before physiological death (or even social death if others are still supporting and visiting the dying person) and can even bring physiological death closer. People have some control over the timing of their death and can hold on until after important occasions or die quickly after having lost someone important to them. In some cases, individuals can give up their will to live. This is often at least partially attributable to a lost sense of identity. [14] The individual feels consumed by the reality of making final decisions, planning for loved ones—especially children, and coping with the process of his or her own physical death.
Interventions based on the idea of self-empowerment enable patients and families to identify and ultimately achieve their own goals of care, thus producing a sense of empowerment. Self-empowerment for terminally ill individuals has been associated with a perceived ability to manage and control things such as medical actions, changing life roles, and psychological impacts of the illness. [15]
Treatment plans that are able to incorporate a sense of control and autonomy into the dying individual’s daily life have been found to be particularly effective in regards to general attitude as well as depression level. For example, it has been found that when dying individuals are encouraged to recall situations from their lives in which they were active decision makers, explored various options, and took action, they tend to have better mental health than those who focus on themselves as victims. Similarly, there are several theories of coping that suggest active coping (seeking information, working to solve problems) produces more positive outcomes than passive coping (characterized by avoidance and distraction). Although each situation is unique and depends at least partially on the individual’s developmental stage, the general consensus is that it is important for caregivers to foster a supportive environment and partnership with the dying individual, which promotes a sense of independence, control, and self-respect.
Try It
The Process of Death
For those individuals who are terminal and death is expected, a series of physical changes occur. Bell[16] identifies some of the major changes that occur in the weeks, days, and hours leading up to death:
- Weeks Before Passing
- Minimal appetite; prefer easily digested foods
- Increase in the need for sleep
- Increased weakness
- Incontinence of bladder and/or bowel
- Restlessness or disorientation
- Increased need for assistance with care
- Days Before Passing
- Decreased level of consciousness
- Pauses in breathing
- Decreased blood pressure
- Decreased urine volume and urine color darkens
- Murmuring to people others cannot see
- Reaching in air or picking at covers
- Need for assistance with all care
- Days to Hours Before Passing
- Decreased level of consciousness or comatose-like state
- Inability to swallow
- Pauses in breathing become longer
- Shallow breaths
- Weak or absent pulse
- Knees, feet, and/or hands becoming cool or cold
- Knees, feet, and/or hand discoloring to purplish hue
- Noisy breathing due to relaxed throat muscles, often called a “death rattle”
- Skin coloring becoming pale, waxen (Bell, 2010, pp. 5, 176-177)
- This chapter was adapted from select chapters in Lumen Learning's Lifespan Development, authored by Martha Lally and Suzanne Valentine-French available under a Creative Commons Attribution-NonCommercial-ShareAlike license, and Waymaker Lifespan Development, authored by Sarah Carter for Lumen Learning and available under a Creative Commons Attribution license. Some selections from Lumen Learning were adapted from previously shared content from Wikipedia. ↵
- Ritchie, H. and Roser, M. (2019) "Causes of Death" Published online at OurWorldInData.org. Retrieved from: 'https://ourworldindata.org/causes-of-death' [Online Resource] ↵
- Uniform Law Commissioners. (1980). Defining death: medical, legal and ethical issues in the definition of death. Washington, DC: US Government Printing Office, 1981159–166.166 ↵
- Xu, J., Murphy, S. L., Kochanek, K. D., Bastian, B., & Arias, E. (2018). Deaths: Final data for 2016. National Vital Statistics Reports 67(5), 1-76. ↵
- Heron, M. (2021). Deaths: Leading causes for 2019. National Vital Statistics Reports, 70(9).: https://dx.doi.org/10.15620/cdc:107021 ↵
- USAFacts.org. (2020, July 14). Top causes of death in the United States in 2020: Heart disease, cancer and COVID-19. https://usafacts.org/articles/top-causes-death-united-states-heart-disease-cancer-and-covid-19/. ↵
- World Health Organization. (2020). Global Health Estimates 2019: Deaths by Cause, Age, Sex, by Country and by Region, 2000-2019. ↵
- World Health Organization. (2020). Global Health Estimates 2019: Deaths by Cause, Age, Sex, by Country and by Region, 2000-2019. ↵
- Centers for Disease Control and Prevention. (2018). Diseases and Conditions. https://www.cdc.gov/diseasesconditions/index.html ↵
- Xu, J., Murphy, S. L., Kochanek, K. D., Bastian, B., & Arias, E. (2018). Deaths: Final data for 2016. National Vital Statistics Reports 67(5), 1-76. ↵
- Ritchie, H. (2019). Does the news reflect what we die from? Our World in Data. https://ourworldindata.org/does-the-news-reflect-what-we-die-from?linkId=68864855 ↵
- Butow, P. (2017). Psychology and end of life. Australian Psychologist, 52(5), 331-334. ↵
- Kehl, K. A., & Kowalkowski, J. A. (2013). A systematic review of the prevalence of signs of impending death and symptoms in the last 2 weeks of life. The American Journal of Hospice & Palliative Care, 30(6), 601–616. https://doi.org/10.1177/1049909112468222 ↵
- Butow, P. (2017). Psychology and end of life. Australian Psychologist, 52(5), 331-334. ↵
- Butow, P. (2017). Psychology and end of life. Australian Psychologist, 52(5), 331-334. ↵
- Bell, K. W. (2010). Living at the end of life. New York: Sterling Ethos. ↵
