
Module 4A – Design
Chapter 1: Modeling
Modeling
Now that your design team has selected a product concept:
- Developed a function tree tree, and ensured sub-functions are broken down via a function block diagram
- Continue work from functional analysis to develop a math model to accomplish these functions
Watch the interactive video below: Math Models- Basic Part 1
Your design team will assess the ability of your selected concept to meet the specifications by constructing a mathematical model that casts product functions as mathematical relationships between inputs, outputs, and control variables.
Math Modeling
Watch the interactive video below: Math Model-Basic Part 2
Use the figure below and text your understanding with the french coffee press:

Example Math Modeling: ME 2700 Seeder Project
Click here to view and download the template of the System Model _Final Concept Process Flow with math model(Arens) example in DMADVR Toolbox [XLS]
The downloadable excel sheet is from the DMADVR Toolbox Template for System Modeling. The left side shows the process flow for the team’s final selected design. it indicates the Inputs, Outputs, and controls the process flow for the functions of the Seeder. The boxes indicate the function with their inputs, outputs, and controls. Once these are identified the math modeling can be developed. The colored boxes (yellow, green, and purple) show the variables, values, and units for the Inputs, outputs, and controls. The box in the upper right corner identifies the variables, provides a description and identifies the units used. The functions in the process flowchart are used to determine the conversion equations(and thus the variables) associated with the functionality needed. The equations are shown to the right of the colored boxes. The conversion equations can be used to predict performance and verify this during the testing process. Also in this System Model template, the sources for equations and information need to be cited at the bottom of the Model as shown here.
QFD/House of Quality(HoQ): Roof (Trade-offs)
Design Team will use information gained from your mathematical model to fill in the Roof of the QFD matrix (correlations/trade-offs). This indicates which features/functions of your design are complementary or in conflict.
Correlations -House of Quality Roof_Video Script [DOC]
Seeder HoQ Roof Example from DMADVR Toolbox Template
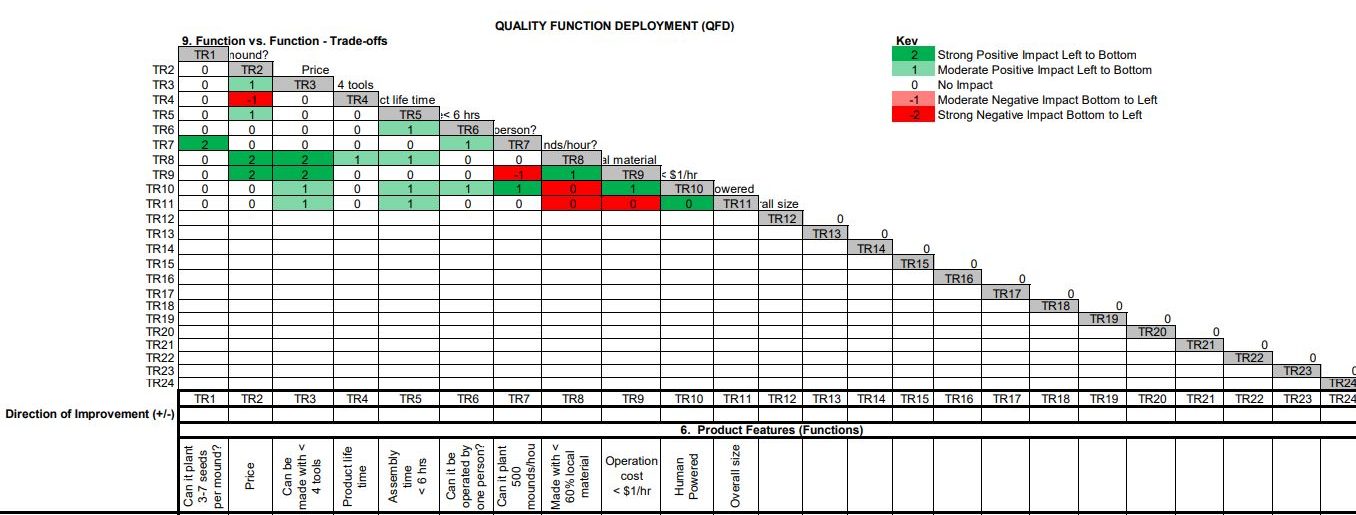
All Product Features (functions and characteristics) in each column will be assessed with another column to determine the relationship (trade-offs). As the Key indicates the levels of impact range from No impact (0) to Strong Positive (2) or Strong Negative (-2). The design team utilizes the roof to review the relationship and the impact. For example the weight of a car impacts the fuel efficiency(gas mileage). Heavy weighted vehicles have a moderate to strong negative impact on fuel efficiency for example. Generally an inverse relationship is negative but not always. The relationship depends upon the design and what the HOW is address in the WHAT for the design team’s customers. This is a team exercise and the discussions drive the decisions on the Trade-offs! This form is in the DMADVR Toolbox, and is part of the HoQ(the roof!).
