
Assessment of Cardiovascular Function
The Electrocardiogram
Karri Haen Whitmer
Introduction to the cardiac cycle
Several physical and electrical events occur during the cardiac cycle, resulting in the flow of blood through the heart and peripheral tissues. In the simplest terms, the cardiac cycle traces the flow of blood through the heart. The physical contraction and relaxation of atria and ventricles is induced by the proper functioning of the heart’s electrical conduction system.
At the beginning of the cardiac cycle, the atria are relaxed and fill with blood coming from the vena cavae and cardiac venus sinus or the pulmonary veins. The increased pressure in the atria due to atrial filling eventually forces the atrioventricular (AV) valves open, and blood flows into the ventricles. The atria contract and force the remaining blood into the ventricles, which are relaxed during filling.
As the pressure of the blood inside the ventricles increases, the atrioventricular valves close. During this time the arterial pressure is at its lowest point during the cardiac cycle; this is called diastolic pressure. Ventricular contraction increases the ventricular pressure until it exceeds the arterial pressure, forcing the semilunar valves open, causing blood to flow into the pulmonary arteries and the aorta. Blood entering the arterial system from the aorta inflates the arteries and increases blood pressure to a maximum, which is the systolic pressure.
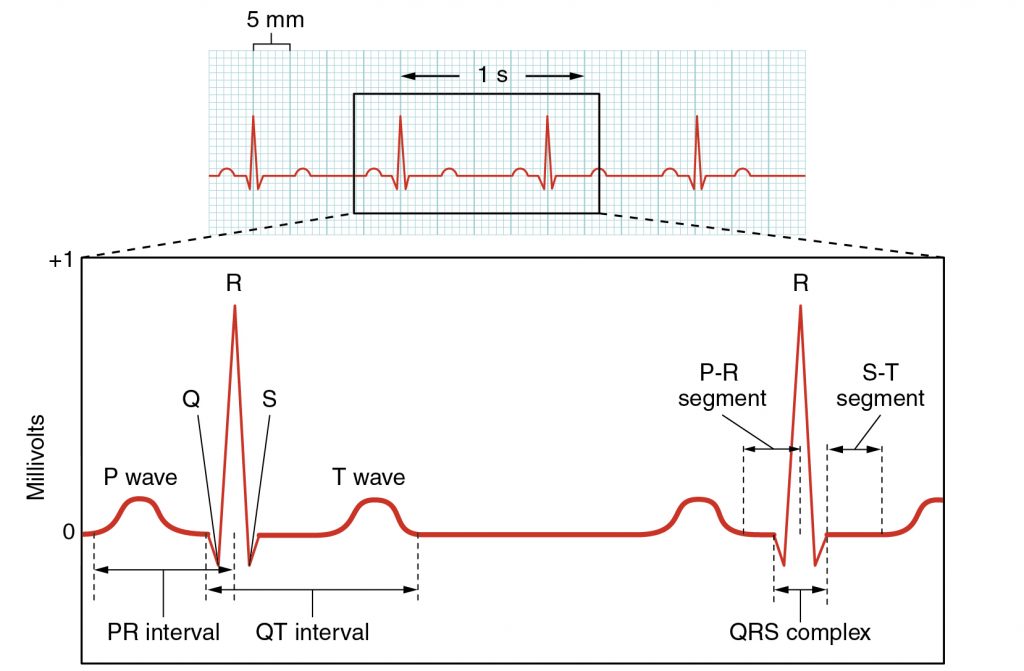
In this lab you will record and electrocardiogram (ECG) from a subject and listen to the characteristic “lub-dub” heart sounds. The “lub” sound occurs during the early phase of ventricular contraction and is produced by closing of the atrioventricular valves, which prevents blood backflow into the atria. When the ventricles relax, the blood pressure drops below what is in the arteries and the semilunar valves close, producing the “dub” sound. These sounds can be correlated with the basic waveforms seen on an ECG (Figure 1).
Electrical conduction system of the heart
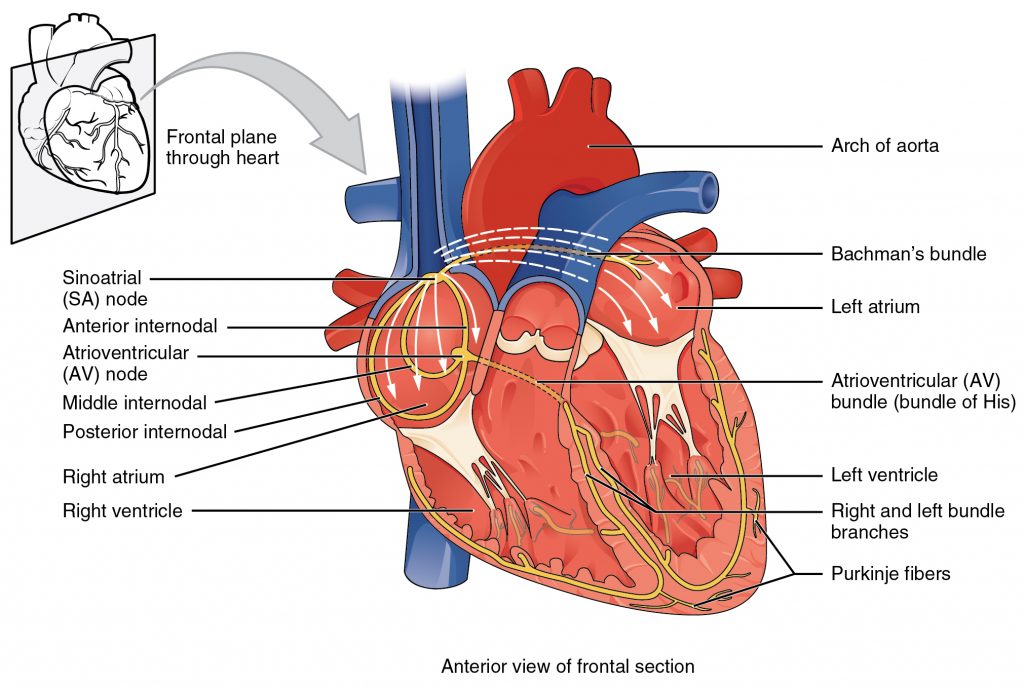
The heart is composed of two basic types of cells – contractile and non-contractile. Most cardiomyocytes are contractile, and when they are stimulated by an action potential, they contract. Some cardiomyocytes are non-contractile: that is, they only conduct action potentials to the contractile cells. These specialized cardiomyocytes are called conducting fibers (Figure 2).
Some of the conducting cells in the heart normally generate action potentials on their own (without nervous system stimulation). These cells, which lead to the autorhythmic nature of the heart, control the timing of contraction in the atria and ventricles. The most important autorhythmic cells of the heart are found in the sinoatrial (SA) node and the atrioventricular (AV) node. The pacemaker of the heart, which sets the overall heart rhythm in normal individuals, is the SA node. The SA node generates and transmits signals, stimulating the atria to contract and sending an impulse to the AV node.
The signal sent from the SA node to the AV node informs the AV node cells that the atria have contracted. The AV node delays transmission of a secondary impulse to the rest of the heart. This short delay, normally 0.12 seconds, is very important because it allows enough time for complete atrial contraction before the ventricles contract (that is, enough time for the ventricles to finish filling with atrial blood). This delay coordinates the successive contractions of the atria and ventricles.
From here, the AV node sends an impulse through the Bundle of His, which quickly branches into the right and left interventricular bundle branches. These branches send the impulse through the ventricular septum of the heart. Once the impulse reaches the apex of the heart, ventricular contraction ensues. The two bundle branches taper to produce the Purkinje fibers, which stimulate the myocardial cells composing the ventricular walls to contract. Purkinje fibers first conduct the impulse to contractile cardiomyocytes at the apex and then to the cardiomyocytes of the lateral walls of the heart. The result is that the ventricles contract from the bottom upward, starting contraction at the apex and ending contraction in the regions of the ventricles proximal to the atria. This method of contraction allows for adequate squeezing of the blood out of the ventricles and into their respective arteries (either the pulmonary artery or aorta), much like squeezing a tube of toothpaste from the bottom up in order to force out all the toothpaste.
Characteristics of the ECG
The electrical activity (action potentials) generated by the contractile cardiomyocytes of the heart during atrial and ventricular contraction can be measured by an electrocardiogram (ECG). The most-simple ECG can be recorded by placing electrodes on the two wrists and left ankle, forming Einthoven’s Triangle. ECG electrodes record the electrical potentials originating from the cells of the heart as impulses spread from the atria to the ventricles. These impulses cause very small electrical changes in the skin that occur in response to cardiac action potentials.
Although the timing and amplitudes for normal findings in the ECG may vary, the overall shape and direction (deflection) of ECG waveforms will be similar under normal physiological conditions (Figure 1, above). Combining ECG information with a patient’s overall clinical status makes it an extremely valuable method for determining heart function. Analysis of ECGs includes examination of ECG waves, intervals (a section of the ECG that contains a wave), and segments (an isoelectric, or flat, section of the ECG that is between two sequential waves).
The P-wave represents depolarization of the plasma membranes of cardiomyocytes leading to the sequential contraction of the right and left atria. Sometimes it is possible to see this sequential activation as a biphasic wave representing the spread of charge from the right to the left side of the heart. The duration of the P-wave is typically no greater than 0.12 seconds.
The QRS complex represents depolarization leading to the simultaneous contraction of cardiomyocytes of the right and left ventricles. Most of the electrical activity recorded by the QRS wave is derived from the left ventricle, which is larger and more muscular. The duration of the QRS complex is typically 0.06-0.10 seconds. The amplitude of the QRS complex may vary, depending on the size of the ventricles and the proximity of the electrodes to the ventricular chambers.
The T-wave represents the repolarization of the ventricles, which results in muscle cell relaxation.
Note: the repolarization wave of atrial cell membranes resulting in atrial relaxation is hidden within the QRS complex.
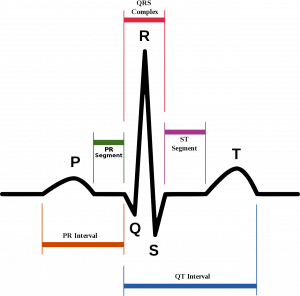
Measuring the time elapsed between ECG features can provide useful information when diagnosing heart abnormalities (Figure 3, and Table 1 below):
The PR interval is the region of the graph that extends from the beginning of the P wave (onset of atrial depolarization) until the start of the QRS complex (onset of ventricular depolarization). The duration of this interval is normally between .12-.20 seconds. The relatively slow conduction through this interval is important because it ensures that atrial and ventricular depolarizations are separated in time; thus, allowing adequate time for ventricular filling before the ventricles contract.
Pathologies of the Conduction System of the Heart: Heart Block
Heart block refers to the conduction of impulses between the atria and ventricles that is too slow or non-existent. Long PR intervals can indicate first degree heart block, which is caused by conduction through the AV node that is too slow. Slow conduction through the AV node is called AV delay. AV delay may be caused by damage to the AV node tissues due to myocardial infarction (heart attack).
When AV conduction is completely blocked, the ECG displays back-to-back P waves. When P waves are not followed by the QRS complex, the ventricles fail to contract, and this leads to reduced mean arterial pressure (MAP) that can cause dizziness and fainting (due to the drop in cerebral blood pressure). When the ECG trace displays an occasional extra P-wave, where, otherwise, impulses still travel through the AV node , second degree heart block is diagnosed.
In the most severe case, P waves and QRS complexes may become independently regulated by the heart’s conducting tissues because impulses never pass through the AV node. This condition leads to the atria and ventricles having their own distinct sinus rhythm, called third degree heart block. In this case, the ECG may show several extra P waves before a QRS complex.
The Q-T interval, as its name suggests, measures the time from the start of the Q wave to the end of the T wave. This measures the time for depolarization and repolarization, or contraction and relaxation, of the heart’s ventricles. The Q-T interval is dependent upon heart rate: a faster heart rate results in a shorter Q-T interval. Reported values for normal QT intervals in resting individuals are equal to or lesser than 0.43 seconds. Longer than average Q-T intervals might indicate ventricular arrhythmias, depending on the resting heart rate and patient activity.
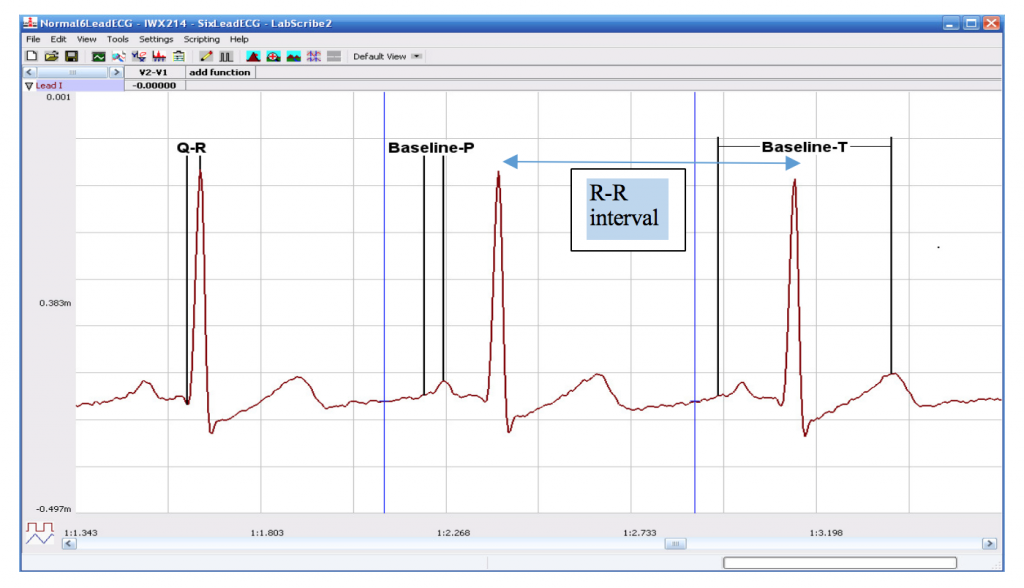
The R-R interval is similar to the Q-T interval in that it is also dependent upon heart rate. The R-R interval is the latency between QRS complexes, or the time between successive depolarizations of the ventricles. The R-R interval measures the periodicity of the heart beat: that is, it measures the regularity of the heart beat. The R-R interval can be used to calculate heart rate.
The normal R-R interval is between 0.6 seconds to 1 second, and correlates to an average resting heart rate of 60-100 bpm. Heart rates vary in adults depending upon age, weight, fitness and other factors. Normal heart rates range from 60-100 bpm, but in highly trained athletes, the rate may be lower (40-60 bpm). Heart rates lower than 60 bpm are considered bradycardia, or abnormally slow. Heart rates over 100 bpm are considered tachycardia, or abnormally fast.
For a normal heart rate, we consider the conduction velocity of the myocardial cells of the conduction system of the heart. Just as we measured the conduction velocity of the ulnar nerve in the Week 7 laboratory, myocardial conducting tissues have their own normal conduction velocities, even though they are not neural tissue. That is, the speed at which action potentials are propagated within the tissue from one site to the next can be calculated.
The conduction velocity in the AV node is the slowest of all the myocardial tissues (0.01-0.05 m/s). compare this value from the AV node with the conduction velocities for other myocardial tissues: atrial and ventricular conduction velocities average 1 m/s and the Bundle of His and Purkinje fibers average 2-4 m/s.
| ECG Feature | Duration (seconds) | Description |
|---|---|---|
| P Wave | .08-0.10 s | atrial depolarization |
| QRS Complex | .08-0.10 s | ventricular depolarization |
| T Wave | 160 ms | ventricular repolarization |
| PR Interval | 0.12-0.2 s | time between onset of atrial depolarization and ventricular depolarization |
| RR Interval | 0.6-1.2 s | rate of ventricular cycle |
| PP Interval | 0.6-1.2 s | rate of atrial cycle |
| QT Interval | .40-.43 s | time required for ventricular depolarization and repolarization |
| Heart Rate | 60-100 BPM |
Laboratory Methods for iWorx
Conducting the Electrocardiogram and its Analysis
Equipment Required
iWire-B3G ECG cable and electrode lead wires, EM-220 Event marker, Stethoscope, Alcohol swabs, Disposable ECG electrodes
Start the Software
- Turn on the iWorx unit with the switch at the back of the box.
- Locate the P-drive and double click the Week 10 settings file to open LabScribe.
Set Up
- Instruct the subject to remove all jewelry from their wrists and ankles. Use an alcohol swab to clean a region of skin on the inside of the subject’s right wrist, left wrist and left ankle. Let the area dry.
- Remove a disposable ECG electrode pad from its plastic shield and apply the electrode pad to the scrubbed area
- Snap the lead wires onto the electrodes, so that:
- The RED (+1) lead is attached to the left wrist
- THE BLACK (-1) lead is connected to the right wrist,
- THE GREEN (C or ground) lead is connected to the left ankle.
- Instruct the subject to sit quietly with their hands in their lap holding the iWire B3G box. If the subject moves, the ECG trace will move off the top or bottom of the screen. If the subject moves any muscles in the arms or upper body, electromyograms (EMGs) from the muscles will appear on the ECG recording as noise.
If in Exercise 1 you do not see a normal ECG recording, you may relocate the electrodes from Lead I to Lead II or Lead II (see figures 1a and 1b below).
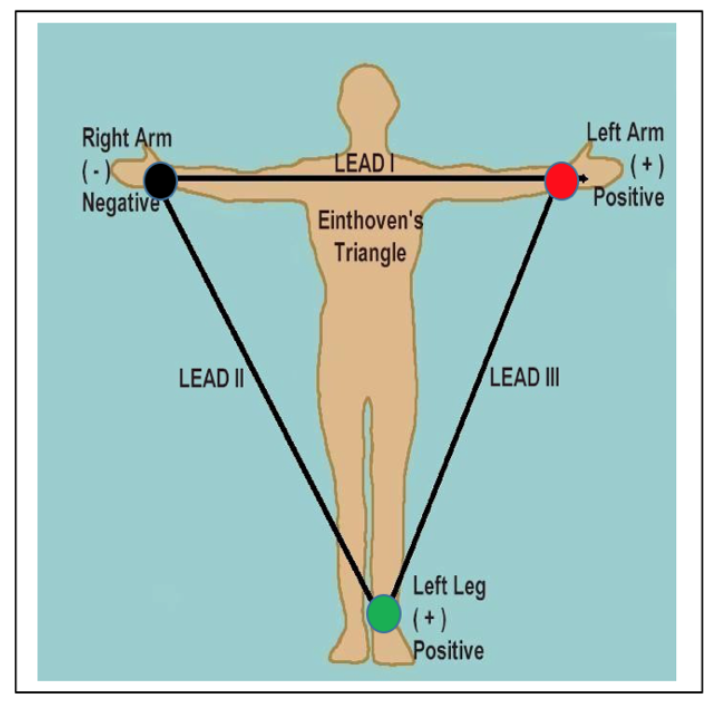
| Lead | Red (positive) | Black (negative) | Green (ground) |
|---|---|---|---|
| I | Left arm, distal to the antecubital area | Right arm, distal to the antecubital area | Inside left ankle, behind the medial malleolus |
| II | Inside of left ankle, behind the medial malleolus | Right arm, distal to the antecubital area | Inside right ankle, behind the medial malleolus |
| III | Inside left ankle, behind the medial malleolus | Left arm, distal to the antecubital area | Inside right ankle, behind the media malleolus |
Exercise 1: The ECG in a Resting Subject
Aim: To measure the ECG in a resting individual.
Procedure
- Click on the Record button, located on the upper right side of the LabScribe3 Main window. The signal should begin scrolling across the screen.
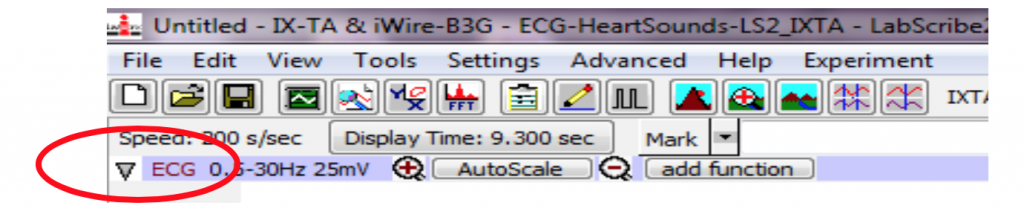
- Click on the AutoScale button at the upper margin of the ECG channel. If the signal on the ECG channel is upside down compared to methods figure 2 (below), click on the downward arrow to the left of the channel title and select the Invert function. The trace should now look similar to the one in the figure.
3. When you have a suitable trace, type <Subject’s Name> Resting ECG in the Mark box to the right of the Mark button. Press the Enter key on the keyboard to attach the comment to the data. Record for a minute or two. Watch the time in the upper right-hand corner of the screen.
4. Click Stop to halt recording.
5. Select Save As in the File menu, type a name for the file. Choose a destination on the computer in which to save the file, like your lab group folder. Click on the Save button to save the data file.
Data Analysis
- Scroll through the recording and find a section of data with 4 to 6 optimal ECG cycles in succession.
- Use the mouse to click on and drag the cursors to specific points on the ECG recording to measure the following:
-
- The R-wave amplitude. To measure the R wave amplitude, place one cursor on the Q wave that precedes the R wave and the second cursor on the peak of the R wave. The value for V2-V1 on the ECG channel is this amplitude. Measure the amplitudes of two additional R waves in mV.
- The P-wave amplitude. To measure the P wave amplitude, place one cursor on the baseline that precedes the P wave and the second cursor on the peak of the P wave. The value for V2-V1 on the ECG channel is this amplitude. Measure the amplitudes of two additional P waves in mV.
- The T-wave amplitude. To measure the T wave amplitude, place one cursor on the baseline that precedes a P wave and the second cursor on the peak of the T wave that is in the same cycle as that P wave. The value for V2-V1 on the ECG channel is this amplitude. Measure the amplitudes of two additional T waves in mV.
- The beat period, which is the time interval between two adjacent R waves (R-R interval). To measure the beat period, place one cursor on the peak of a R wave and the second cursor on the peak of the adjacent R wave. The value for T2-T1 on the ECG channel is the beat period. Measure the beat period for two additional pairs of R waves in seconds.
- Record the amplitude and time interval values in your lab report.
- Calculate the following values and record on your lab report:
- The average amplitudes for ECG waves and average beat period, in beats per second.
- The heart rate, which is expressed in beats per minute and calculated from the average beat period by using the following equation:
Heart Rate (beats/minute) = (60 seconds/minute) / (# seconds/beat)
Exericse 2: The ECG and Heart Sounds
Aim: To study the relationship of heart sounds to the ECG.
Procedure
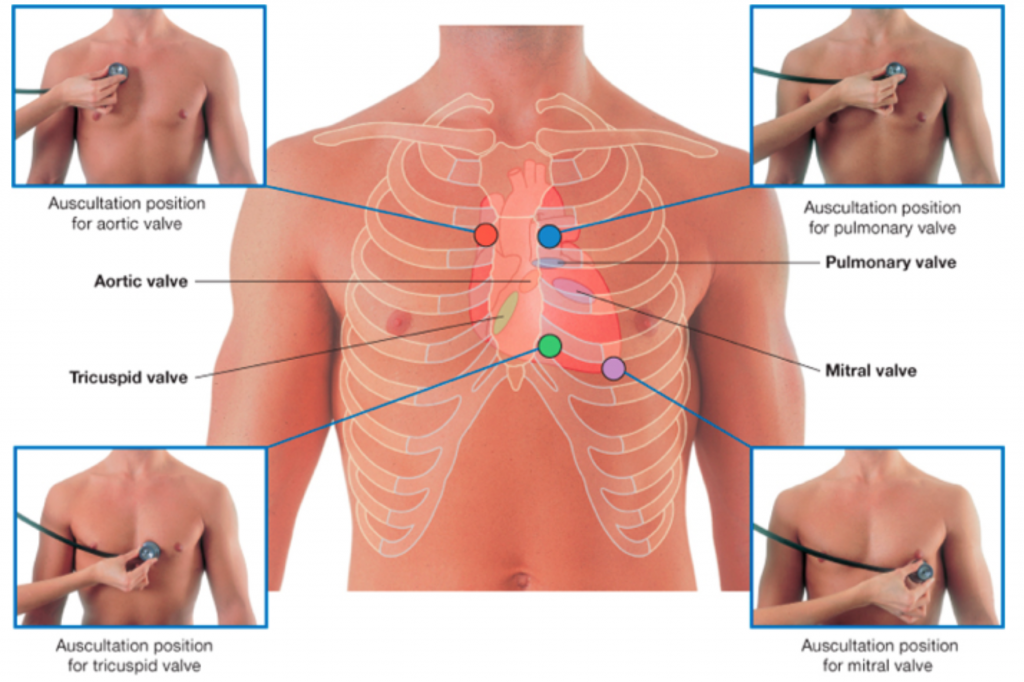
- Place the head of the stethoscope on the left side of the subject’s chest and listen for the heart sounds. Move the stethoscope head to the different auscultation positions shown above. Decide which position has the best-defined heart sounds.
- Click on the Record button (you will record for 30 seconds). With one hand, hold the stethoscope head on the subject’s chest where the “lub-dub” is heard the best, and hold the event marker in the other hand. Press the event marker when you hear the “lub”, or first heart sound, and release it when you hear the “dub”, or second heart sound. This will happen very quickly! You should practice several times.
- After recording for at least twenty seconds, click Stop to halt recording. After several tries, if the event marker for the “Lub” does not occur after the R-Wave and the event marker for the “Dub” does not align with or come right after the T-Wave, ask your TA for help.
- Select Save in the File menu on the LabScribe3 window.
Data Analysis
- Scroll through the recording and find a section of data with 4 to 6 exemplary ECG waveforms and consistent responses on the event marker channel, in succession.
Use the mouse to click on and drag the cursors to specific points on the ECG recording to measure the following:
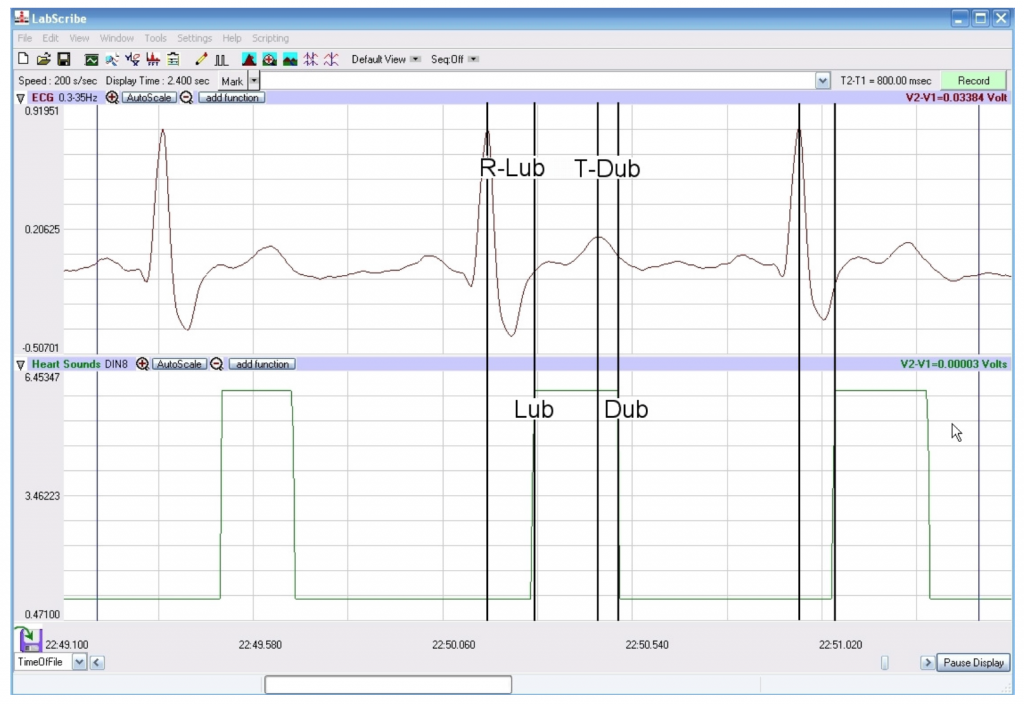
Note: Do the measurement for the R-Lub Interval and the T-Dub Interval on the same wave, making sure the event marker for the Lub is after the R-wave and the event marker for the Dub is after the T-Wave (Methods Figure 4).
- The R-Lub Interval, which is the time interval between the peak of a R wave and the onset of the event marker. The onset of the event marker indicates the occurrence of the first heart sound or “lub”. Record the value for T2-T1 in seconds. Measure this time interval for two additional ECG cycles.
- The T-Dub Interval, which is the time interval between the peak of a T wave and the offset of the event marker. The offset of the event marker indicates the occurrence of the second heart sound or “dub”. Record the value for T2-T1 in seconds. Measure this time interval for two additional ECG cycles.
- Calculate the following values and record on your data table: the average R-Lub interval in seconds; the average T-Dub interval in seconds.
Please cite:
Haen Whitmer, K.M. (2021). A Mixed Course-Based Research Approach to Human Physiology. Ames, IA: Iowa State University Digital Press. https://iastate.pressbooks.pub/curehumanphysiology/
