
Assessment of Pulmonary Function
Spirometry
Karri Haen Whitmer
Introduction
Over time, the amount of oxygen (O2) taken up and carbon dioxide (CO2) given off at the tissues is matched with the amount of O2 taken up and CO2 given off at the lungs. The exchange of O2 and CO2 across the respiratory membrane of the lungs relies upon diffusion between the air and the blood. Any change in the rate of diffusion could produce a change in breathing parameters. One factor that influences the rate of diffusion is pulmonary surface area, which may change due to injury or body position. All other parameters being held constant, an increase in the surface area will increase the rate of diffusion and thus decrease the rate and depth of breathing.
Respiratory controls and breathing rate
Changes in the body’s metabolic demand also cause the respiratory control center in the medulla oblongata and pons to change the depth and rate of breathing to keep concentrations of blood gases, especially CO2 within homeostatic limits. The normal respiratory rate is 12-18 breaths per minute. Medullary control centers respond to elevated CO2 indirectly, by responding to a decline in pH as CO2 reacts with water. Then blood pH falls, the medullary control center stimulates an elevated breathing rate, to allow more CO2 to be expired. Once there is a normal pH detected, the breathing rate slows again to maintain a normal pH and CO2 concentration in your blood.
The control centers receive input from chemoreceptors in the carotid arteries and aortic arch: the carotid bodies and aortic bodies. When these chemoreceptors detect elevated CO2, breathing is stimulated and the respiratory rate rises. When there is less CO2, the breathing rate falls. Low levels of blood O2 detected by aortic and carotid body cells can also increase the breathing rate.[1]
Pulmonary function test: Spirometry
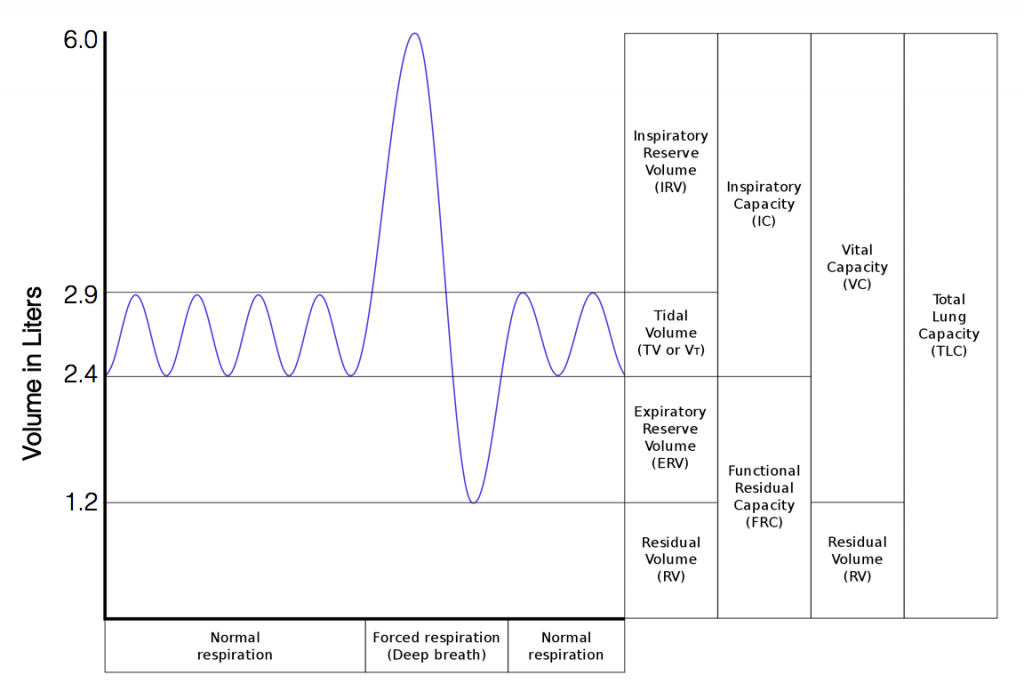
Spirometry is a simple breathing test that measures how much air can be inhaled and evacuated from the lungs and how quickly air can be exhaled. During the spirometry procedure, a patient is asked to breathe into a mouthpiece while plugging the nose with a clip. The patient takes the largest breath possible and then blows it out as quickly as possible. The flow of air through the mouthpiece is detected by sensors that send information about flow stimulus to a computer. The graph of the volume of air expelled can be divided into different lung volumes and capacities (Figure 1).
Respiratory Volumes and Capacities
Respiratory volume is the term used for various volumes of air moved by or associated with the lungs at a given point in the respiratory cycle. There are four major types of respiratory volumes: tidal, residual, inspiratory reserve, and expiratory reserve. Tidal volume (TV) is the amount of air that normally enters the lungs during quiet breathing, which is about 500 milliliters. Expiratory reserve volume (ERV) is the amount of air you can forcefully exhale past a normal tidal expiration, up to 1200 milliliters for men. Inspiratory reserve volume (IRV) is produced by a deep inhalation, past a tidal inspiration. This is the extra volume that can be brought into the lungs during a forced inspiration. Residual volume (RV) is the air left in the lungs if you exhale as much air as possible. The residual volume makes breathing easier by preventing the alveoli from collapsing. Respiratory volume is dependent on a variety of factors, and measuring the different types of respiratory volumes can provide important clues about a person’s respiratory health.
Respiratory capacity is the combination of two or more selected volumes, which further describes the amount of air in the lungs during a given time. For example, total lung capacity (TLC) is the sum of all of the lung volumes (TV, ERV, IRV, and RV), which represents the total amount of air a person can hold in the lungs after a forceful inhalation. TLC is about 6000 mL air for men, and about 4200 mL for women. Vital capacity (VC) is the amount of air a person can move into or out of his or her lungs, and is the sum of all of the volumes except residual volume (TV, ERV, and IRV), which is between 4000 and 5000 milliliters. Inspiratory capacity (IC) is the maximum amount of air that can be inhaled past a normal tidal expiration, is the sum of the tidal volume and inspiratory reserve volume. On the other hand, the functional residual capacity (FRC) is the amount of air that remains in the lung after a normal tidal expiration; it is the sum of expiratory reserve volume and residual volume.[2]
Comments on calculating values from the spirometry graph
Note that the spirometry graph records the variation in volume expelled through the spirometer flow head (usually represented in Liters) over time (in seconds). When reading the values for different spirometry measurements, it is important to use the correct Y-axis values. For example, to calculate the Tidal Volume from Figure 1, we subtract the lower limit of the measurement from the upper limit. E.g. TV = 2.9L-2.4L=0.5L. That is, the average value for TV in males is 0.5 L. Another example: the vital capacity in Figure 1 is 6.0L-1.2L=4.8 L. Note that a real spirometry graph in the doctor’s office would not account for the residual volume (RV); thus, the low end value for vital capacity would be zero Liters. In our Figure 1, we include the residual volume as a teaching tool, so students can visualize all the values that account for the total lung capacity (TLC).
Spirometry tells a clinician whether the lungs are functioning within the normal range. Using the graph generated from spirometry, the clinician can make several measurements:
- Tidal volume (TV): the volume of air displaced in the lungs during normal (tidal) inhalation and exhalation. This is the amount of air exchanged by breathing under normal, or resting, conditions. Note this value is a small percentage of the total lung capacity.
- Inspiratory reserve volume (IRV): the additional amount of air that can inflate the lungs after a tidal inhalation.
- Inspiratory capacity (IC): the total amount of air that can be inhaled into the lungs (TV+IRV). A forceful inhalation can determine the IC with spirometry.
- Expiratory reserve volume (ERV): the amount of air that can be forcefully exhaled from lungs after a tidal exhalation.
- Vital capacity (VC): the maximum amount of air that can be expelled from the lungs after a maximal inhalation. VC = IRV + TV + ERV (see graph). The subject forcefully inhales and then forcefully exhales as much air as possible to determine the VC with spirometry. The vital capacity varies with height, gender and age of the subject.
Other important volumes or capacities that cannot be determined directly by spirometry include:
- Residual volume (RV): the amount of air left in the lungs after a forceful exhalation. This volume cannot be directly determined by spirometry because the amount cannot be expelled through the spirometer mouthpiece for measurement. This is the amount of air that always remains in the lungs, keeping the lungs from “collapsing.”
- Functional residual capacity (FRC): the amount of air remaining in the lungs after a tidal exhalation. FRC is unknown in spirometry because the residual volume cannot be directly measured.
- Total lung capacity (TLC): the total air capacity of the lungs. TLC = VC + RV. TLC is unknown in spirometry because the residual volume cannot be directly measured.
Some additional measurements from the spirometry graph that are important for the clinical evaluation of lung function:
- Forced vital capacity (FVC): this is the total amount of air that can be forcefully expelled from fully inflated lungs during the spirometry test. FVC is equivalent to the vital capacity (VC) in most subjects.
- Forced expiratory volume (FEV1): the total amount of air blown out of fully inflated lungs after forceful exhalation for one second.
- FEV1%: the percentage of the FVC forcefully expelled from fully inflated lungs after one second. FEV1% = FEV1/FVC X 100%
- Maximum inspiratory flow rate (MIFR): maximum rate of air flow during inspiration.
- Maximum expiratory flow rate (MERF): maximum rate of air flow during exhalation.
Obstructive and Restrictive Pulmonary Disease
Pulmonary disease may be classified as either restrictive or obstructive, depending upon the cause of labored breathing. In a restrictive lung disease, the compliance, or elasticity, of the lung is reduced. When lung tissue becomes stiff or waterlogged, it cannot adequately expand. Common causes of decreased lung compliance are pulmonary fibrosis, pneumonia and pulmonary edema.
In obstructive lung disease, an obstruction results in increased airway resistance. For example, decreasing the diameter of an airway increases the resistance to airflow. Common obstructive diseases include asthma, bronchitis, and emphysema.
Spirometry as a Diagnostic Tool for Obstructive or Restrictive Disease
FVC and FEV values are critical measurements for diagnosing obstructive versus restrictive pulmonary disease. For example, in obstructive pulmonary disease, the FEV is diminished because it is difficult to force air out of the lungs due to airway narrowing. In some obstructive diseases like asthma, the residual volume is increased due to air trapping, resulting in a higher than normal FRC and TLC but a lower than normal FEV. In the case of restrictive pulmonary disease like pneumonia, the FVC, VC, TLC and FEV are reduced due to loss of elasticity of lung tissues.
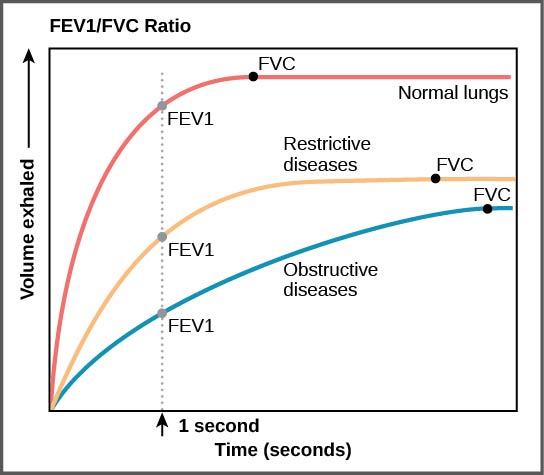
FEV1/FVC (the FEV1 value divided by the FVC) is expressed as FEV1%. This ratio represents the percentage of the lung’s vital capacity that a patient can expel in one second (Figure 2). Higher percentages are correlated with healthier lung tissue. Although the values for the predicted normal FEV1% will vary depending upon sex, age, and other demographics, a good rule of thumb is the FEV1% should be approximately 80%. In obstructive lung disease, the FEV1% is often much lower than normal, for example 40% as opposed to 80%, because it is very difficult to quickly force out air through a narrow airway (think of trying to forcefully exhale through a drinking straw). By contrast, in restrictive disease, the FEV1% may be normal (or high) because, although the vital capacity is reduced due to disease, the patient is still able to quickly force out a large percentage of the total expiratory volume into the spirometer.
| Disease Type | FEV1% | FVC |
|---|---|---|
| Restrictive | 80% or higher | low |
| Obstructive | Lower than 80% | normal or low |
Body position, gravity and lung capacities
Various lung volumes and capacities will change when comparing the standing, sitting, and supine (lying down) positions. Inspiratory and expiratory volumes will be greater when sitting or standing than lying down. This is explained by gravity pulling the abdominal contents away from the diaphragm when upright, therefore increasing the volume of the thoracic cavity. In a supine position the patient’s TV, IRV and ERV will decrease as the abdominal organs rest against the diaphragm limiting its movements. Thus, the vital capacity will decrease. The reduction in TV while laying down may partially explain why patients with respiratory disease have more difficulty breathing in the night while sleeping.
The volume of air passing into and out of the lungs in one minute is called minute volume. This volume depends on both the depth of breathing (tidal volume) and the ventilation rate (breaths per minute). For example, minute volume increases during exercise and continues to be elevated for a short period after exercise. This is due to a combination of the increase in both rate and depth of breathing.
The minute volume influences but is not equal to the volume of air available for gas exchange in the alveoli, called the alveolar ventilation. Alveolar ventilation is less than the minute volume because the last part of each inspiration (and expiration) remains in the conducting passageways of the respiratory system. The part of the respiratory system where gas exchange between air and blood does not take place is called the dead space. Anatomic dead space, which generally averages 150 mL, is formed by the nasal cavity, pharynx, larynx, trachea, bronchi, bronchioles, and terminal bronchioles. Physiological dead space consists of anatomical dead space plus the volume of any alveoli in which gas exchange is less than normal.
In this clinical assessment, students will examine the effects of gravity on breathing by measuring the differences in lung volumes and capacities of a resting subject while he or she is sitting, standing, or lying down.
Laboratory Methods for iWorx
Set-Up for Breathing and Gravity
Equipment Required: PC or Mac Computer, IXTA data acquisition unit, USB cable, Nose Clip, IXTA power supply, A-FH-300L Spirometer flow head and plastic tubes, Personal Blue Spirometry Flow Head
IXTA Setup Start the Software
- Click on the LabScribe shortcut on the computer’s desktop to open the program.
- Select the settings file in the Human Spirometry folder then Click the Breathing-Gravity-LS2.
Spirometer Setup
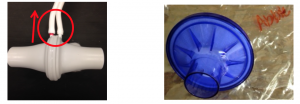
- Locate the A-FH-300L flow head and the airflow tubing (Methods Figure 1).
Before Starting
- Please read the procedures for each exercise completely before beginning the experiment. You should have a good understanding of how to perform these exercises before making recordings.
- The spirometer will monitor breathing from a subject. It is important that the subject is healthy and has no history of serious respiratory or cardiovascular problems.
- The outlets on the flow head should always be in the upright position (Figure 1, left) to avoid problems with condensation developing in the airflow tubes.
- Attach the BLUE filter to the flow head on the side of the red marked outlet.
- Turbulence in the flow head will produce a noisy signal. To reduce turbulence, the subject should place his or her lips COMPLETELY around the outside of the opening of the BLUE bacterial filter attached to the flowhead.
- Use a clip or pinch your nose with your fingers to prevent air from entering or leaving the nose as the subject is breathing. Air that passes through the nose is not included in the volume measurements and causes errors in these values.
- The settings file, Breathing-Gravity-LS2, programs LabScribe to record the breathing of the subject on the Air Flow channel. A computed function is programmed on the Lung Volumes channel to convert the data recorded on the Air Flow channel to lung volume measurement.
- Allow the IXTA to warm up for 10 minutes before recording for the first time.
- When spirometry data is recorded in the conventional manner, inhalation is always displayed as an upward deflection. To determine if the subject is breathing through the correct end of the Blue flow head.
- Click on the Save to Disk button in the lower left corner of the Main window to switch the LabScribe software into Preview mode. When LabScribe is in Preview mode, there is a red X across the Save to Disk button. In Preview mode, the iWorx recording system works without recording data on the hard drive or any other storage media which allows a subject to become comfortable with breathing through a spirometer.
- Click on the Preview button. Have the subject inhale through the spirometer Blue flow head for 30-60 seconds.
- Click on the AutoScale button at the upper margin of the Air Flow and Lung Volumes channels.
- If the White flow head is oriented properly, the traces on the Air Flow and Lung Volumes channels will go UP during inhalation.
- If the traces on these channels go down during inhalation, have the subject breathe through the other end of the Blue flow head.
- Click on the Stop button.
- Before proceeding to the actual exercises, make sure the LabScribe software in set to Record mode. Click on the Save to Disk button, in the lower left corner of the Main window, to change LabScribe from Preview mode to Record mode. When LabScribe is in Record mode, there is a green arrow on the Save to Disk button.
Exercise 1: Breathing While Sitting
Aim: To measure breathing parameters in a sitting subject.
Procedure
- Instruct the subject to:
- Sit quietly and become accustomed to breathing through the spirometer Blue flow head as you did in the Set-Up Preview activity.
- Breathe normally before any recordings are made.
- Hold the White flow head so that its outlets are pointed up (Methods Figure 1, left).
- Remove the Blue and White flow heads from his or her mouth and hold it at mouth level in a position that prevents a breath from moving through either flow head.
Note: The LabScribe software will zero the Lung Volumes channel during the first ten seconds of recording. No air should be moving through the flow head during this time.
- Type the Subject’s Name/Sitting in the Mark box that is to the right of the Mark button.
- Click on the Record button. After waiting ten seconds for the Lung Volumes channel to zero, have the subject place the flowhead in his or her mouth and begin breathing. Press the Enter key on the keyboard to mark the recording.
- Click the AutoScale buttons of the Lung Volumes channel. Notice the slowly moving wave on the Lung Volumes channel. Record five breaths, which normally takes about forty-five seconds to record.
- Type “Forced” in the Mark box. Press the Enter key on the keyboard as the subject inhales as deeply as possible. After reaching his or her maximum inhalation volume, the subject should exhale as quickly and as completely as possible.
- After the forced exhalation is complete, the subject should continue to breathe normally through the spirometer for five breath cycles.
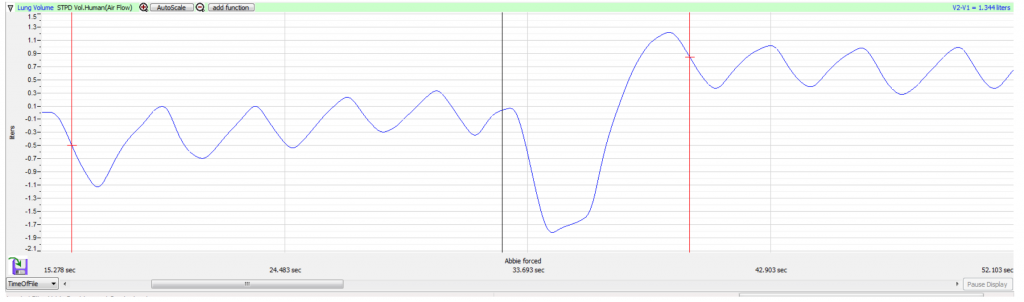
- Click Stop to halt recording. Your data may look like Methods Figure 2.
- Select Save As in the File menu, type the subject’s name (i.e. Alvin’s Breathing and Gravity) for the file. Choose a destination on the computer in which to save the file, like your lab group folder). Designate the file type as *.iwxdata. Click on the Save button to save the data file.
Data Analysis-Normal Breathing While Sitting
- Scroll through the recording and find the section of data recorded when the subject was breathing while resting, at the beginning of this exercise.
- Use the Display Time icons to adjust the Display Time of the Main window to show at least four complete breathing cycles on the Main window. Four adjacent breathing cycles can also be selected by:
-
- Placing the cursors on either side of a group of four complete breathing cycles; and
- Clicking the Zoom between Cursors button on the LabScribe toolbar to expand the four selected breathing cycles to the width of the Main window.
- Click on the Analysis window icon in the toolbar
- Look at the Function Table that is above the uppermost channel displayed in the Analysis window. The mathematical functions, V2-V1, Max_dv/dt, Min_dv/dt, and T2-T1 should appear in this table. Values for V2-V1, Max_dv/dt, Min_dv/dt, and T2-T1 on each channel are seen in the table across the top margin of each channel.
- Maximize the height of the trace on the Lung Volumes channel by clicking on the arrow to the left of the channel’s title to open the channel menu. Select Scale from the menu and AutoScale from the Scale submenu to increase the height of the data on that channel.
- Once the cursors are placed in the correct positions for determining the volumes and rates of each breath cycle, as explained below the values of the parameters in the Function Table can be recorded in your data table.
- On the Lung Volumes channel, use the mouse to click on and drag the cursors to specific points on the recording to measure the following volumes:
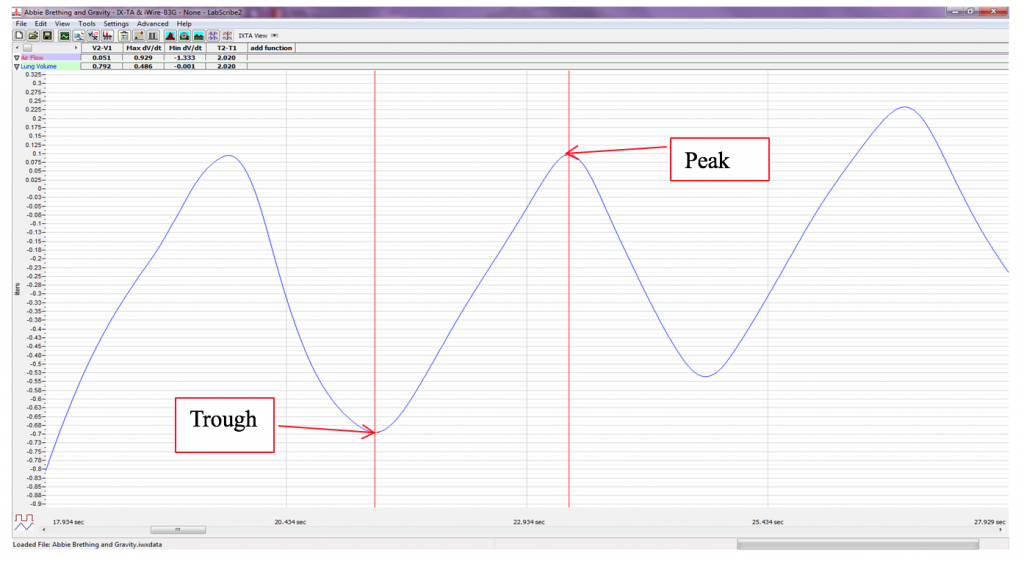
- Tidal Volume (TV), which is the volume of air inhaled or exhaled during a normal breathing cycle. To measure the tidal volume of the subject during breathing at rest, place one cursor in the trough prior to inhalation, and the second cursor on the peak of the cycle. The value for the V2-V1 function on the Lung Volumes channel is the tidal volume (Methods Figure 3). Measure and record 3 TV in Liters.
- Maximum Inspiratory Flow Rate (MIFR), which is the maximum rate of air movement during inhalation. To measure the maximum inspiratory flow rate of the subject during breathing at rest, leave the cursors in the same positions used to measure the tidal volume (Methods Figure 3). The value for the Max dv/dt function on the Lung Volumes channel is the maximum inspiratory flow rate of that breath cycle. Measure and record 3 in Liters.
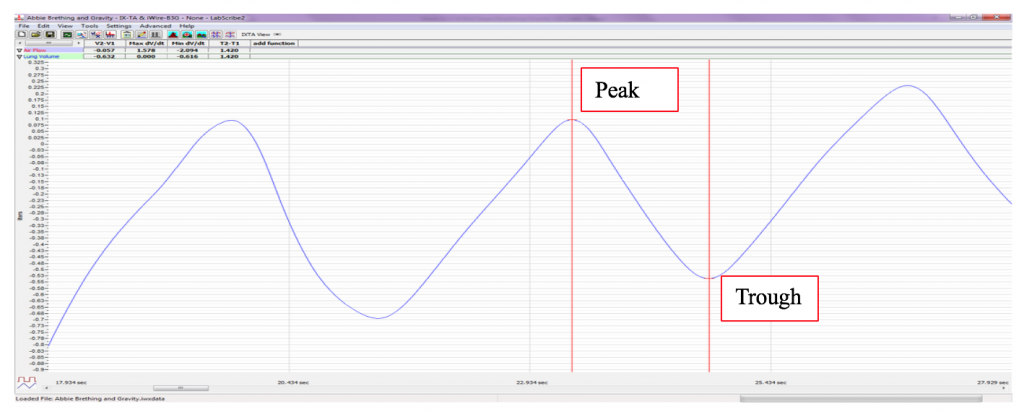
- Maximum Expiratory Flow Rate (MEFR), which is the maximum rate of air movement during exhalation. To measure the maximum expiratory flow rate of the subject during breathing at rest, place one cursor on the peak of the breath cycle, and the second cursor in the trough to the right of that peak. The value for the Min_dv/dt function on the Lung Volumes channel is the maximum expiratory flow rate of that breath cycle (Methods Figure 4).This function is used since the exhalation portion of the breath cycle has a negative slope. Measure and record 3 in Liters.
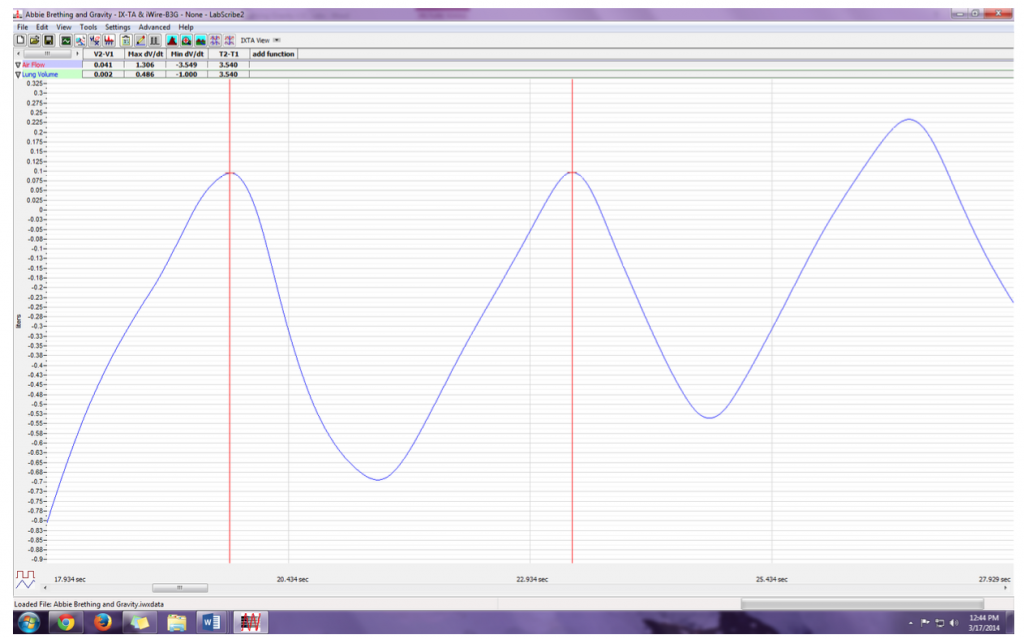
- Breath Period, which is the duration of each breathing cycle. To measure the breath period of the subject during breathing at rest, place one cursor on a peak of a breath cycle, and the second cursor on the peak of an adjacent cycle. The value for T2-T1 on the Lung Volumes channel is the period of that breath cycle (Methods Figure 5). Measure and record 3 Breath Periods in seconds.
- Record the values in your data table for Normal Breathing.
- Average the three values obtained for each parameter and enter the means in the table in your Data Table and Lab Report.
- Record the means for the tidal volume, rates, and breath period in the Data Table.
- Calculate the normal breathing rate of the sitting subject using the following equation: Breath Rate (breaths/minute) = 60 seconds/minute / mean breath period (sec/breath)
- Multiply the mean tidal volume by the breathing rate to calculate the volume of air passing in and out of the resting subject’s lungs each minute.
- Record the values for these calculations in the Data Table.
Data Analysis-Forced Expiration While Sitting
- Use the slider or the arrows on the scroll bar, at the bottom of the Analysis window, to position the Forced expiration in the window.
- Use the Display Time icons to adjust the Display Time of the Analysis window to show the forced expiration curve and the two normal breaths that occur before the forced expiration curve, on the same window. These breathing cycles can also be selected by:
-
- Placing the cursors on either side of the group of appropriate breathing cycles; and
- Clicking the Zoom between Cursors button on the LabScribe toolbar to expand the selected breathing cycles to the width of the Main window.The segment of the recording displayed in the window should be like the recording in Methods Figure 6.
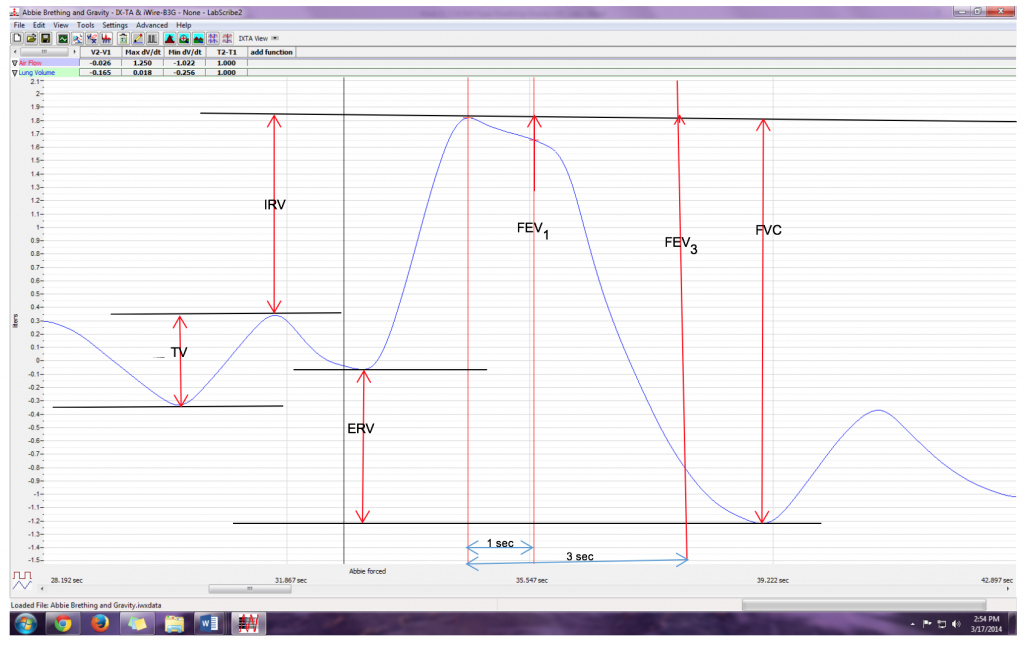
- Place the cursors the forced expiration data on the Lung Volumes channel to measure the following volumes and rates using the V2-V1, T2-T1, Max_dv/dt, and Min_dv/dt functions. Check the labels on Methods Figure 6 to identify the volumes and rates that you will measure:
-
- Tidal Volume (TV), by placing one cursor in the trough before the inhalation segment of the resting breath and the second cursor on the peak of that resting breath cycle. The value for the V2-V1 function on the Lung Volumes channel is the tidal volume.
- Inspiratory Reserve Volume (IRV), by placing one cursor on the peak of the normal breath prior to the maximum inhalation and the second cursor on the peak of the forced breath cycle. The value for the V2-V1 function on the Lung Volumes channel is the inspiratory reserve volume.
- Forced Inspiratory Flow Rate, by keeping the cursors in the same positions used for measuring IRV. The value for the Max_dv/dt function on the Lung Volumes channel is the forced inspiratory flow rate.
- Forced Vital Capacity (FVC), by placing one cursor on the peak of the forced breath cycle and the second cursor on the flat line after the subject has expelled all the air from his or her lungs. The value for the V2-V1 function on the Lung Volumes channel is the forced vital capacity.
- Forced Expiratory Flow Rate, by keeping the cursors in the same positions used for measuring FVC. The value for the Min_dv/dt function on the Lung Volumes channel is the forced expiratory flow rate.
- Expiratory Reserve Volume (ERV), by placing one cursor in the trough before maximal inhalation and the second cursor on the flat line after subject has expelled all the air from his or her lungs. The value for the V2-V1 function on the Lung Volumes channel is the expiratory reserve volume
- Forced Expiratory Volume at 1 Second (FEV1), by placing one cursor on the peak of the maximum breath cycle and the second cursor on the data point that is one second after the peak. Use the T2-T1 function to determine the data point that is one second after the peak. The value for the V2-V1 function on the Lung Volumes channel is the forced expiratory volume at one second.
- Forced Expiratory Volume at 3 Seconds (FEV3), by placing one cursor on the peak of the maximum breath cycle and the second cursor on the data point that is three seconds after the peak. Use the T2-T1 function to determine the data point that is three seconds after the peak. The value for the V2-V1 function on the Lung Volumes channel is the forced expiratory volume at three seconds.
- Record these volumes and rates in the Forced Expiration Table.
- Calculate the subject’s FEV1/FVC ratio by dividing the subject’s FEV1value by his or her FVC value.
- Calculate the subject’s FEV3/FVC ratio by dividing the subject’s FEV3value by his or her FVC value.
- Compare the FEV1/FVC and FEV3/FVC ratios of the subject to the normal values of 0.80 and 0.95, respectively, for young healthy adults. Both of these ratios decrease with age.
-
- In obstructive airway diseases, like asthma, bronchitis, or emphysema, both FVC and FEV1are reduced, and FEV1/FVC ratios are usually less than 0.70.
- In restrictive lung diseases, like fibrosis, FVC is reduced. But, because of the low compliance and high recoil of the lungs, the FEV1/FVC ratio may be normal (~0.80) or greater than normal (>0.85).
- Record the FEV1/FVC and FEV3/FVC ratios in the table.
Exercise 2: Breathing While Standing
Aim: To measure various breathing parameters in a standing subject.
Procedure
Repeat Exercise 1 while the subject is standing.
Data Analysis
- Use the same techniques used in Exercise 1 to measure the data recorded in Exercise 2. Record the measurements on your Data Table. Report the appropriate measurements in the tables.
- Determine the values for the calculated parameters taken from the recordings of normal and forced breathing while standing. Report these values on the tables.
Exercise 3: Breathing While Supine
Aim: To measure various breathing parameters in a subject who is lying face up (supine).
Procedure
- The subject should lie down on their back and relax.
- Assist the subject when he or she is removing and replacing the flow Blue and white flow heads in his or her mouth. Place both of the flow heads on the bench top near the subject’s head in a position that prevents any air to move through either of the flow heads.
- Repeat Exercise 1 while the subject is supine.
Data Analysis
- Perform the same types of measurements on the data recorded in Exercise 3 as were performed on the data recorded in Exercise 1. Record the measurements on your Data Table. Report the appropriate measurements in the tables.
- Determine the values for the calculated parameters taken from the recordings of normal and forced breathing while supine. Report these values on the tables.
Please cite:
Haen Whitmer, K.M. (2021). A Mixed Course-Based Research Approach to Human Physiology. Ames, IA: Iowa State University Digital Press. https://iastate.pressbooks.pub/curehumanphysiology/
- Krumhardt, Ph.D.,M.T. (ASCP), B. (2013). Exercises in Human Physiology with Personal Health Assessment (Revised ed., p. 18). Redwood City, CA: Star Publishing Company, Inc. ↵
- Betts et al. Open Stax Anatomy and Physiology. 2013. Section URL: https://openstax.org/books/anatomy-and-physiology/pages/22-3-the-process-of-breathing ↵
