
1 The Electroencephalogram
Introduction to EEG
Karri Haen Whitmer
The electroencephalogram, or EEG, is a noninvasive method for recording the electrical activity of millions of neurons. The neurons, mostly pyramidal cells, are stratified in 3-5 layers, composing the outer-most section of the human cerebral cortex. EEG is a surface electrophysiology method, which employs recording electrodes placed upon the scalp, in a variety of configurations called montages.
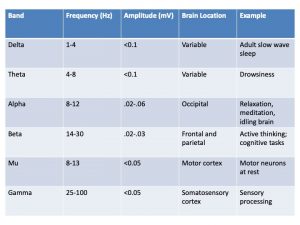
Unlike other biopotentials we have investigated in this text, EEG waves are described in several ways. Wave parameters include the standard measurements of frequency recorded in cycles per second (cps) or Hertz (Hz) and wave amplitude (in mV). Additionally, frequency may be described as a range of values, or EEG bands, including delta, theta, alpha, beta, mu, and gamma waves. Each EEG wave band has several characteristics associated with it (see Table 1).
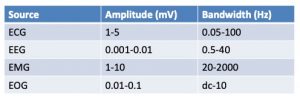
One major difference between the EEG and other surface electrophysiology methods is the amplitude of the recorded EEG waves. The fluctuations in voltage measured across the skull by the EEG are very small compared to the wave amplitudes recorded with ECG, EMG and even EOG (Table 2), making the EEG particularly prone to corruption by artifacts that must be filtered from the raw EEG data. Often, the more powerful EMG, ECG and EOG bursts are the source of these artifacts.
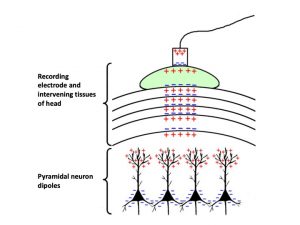
Another major difference between the EEG and other standard surface-based electrophysiological measurements is the source of the electrical activity being measured. Whereas other techniques like the EMG measure the action potentials of excitable cells, the EEG mainly records extracellular currents that arise from synaptic activity in the dendrites of neurons. These extracellular potentials are derived from excitatory and inhibitory postsynaptic potentials (EPSPs and IPSPs). For example, excitation of a postsynaptic neuron creates an extracellular voltage near the dendrite that is more negative than elsewhere along the neuron. This creates a dipole, that is, a region of positive charge separated from a region of negative charge. The positively charged region is referred to as a source, and the negatively charged region is referred to as a sink. If the source and sink are at different distances from the recording electrode, then the voltage difference can be measured. This means the neurons that elicit EEG recordings must be in a particular orientation with respect to the surface of the skull, where the recording electrode sits. Thus, EEG recordings typically emerge from pyramidal neurons oriented with cell bodies and axons perpendicular to the surface of the skull (Figure 1).
Electroencephalography technique
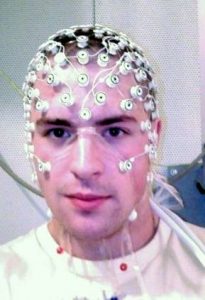
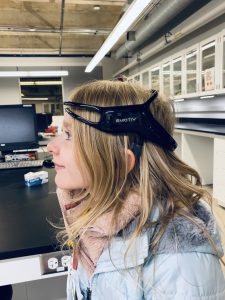
Scalp electrodes are placed at standard positions on the skull to assure the repeatability of EEG results. One standard EEG electrode array or montage is the “international 10–20 system.” EEG arrays place electrodes in reference to anatomical landmarks on the skull. For example, the nasion is the point between the forehead and nose, and the inion, the external occipital protuberance (ie., the bump at the back of skull), and right and left pre-auricular regions. The distances between skull landmarks are measured and electrodes are spaced at 10% or 20% of the total distances between them. High density electrode arrays are usually held in place by a cap (Figure 2). Traditional electrode arrays are cumbersome to set up and require constant maintenance during recording to keep electrodes in direct contact with the scalp and wet with electrically conductive salt solution. As the technology has advanced, more flexible methods of EEG recording have been developed. These methods allow for EEG monitoring under a variety of conditions that would not be possible using the traditional cap setup (for example, wireless EEG with semi-dry electrodes). The Emotive Insight headband represents a major innovation in the development of more flexible and affordable EEG technologies (Figure 3).
This week’s experiment:
In this week’s laboratory experiment, subjects will perform tasks that will allow observers to discriminate between alpha and beta EEG waves. Alpha and beta waves are present in EEG recordings of subjects who are awake.
Laboratory Methods for iWorx
Equipment Required: IXTA data acquisition unit, iWire-B3G cable with connected to the A-HB-IWIRE EEG Headband to record right and left EEG from the forehead. Use with SignaGel electrode gel.
I. Equipment Setup
- Start the software: Turn on the iWorx hardware box at the switch on the back, and select the Week10_EEG.iwxset file from the P-drive.
- You may elect to clean the forehead with an alcohol pad before placing the EEG headband. The electrodes are embedded in the headband; thus, disposable electrodes are not needed.
- Place a small dot of electrode gel on the inside of the headband on each metallic disc (electrode).
- Note the electrode leads will already be attached to the headband.
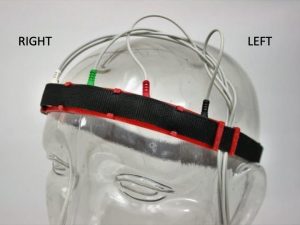
- Note that the BLACK electrode will be proximal to the LEFT ear, and the GREEN electrode should be situated in the middle of the forehead or nasion (Figure 4).
- Tighten the headband on the forehead with the band passing just over the brows. Push hair out of the way if it comes between the skin and the electrodes.
- Drape the leads loosely around the side of the face. Do not pull on or affix the leads in any way.
- The subject should sit quietly with their hands in their lap.
Exercise 1: Alpha and Beta EEG Bands
The alpha and beta EEG bands can be easily observed from both hemispheres of a subject who is awake. This experiment will analyze the differences between the alpha and beta waveforms.
Tips for recording a successful EEG
Here are several important notes for EEG recordings:
- The subject should not blink excessively, perform hard blinks (squints), or move the facial muscles during this experiment.
- The subject should not talk or move their head during recording.
- The subject should allow the mind to drift as if in deep relaxation during the eyes closed condition. Do not focus on what is occurring in the room around you.
- Experimenters should communicate as quietly as possible during this experiment. Avoid making loud noises during your recording, and the recordings of others.
Procedure:
- Ask the subject to sit quietly and to avoid any unnecessary movement during the EEG recording.
- The subject should have their eyes open for the first part of this recording.
- Click record and autoscale all windows to adjust the data view.
- Type the letter O for “eyes open” in the mark box and press enter.
- Record data for 60 seconds.
- At the 60 second mark, ask the subject to close their eyes and enter the letter C for “eyes closed” in the mark box and press enter.
- Record the data for another 60 seconds and click stop.
Data analysis:
- Scroll through the eyes open data and find an area that is free from artifacts.
- Use the display time function to display TEN SECONDS of artifact free data, or, you may use two cursor mode to flank the 10-seconds of data.
- Enter the Max-Min amplitude in mV for the “Eyes Open” condition for the Left Alpha, Left Beta, Right Alpha, and Right Beta parameters in lab report Table 1.
- Enter the Mean frequency (found under Mean) for the same selected data region and enter the data for the Left Alpha, Left Beta, Right Alpha, and Right Beta parameters in the table.
- After recording all values for the eyes open condition, scroll to the Eyes Closed data, select 10 seconds of artifact free data, and complete steps 3 and 4, recording the data in the table for the Eyes Closed condition.
- Answer the questions in your lab report about how to discern the distinct types of EEG waves.
Exercise 2: Alpha Block
After completing Exercise 1, you now know what alpha and beta waves look like on the normal EEG. A condition called “alpha block” occurs when a subject’s eyes are closed, but the subject is performing a mental task. When the subject becomes focused on a problem solving task, the alpha wave pattern extinguishes and the beta pattern reappears, as if the eyes were open. Alpha block indicates higher level cortical arousal despite the eyes being closed.
Important procedure notes: In this experiment the subject will be asked to recall details from class in order to perform a mental task. The subject should only visualize the problem, they should not speak during the experiment except when they have completed their mental task to communicate they are done.
Procedure:
- Ask the subject to sit quietly with eyes closed and to avoid any unnecessary movement during the EEG recording.
- Click record.
- The subject should sit in a relaxed state with eyes closed for the first 60 seconds of EEG recording.
- At the 60 second mark ask the subject to recall and visualize a complicated mechanism from lecture as much as they can (see the experiment notes below).
- The subject should take as much time as they need to work the problem.
- Continue recording.
- When the subject has completed working out the mental problem, the subject should indicate they are done by saying “I’m done.” Note: the subject should think about the problem for at least a minute in order to record a reliable EEG trace.
- Stop the recording.
Experiment notes
In this experiment the experimenter must ask the subject to recall a detailed mechanism from class in order to give the subject a “problem” to work through mentally. Here are some possibilities to ask your subject:
- In as much detail as possible, recall the steps of the action potential.
- Recall the steps of synaptic transmission.
- Recall the mechanism for muscle contraction.
- Think about all the organelles of the cell and their functions.
- Think about the different systems of the human body and their functions.
- Recall the components of blood and their functions.
- Recall the names of the 50 states, and similar lists, work as well.
Data analysis:
- Scroll through the first 60 seconds of data. This data should appear the same as the original data for the eyes closed condition in Experiment 1.
- Zoom in on 10 seconds of artifact free data within the first 60 seconds of recording, and enter the Max-Min and Mean measurements in Table 2, under the eyes closed/relaxing condition, in the lab report. This is the same procedure used for the eyes closed condition in Experiment 1.
- Scroll to the second half of the recording, after the 60 second mark where the subject has begun working their mental problem (but before the subject has stated they are done).
- Select 10 seconds of data and enter the Max-Min and Mean for the “problem solving” condition in Table 2.
Please cite: Haen Whitmer, K.M. (2022). A Mixed Course-Based Research Approach to Human Physiology. Ames, IA: Iowa State University Digital Press. https://iastate.pressbooks.pub/curehumanphysiology/
