
Auditory and Visual Pathways
Reaction Times
Karri Haen Whitmer
The nervous system allows us to detect changes in the environment and react to them. An external stimulus is detected by a receptor, which sends sensory information to the central nervous system, where it is processed. If a motor response is initiated, it usually involves a series of action potentials which produce muscle contraction and movement in one or more parts of the body. A reflex is the most simple stimulus-response reaction. A loud sound or something flying at your eye makes you blink, while a tap on the tendon under the knee cap produces the knee-jerk (or myotactic) reflex.

A simple reflex like the myotactic reflex is produced via single synapses between sensory axons and motor neurons. The required circuitry for this reflex is confined to the spinal cord, as shown in Figure 1. Sensory information also ascends to higher centers, but the brain is not necessary or required to perform the reflex. More complex reflexes usually involve additional (inter-) neurons and more than one population of motor neurons. Thus, more neurons and synapses are involved, which usually results in a longer delay between stimulus and response and often a more complex response. One example of such a complex response is the flexion withdrawal reflex, where a noxious stimulus to one leg causes withdrawal of the stimulated leg and extension of the other.
Visual and Auditory Reflexes & Reaction Times
Now that we understand neural transmission and synapses involved in basic reflexes, we can begin to ask how nerve cells are assembled into more complex structures like pools, circuits, and pathways. Stimulus on the nervous system exerts its effects on special cells called receptors. These cells are modified to respond to “outside information” rather than to synaptic inputs from other nerve cells. Outside information can take the form of light entering our eyes; of mechanical deformation to cells in the cochlea or vestibule due to sound or pressure waves; or of chemicals, as in our sense of smell or taste. In all these cases, the effect of the stimulus is to produce an electrical signal in the receptors and consequently a modification in the rate of neurotransmitter release at their terminals.
The visual and auditory systems work separately and in combination with each other to inform and guide the body’s internal and external actions. Sometimes responses to light or sound are simple and are considered reflexes. Other pathways contain more neurons and require more processing in the higher brain centers.
Auditory reflexes encompass reflexes initiated by auditory stimuli. When focus is required, auditory reflexes instantaneously block out unnecessary sound frequencies, and when general auditory awareness is required, the auditory reflexes expand sound frequency access to ensure the central nervous system is provided with all the information it needs to respond appropriately. Other auditory reflexes involve involuntary motor responses to sound, such as the orientation reflex (involuntary head turn for locating the source of an unexpected sound) and the startle reflex (an inborn protective reflex).
The visual system distinguishes variations in shape, color, brightness, movement, helping to distinguish familiar people, places and things from unfamiliar, to determine relative location, and detect visual input important to daily function and general survival. Visual reflexes adjust instantaneously from static and dynamic visual input that is near or far, blocking out extraneous visual input when visual concentration and focus are required, while remaining vigilant to unusual visual input important to productive functioning and general safety. While the visual and auditory sensory systems each provide the body access to unique forms of stimulus input, they also work together to coordinate “seeing-hearing” information and with each of the other sensory systems to inform and prioritize input for the central nervous system to guide and direct action in response to ever-changing conditions. Due to a number of issues the auditory and visual systems can become hypersensitive or hyposensitive or simply not function.
Neural Pathways for Vision
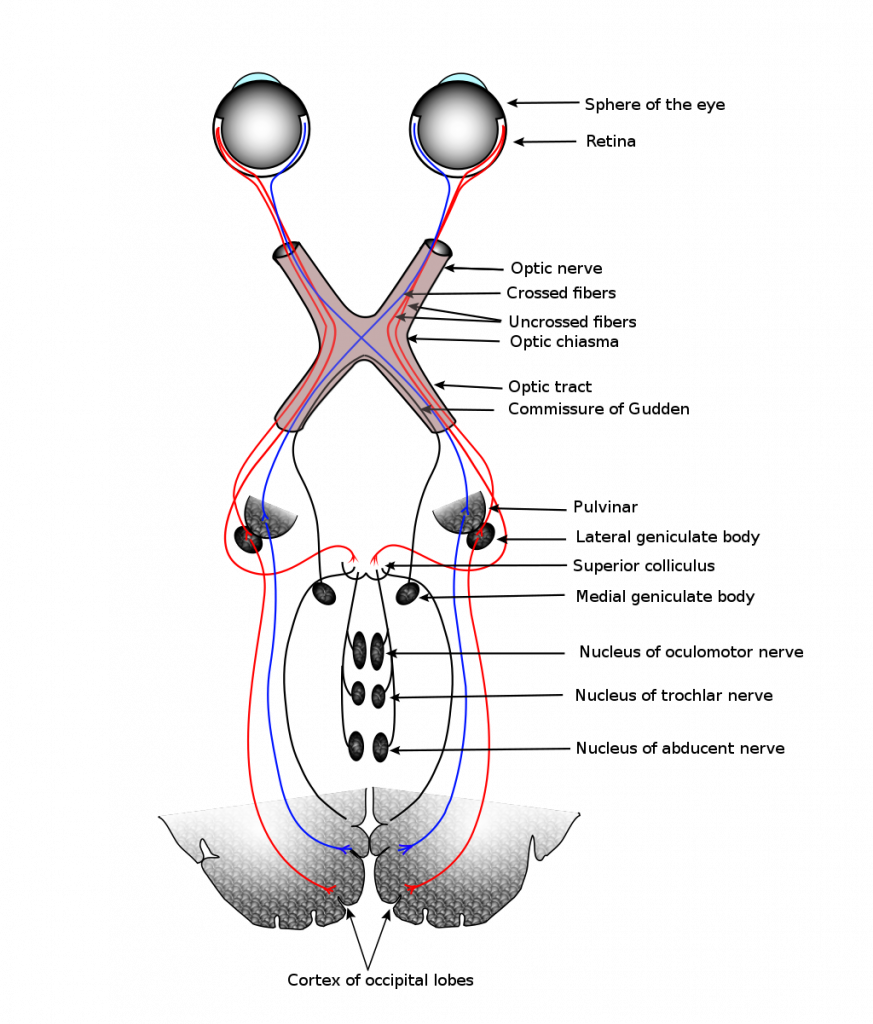
Perception of incoming light begins when the photons are detected by the retina’s photoreceptors (rods and cones). In the most-simple pathway, photoreceptors synapse with bipolar cells, which then synapse with the retinal ganglion cells that exit the back of the eye as the optic nerve (cranial nerve II).
The two optic nerves exit each eye at the optic disk and combine at the base of the brain just in front of the brainstem to form the optic chiasm (Figure 2). In the optic chiasm, half of the axons from each eye cross over, or decussate, to the other side of the brain. Note in the figure below that input from the left visual field strikes the nasal retina (side closest to the nose) of the left eye and the temporal retina (side closest to the side of the head) of the right eye. Likewise, input from the right visual field strikes the nasal retina of the right eye and the temporal retina of the left eye. Therefore, both eyes receive information from both visual fields.
In the optic chiasm, axons originating from nasal ganglion cells cross to the opposite side, whereas axons originating from temporal ganglion cells stay on the side of origin. The result is that after the optic chiasm, all input from the right visual field travels in axons in the left side of the brain, and all input from the left visual field travels in axons in the right side of the brain.
Although the axons are still those of ganglion cells, after the optic chiasm the axons travel in what is called the optic tract. The ganglion cells terminate in a nucleus in the thalamus called the lateral geniculate body, where they form synapses with neurons that ascend to the primary visual cortex in the occipital lobe. Pathways from the lateral geniculate body to the visual cortex on either side are called the optic radiations.
To simplify the visual pathway, we note that photoreceptors synapse with 1) bipolar cells in the retina. Retinal bipolar cells synapse with 2.) retinal ganglion cells. From here, the axons of ganglion cells may decussate at the optic chiasma or remain on the ipsilateral side and synapse with 3.) neurons of the lateral geniculate body of the thalamus, which form optic radiations. 4.) The optic radiations synapse on the primary visual cortex (V1) in the occipital lobe of the brain, which is physically very far from the photoreceptors of the retina. You can approximate this distance by measuring from your eyes to the occipital region of the skull. For conscious awareness of visual information, additional processing must take place in the brain cortex, including several visual processing areas (V1-V6), which add many other synapses to this pathway.
Neural Pathways for Sound
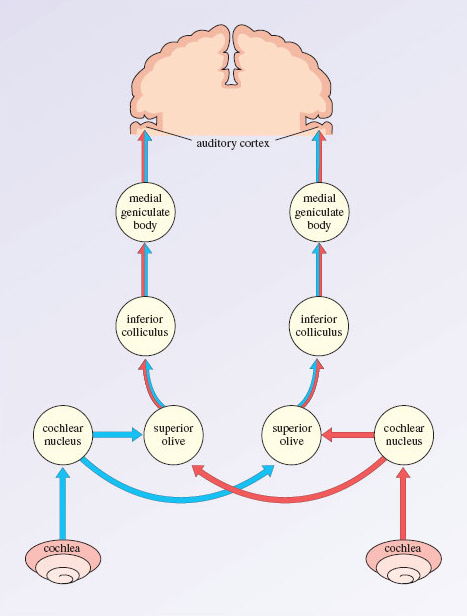
Sound, or disturbances in the distribution of air molecules, is converted into pressure waves inside the cochlea. As the pressure waves vibrate the cochlear membranes, the tectorial membrane of the cochlear duct contacts and bends the stereocilia of auditory hair cell receptors.
When hair cells are bent, the neurotransmitter, usually glutamate, released from hair cells binds to receptors on afferent neurons of the cochlear nerve, part of cranial nerve VIII. The hair cell transmitter depolarizes the afferent neuron. The greater the degree of depolarization, the greater frequency of action potentials in the afferent neuron, which therefore codes for the intensity of the sound.
The afferent neurons of the auditory nerve terminate in the cochlear nuclei in the brainstem. From here, the auditory pathway can be complex. The simplified figure (below), shows secondary neurons passing through the auditory reflex centers of the inferior colliculi and synapsing with third-order neurons that travel to a nucleus of the thalamus called the medial geniculate body. In the medial geniculate body, the third-order neurons form synapses with quaternary neurons that transmit information to the auditory cortex in the temporal lobe, resulting in the conscious recognition of sound.
To simplify the auditory pathway: 1.) hair cell receptors synapse with a cochlear branch of the vestibulocochlear nerve. 2.) These fibers then terminate in the cochlear nucleus and synapse with secondary neurons that ascend to the inferior colliculus. 3.) Tertiary neurons extend to the thalamus and synapse with 4.) quaternary neurons that project into the auditory cortex. Note that the overall path length of the auditory pathway is relatively short because the inner ear is proximal to the temporal lobe of the brain, and relatively little additional cortical processing is required for the conscious recognition of auditory stimulus (short pathway, few synapses).
In this laboratory, we will examine the reaction times for auditory and visual responses to stimulus. The reaction time is simply the time required for processing between a visual or auditory stimulus and a response. We can compare this information to our anatomy knowledge of the number of synapses in a pathway, and the path length, to determine what type of information is processed faster by the human body. Reaction time measurements will be taken from an individual subjected to harmless visual and sound stimuli. In addition, the effect of priming and prediction may be examined.
Laboratory Methods for iWorx
Auditory and Visual Reaction Times Methods
Set-Up:
- Turn on the iWorx box.
- Click on the Week 8 Settings file in the P-Drive. (Click “this PC” and double click the Biol 256L Course Materials P Drive under “Network Locations). If you have trouble finding the file, it is also in the Week 08 Materials Link cybox folder.
- Save this file to your Desktop Folder.
Exercise 1: Reaction Time and Visual Cues
Aim: To measure the reaction time of a subject to a VISUAL CUE.
Procedure
- READ ALL METHODS carefully before beginning to record.
- Information for the SUBJECT:
- Instruct the subject to sit in a chair and face the computer screen.
- He or she should position a hand on the keyboard in a manner that enables the subject to push the F1 key as quickly as possible.
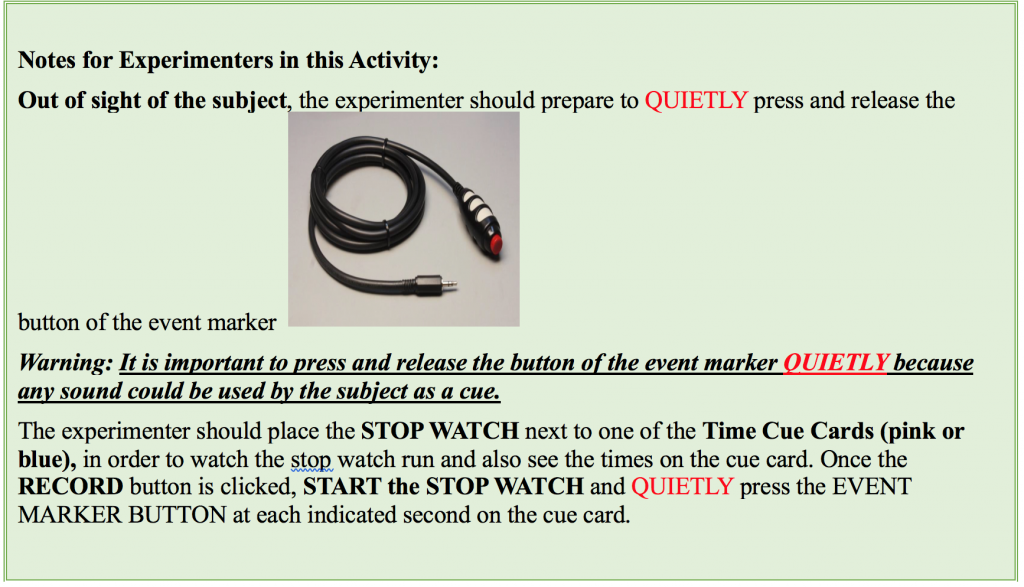
- Watch the RIGHT SIDE of the computer screen and quickly press the F1 key on the keyboard when the signal generated by the event marker first appears.
- Click on the RECORD button.
- Type <Subject’s Name> Visual Cues in the Mark box to the right of the Mark button. Press the Enter key to mark the recording.
- Instruct the subject to press the F1 key to mark the recording as soon as he or she sees the visual cue on the Right side of the computer screen (Methods Figure 1).
- Instruct the subject that the exercise has begun and that a visual cue could appear on the screen at any time.
- Use the event marker to deliver ten visual cues to the subject. The cues should not be less than five seconds nor more than ten seconds apart. Just follow the pink or blue Time Cue Card using the provided timer.
- After the tenth cue, click Stop to halt recording.
- Select Save As in the File menu, type a name for the file. Choose a destination on the computer in which to save the Data File, like your lab group folder. Click on the Save button to save the data file.
Data Analysis
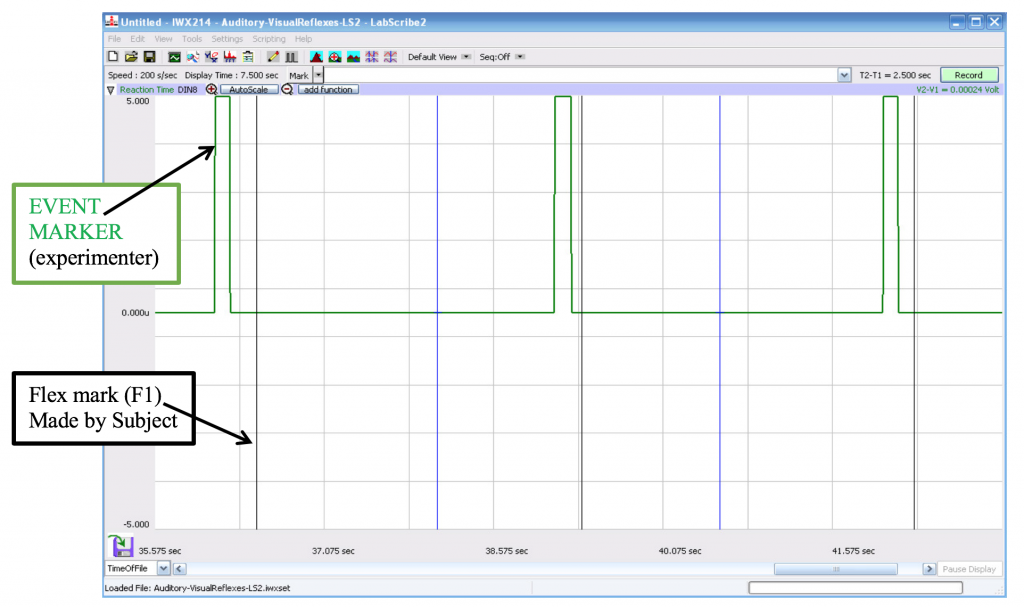
- Scroll to the beginning of the data recorded for Exercise 1 to display the first trial on the Main window.
- If you stay on the Main Window screen to gather data, look to the right-hand corner of the screen for T2-T1=msec for your time data.
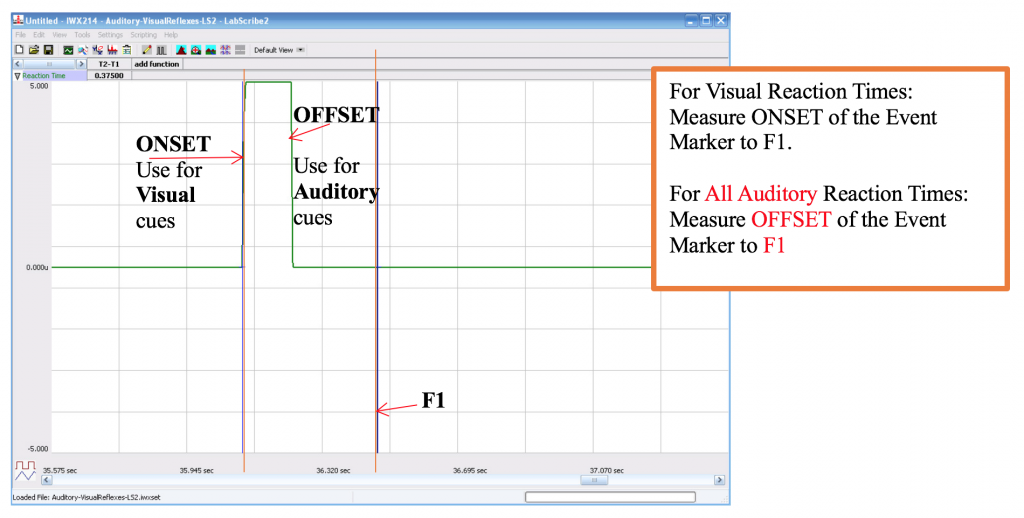
- Use the mouse to click on and drag a cursor to the ONSET of the signal used as the visual cue. Drag the other cursor over the mark made by the subject (F1). See Methods Figure 2.
- Once the cursors are placed in the correct positions for determining the reaction time, record the value for T2-T1 on your Lab Report Worksheet.
- Once the reaction time in the first trial is measured and recorded, move to the data from the second trial.
- Use the same techniques used in Steps 2 through 4 to measure the reaction times from the other eight trials.
- Once the reaction times in all ten trials have been measured and recorded, discard the longest and shortest times from the data set, and determine the average of the eight remaining reaction times. Record the mean reaction time for this exercise in the table on your Lab Report.
Exercise 2: Reaction Time and Auditory Cues
Aim: To measure the reaction time of a subject to an AUDITORY CUE.
Procedure
- Position the subject to prevent her/him from seeing any signal on the screen as a visual cue. Have the subject sit with their back to the screen and the computer key board within reach.
- Instruct the subject to:
- Sit in a chair in front of the computer keyboard.
- Position a hand on the keyboard in a manner that enables the subject to push the F1 key as quickly as possible.
- Listen for the click (sound) of the event marker as an experimenter presses the button and then press the F1 key as quickly as possible. (Out of sight of the subject, the experimenter taps the button of the event marker to create the auditory cue that is recorded as a signal on the Reaction Time channel. Make sure the student with the event marker in no way making contact with the student being tested.) In this exercise, the subject will perform ten trials.
- Click on the RECORD button.
- Type Auditory Cues and Subject’s Name in the Mark box that is to the right of the Mark button and click Enter.
- Instruct the subject that the exercise has begun and that an auditory cue could be heard at any time.
- Use the event marker to deliver ten auditory cues to the subject. Follow the times on the Time Card (pink or blue, using the timer). The cues should not be less than five seconds nor more than ten seconds apart.
- Instruct the subject to press the F1 key to mark the recording as soon as he or she hears the auditory cue made from the clicking of the event marker.
- After the tenth cue, Click Stop to halt recording.
- Select SAVE in the File menu.
Data Analysis
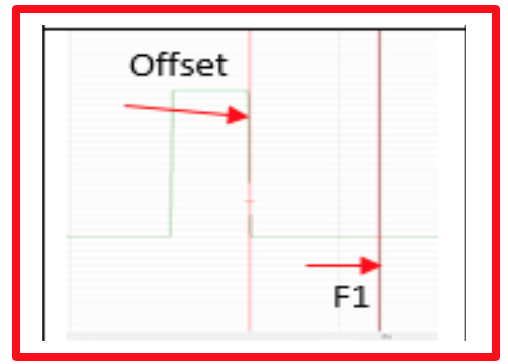
- Measure from the OFFSET to F1 to measure and record the reaction times of the subject presented with auditory cues and all Auditory exercises from this point forward.
- Enter the mean reaction time for this exercise in the table on your Lab Report.
Exercise 3: Reaction Time and Prompted Auditory Cues
Aim: To measure the reaction time of a subject to an auditory cue delivered immediately AFTER a verbal prompt.
Procedure
Repeat Exercise 2 with THIS additional step. Before each auditory cue is delivered, tell the subject to GET READY to respond to the cue. It is best to use a one or two word cue directly before clicking the event marker button.
Data Analysis
- Use the same technique explained in Exercise 2 to measure and record the reaction times of the subject presented with prompted auditory cues.
- Enter the mean reaction time for this exercise in the table on your Lab Report.
Exercise 4: Reaction Time and Predictable Auditory Cues
Aim: To measure the reaction time of a subject to auditory cues delivered at a predictable interval.
Procedure
Repeat Exercise 2 with a predictable interval of FIVE SECONDS between each auditory cue. Use the WHITE time card and the timer.
Data Analysis
- Use the same technique explained in Exercise 2 to measure and record the reaction times of the subject presented with predictable auditory cues.
- Enter the mean reaction time for this exercise in Table HN-1-L1 on your Lab report.
Please cite:
Haen Whitmer, K.M. (2021). A Mixed Course-Based Research Approach to Human Physiology. Ames, IA: Iowa State University Digital Press. https://iastate.pressbooks.pub/curehumanphysiology/
