
Body Temperature Homeostasis: Cold Pressor Test
Cold Stress and the Cold Pressor Test
Karri Haen Whitmer
Maintaining homeostasis requires that the body continuously monitors its internal conditions. From body temperature to blood pressure to levels of certain nutrients, each physiological condition has a particular set point. A set point is the physiological value around which the normal range fluctuates. A normal range is the restricted set of values that is optimally healthful and stable. For example, the set point for normal human body temperature is approximately 37°C (98.6°F). Physiological parameters, such as body temperature and blood pressure, tend to fluctuate within a normal range a few degrees above and below that point. Control centers in the brain and other parts of the body monitor and react to deviations from homeostasis using negative feedback. Negative feedback is a mechanism that reverses a deviation from the set point. Therefore, negative feedback maintains body parameters within their normal range. The maintenance of homeostasis by negative feedback goes on throughout the body at all times.
The human body regulates body temperature through a process called thermoregulation, in which the body can maintain its temperature within certain boundaries, even when the surrounding temperature is very different. The core temperature of the body remains steady at around 36.5–37.5 °C (or 97.7–99.5 °F). In the process of ATP production by cells throughout the body, approximately 60 percent of the energy produced is in the form of heat used to maintain body temperature. Thermoregulation is an example of negative feedback.
The hypothalamus in the brain is the master switch that works as a thermostat to regulate the body’s core temperature (Figure 1). If the temperature is too high, the hypothalamus can initiate several processes to lower it. These include increasing the circulation of the blood to the surface of the body to allow for the dissipation of heat through the skin and initiation of sweating to allow evaporation of water on the skin to cool its surface. Conversely, if the temperature falls below the set core temperature, the hypothalamus can initiate shivering to generate heat. The body uses more energy and generates more heat. In addition, thyroid hormone will stimulate more energy use and heat production by cells throughout the body. An environment is said to be thermoneutral when the body does not expend or release energy to maintain its core temperature. For a naked human, this is an ambient air temperature of around 84 °F. If the temperature is higher, for example, when wearing clothes, the body compensates with cooling mechanisms. The body loses heat through the mechanisms of heat exchange.
Mechanisms of Heat Exchange
When the environment is not thermoneutral, the body uses four mechanisms of heat exchange to maintain homeostasis: conduction, convection, radiation, and evaporation. Each of these mechanisms relies on the property of heat to flow from a higher concentration to a lower concentration; therefore, each of the mechanisms of heat exchange varies in rate according to the temperature and conditions of the environment.
Conduction is the transfer of heat by two objects that are in direct contact with one another. It occurs when the skin comes in contact with a cold or warm object. For example, when holding a glass of ice water, the heat from your skin will warm the glass and in turn melt the ice. Alternatively, on a cold day, you might warm up by wrapping your cold hands around a hot mug of coffee. Only about 3 percent of the body’s heat is lost through conduction.
Convection is the transfer of heat to the air surrounding the skin. The warmed air rises away from the body and is replaced by cooler air that is subsequently heated. Convection can also occur in water. When the water temperature is lower than the body’s temperature, the body loses heat by warming the water closest to the skin, which moves away to be replaced by cooler water. The convection currents created by the temperature changes continue to draw heat away from the body more quickly than the body can replace it, resulting in hypothermia. About 15 percent of the body’s heat is lost through convection.
Radiation is the transfer of heat via infrared waves. This occurs between any two objects when their temperatures differ. A radiator can warm a room via radiant heat. On a sunny day, the radiation from the sun warms the skin. The same principle works from the body to the environment. About 60 percent of the heat lost by the body is lost through radiation.
Evaporation is the transfer of heat by the evaporation of water. Because it takes a great deal of energy for a water molecule to change from a liquid to a gas, evaporating water (in the form of sweat) takes with it a great deal of energy from the skin. However, the rate at which evaporation occurs depends on relative humidity—more sweat evaporates in lower humidity environments. Sweating is the primary means of cooling the body during exercise, whereas at rest, about 20 percent of the heat lost by the body occurs through evaporation.
Homeostatic Response to Environmental Temperatures
Humans have a temperature regulation feedback system that works by promoting either heat loss or heat gain. When the brain’s temperature regulation center receives data from the sensors indicating that the body’s temperature exceeds its normal range, it stimulates a cluster of brain cells referred to as the “heat-loss center.” This stimulation has three major effects:
- Blood vessels in the skin begin to dilate allowing more blood from the body core to flow to the surface of the skin allowing the heat to radiate into the environment.
- As blood flow to the skin increases, sweat glands are activated to increase their output. As the sweat evaporates from the skin surface into the surrounding air, it takes heat with it.
- The depth of respiration increases, and a person may breathe through an open mouth instead of through the nasal passageways. This increases heat loss from the lungs.
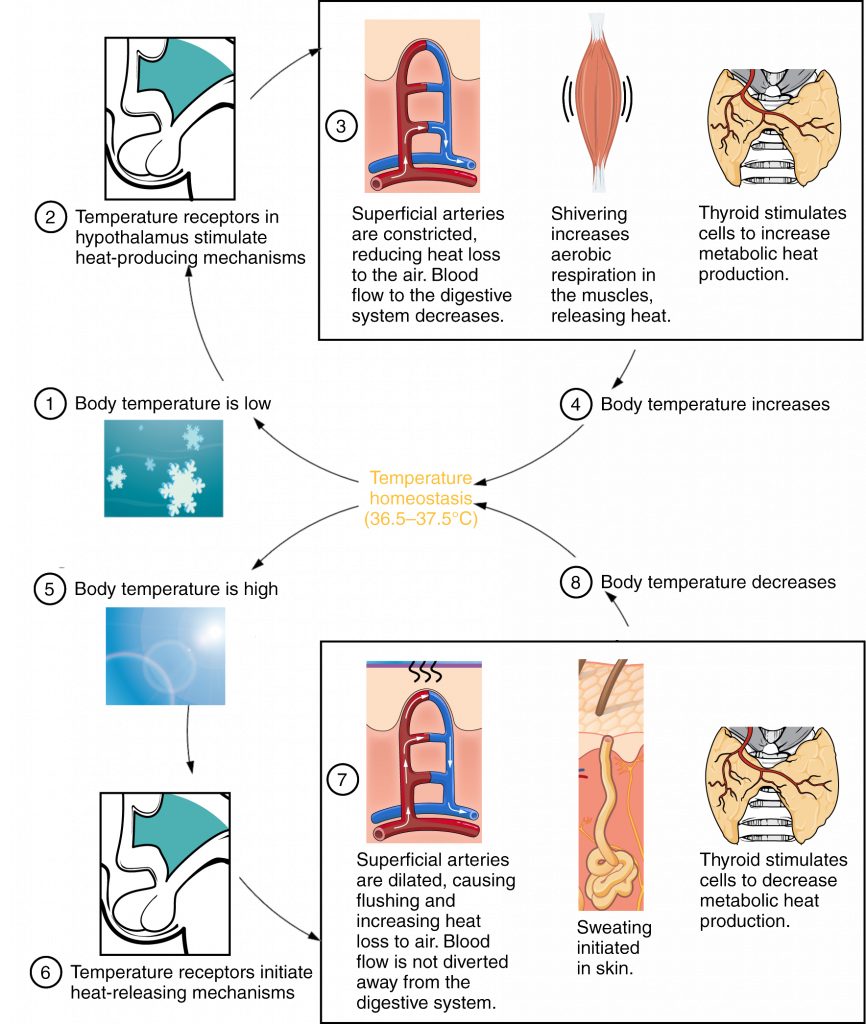
In contrast, activation of the brain’s heat-gain center by exposure to cold reduces blood flow to the skin, and blood returning from the limbs is diverted into a network of deep veins (Figure 2). This arrangement traps heat closer to the body core, restricts heat loss, and increases blood pressure. If heat loss is severe, the brain triggers an increase in random signals to skeletal muscles, causing them to contract and producing shivering. The muscle contractions of shivering release heat while using ATP. The brain also triggers the thyroid gland in the endocrine system to release thyroid hormone, which increases metabolic activity and heat production in cells throughout the body.
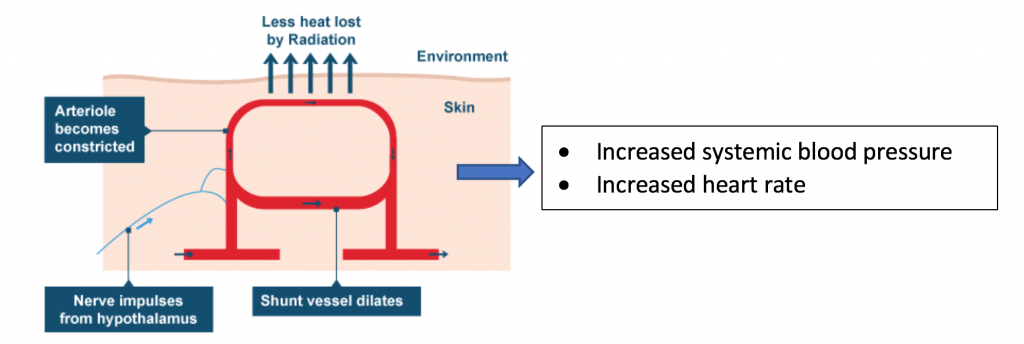
During acute exposure to cold conditions in the body:
- Activation of the sympathetic nervous system results in system-wide discharge of catecholamine (norepinephrine).
- Catecholamine causes systemic arteriolar constriction, increased heart rate and heart contractility. The heart works harder to push blood through the narrowed blood vessels.
- Constricted blood vessels in the extremities divert superficial blood flow to the body’s core, thus, reducing the radiation or conduction of heat into the environment.
- Vasoconstriction increases the resistance to blood flow, and thus, increases blood pressure.
- Vasoconstriction leads to a weaker pulse (lower pulse amplitude) in the arteries of the skin, fingers and hand.
The Cold Pressor Test
Acute cold stress results in activation of the sympathetic nervous system and release of catecholamines (neurotransmitters). The release of neurotransmitter effects the cardiovascular system in a number of ways, including arterial constriction, transient tachycardia, and increased contractility of the heart. Together, these homeostatic changes result in what is called a pressor response, or an increase in blood pressure. The cold pressor test is commonly used in the clinical setting to evaluate the function of the sympathetic nervous system. In the cold pressor test, subjects immerse their hand or forearm in ice water, and their cardiovascular response is measured.
In this laboratory, we will use the cold pressor test to evaluate changes in heart rate, pulse amplitude, and arterial oxygen saturation using a pulse oximeter.
Pulse oximeters indirectly estimate the arterial oxygen saturation and report it as the oxygen saturation (SpO2) of the subject’s arterial blood. SpO2 is reported as a percentage of oxygenated hemoglobin. Normal pulse oximetry values typically range from 97-100%.
Cold pressor response experiment:
There are several hypotheses that could be testing In this laboratory. For example, we may test whether males and females have a different cold pressor response, or we may test whether the pressor response is the same in the submerged versus the non-submerged hand. After collecting the data, you will enter it into an excel file at the TA’s bench for a class-wide or course-wide statistical analysis.
In preparation for lab, can you write an IF/THEN hypothesis for testing the cold pressor response in men and women?
Laboratory Methods
Exercises
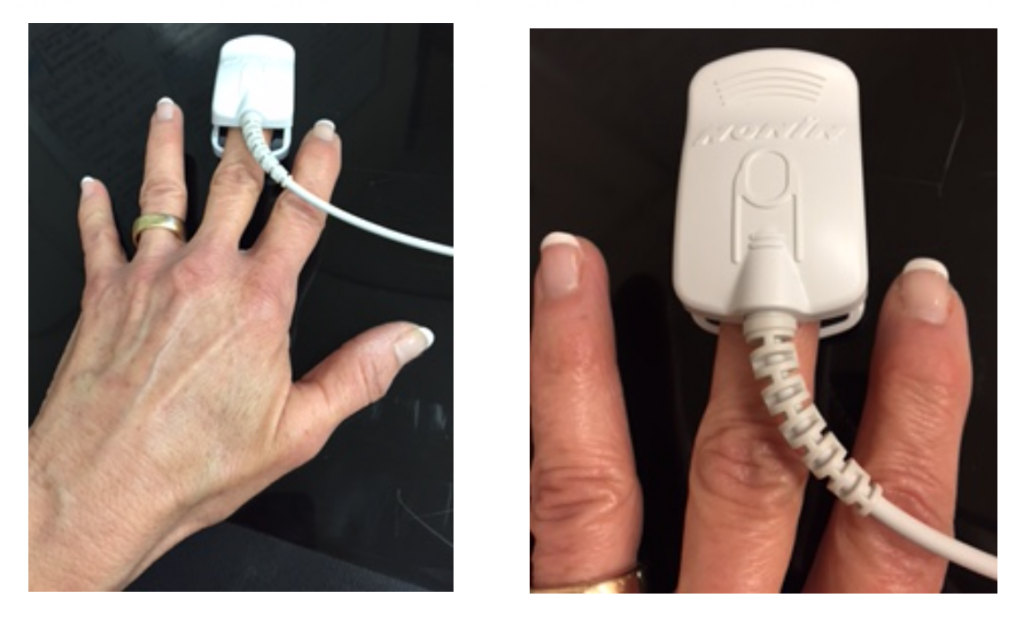
In this lab you will conduct an experiment to test how acute cold exposure affects pulse amplitude, heart rate and hemoglobin-oxygen binding in men and women. You will be using a finger sensor called a pulse oximeter, which will measure the pulse as well as the peripheral arterial blood oxygenation (SpO2) in your finger.
Lab activity highlights
- We will use iWorx with LabScribe to interpret pulse amplitude, heart rate and SpO2.
- Subjects should not wear nail polish, artificial nail coverings, hand or wrist jewelry during the experiment.
- Subjects must wear short sleeves or sleeves that can be rolled up above the elbow.
- All subjects will participate in either “Baseline/Condition 1” or “Baseline/Condition 2” but not both.
- All subjects will submerge their LEFT forearm in the experiments.
- Because the pulse oximeter works by detecting pulsation of blood vessels, subjects should sit quietly and motionless during the experiment. Other movements or vibrations could confound the pulse oximeter readings.
Getting Started
- Turn on the iWorx unit at the switch on the back of the box
- Log into your account and click the Folder icon in the lower left task bar
- Click “This PC” in the left side task bar
- Double click Biol 256L Course Materials P-Drive under “Network Locations”
- Double click the “Week4_ColdPressor” settings file
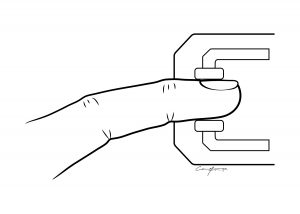
- Place the pulse oximeter on the middle finger of the left (condition 1) or right (condition 2) hand as shown in the figure below.
- You are now ready to start the experiment.
EXPERIMENT: Effects of Cold Pressor Test on Cardiovascular Functioning
IMPORTANT: This experiment requires half of the subjects to participate in Baseline/Condition 1 and half of the subjects to participate in Baseline/Condition 2. At your lab table, assign each student a condition before starting the experiment.
- CONTROL/CONDITION 1: Outfit the middle finger of the left hand with the pulse oximeter. Be prepared to submerge the left forearm in ice water at the one-minute mark.
- CONTROL/CONDITION 2: Outfit the middle finger of the right hand with the pulse oximeter. Be prepared to submerge the left forearm in ice water at the one-minute mark.
PART I. Procedure
- Check the sensor: click on the red Record
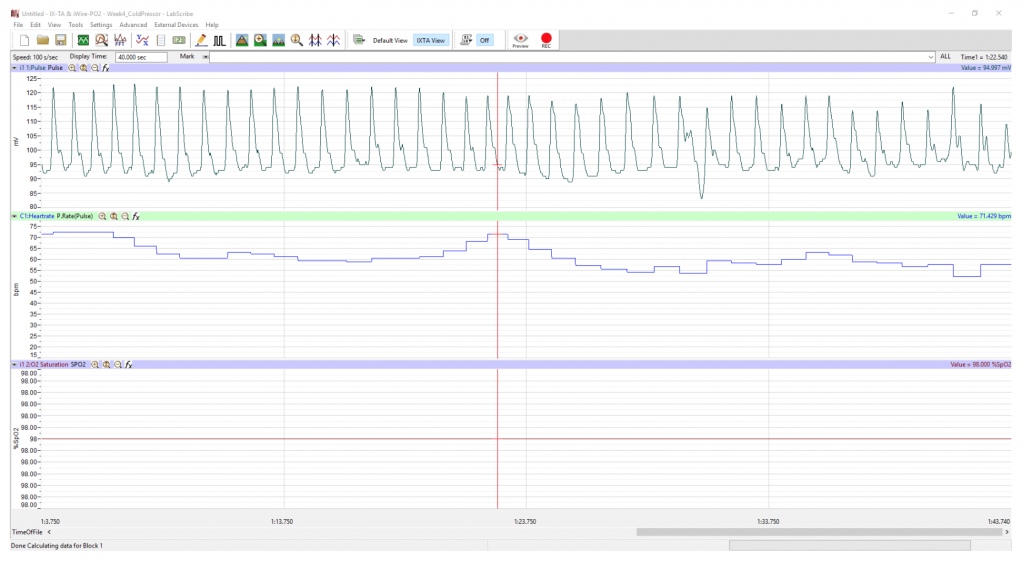
- Click on the AutoScale button at the upper task bar. Your recording should look like the traces seen below in Figure 5. If the data does not appear as shown, slightly adjust the oximeter on the finger.
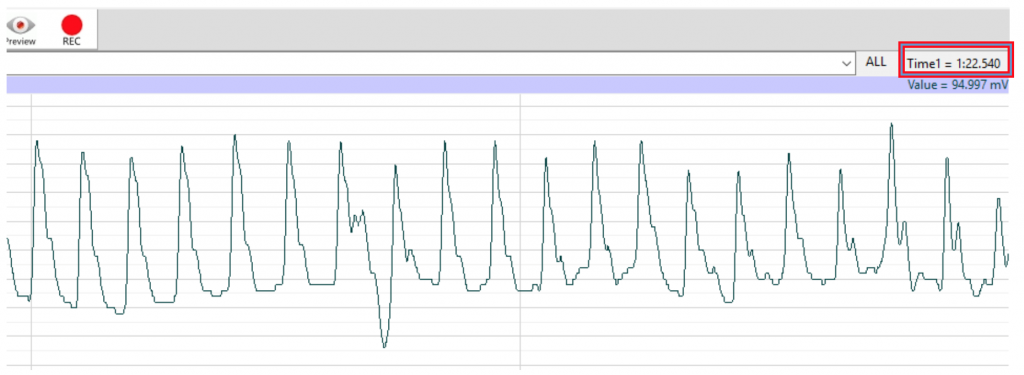
- Note the location of the Time in the upper right corner of the window (Fig. 5b). In the figure, the time reads “one minute and twenty-two seconds.” You will keep track of the time of the data recording with this timer on the Labscribe window.
- When the signals being recorded are suitably displayed, stop the recording and open a new file.
- As the subject sits quietly (without moving) record baseline data for one minute.
- At exactly the one-minute mark, submerge the left forearm in the ice water. DO NOT put the hand with instrumentation in the water. Remain as still as possible!
- Record the data for at least an additional 35 seconds (you may record more).
- Stop recording.
- You may dry your arm off and warm it on a heating pad. You are done serving as subject after a single exposure to the ice bath.
- Save the data file to the computer. Put the subject’s name and Week 4 in the title.
PART II. Data Analysis
This data analysis applies to both the baseline recording and to Condition 1 or 2. For baseline data, start at the very beginning of the recording and find the correct data by scrolling and using the timer on the main window.
For the experimental data (condition 1 or 2), start data analysis at the 1.00 mark and scroll to 1.05 (five seconds), 1.10 (ten seconds), 1.20 (twenty seconds) and 1.30 (thirty seconds).
To begin the data analysis:
- Calibrate the pulse channel.
- Set the time in the Display time window to 120 seconds and then click the Autoscale button in the channel window.
- Click on the P. Rate (Pulse) on the Heart Rate channel and select Setup Function
- When the window opens drag the blue lines so that the top line is just below the peaks of the ALL the pulse waves and the bottom line is slightly below the blue line (see figure below). It is very important that you see ALL of your data so that you can properly align the blue lines. Click OK.
Analysis
- Use the Display Time icon to adjust the Display Time of the Main window to show approximately ten complete Pulse cycles on the Main window.
- Scroll through the recording to view exemplary pulse waves at these intervals during data recording: 5 seconds, 10 seconds, 20 seconds and 30 seconds
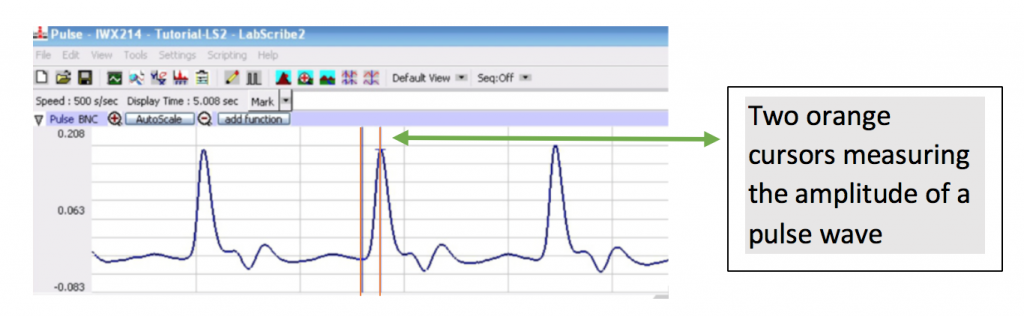
- Start at a pulse wave at around 5 seconds of data recording and click the double cursor icon and place the cursors as follows:
- To measure the pulse wave amplitude, place one cursor on the baseline that precedes the pulse wave and the second cursor on the peak of the pulse wave. The value for V2-V1 on the Pulse channel is this amplitude. Determine the pulse amplitude V2-V1 for the four pulse waves at the designated times and record the results in your lab report.
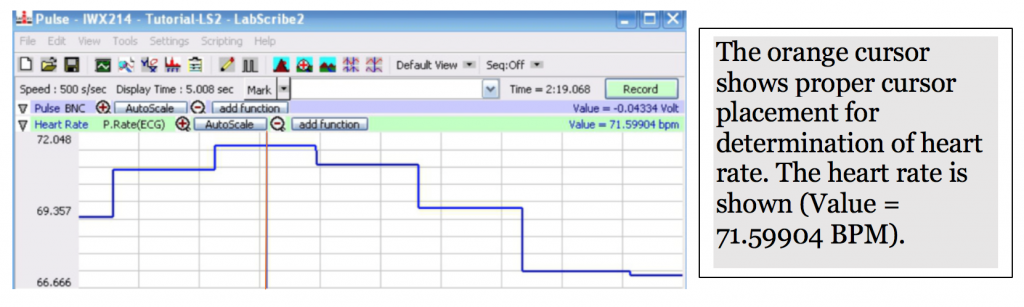
- To find the heart rate, select the one cursor icon and place the single cursor at the plateau of the of a heart rate trace on the Heart Rate channel. See the orange cursor in the picture below. Record the value in BPM on your lab report for heart rate data collected at approximately 5s, 10s, 20s and 30s.
- To find the SpO2, place cursor on the data at the 30 second mark of recording. Usually this line is completely flat.
- Record the SpO2 percent, shown on the O2 Saturation channel, in your lab report.
After recording the data in your lab report, open a new file for the next student.
Students may be asked to submit these data for statistical analysis:
Note: please submit your sex (M or F) and age with your data.
- Baseline avg. heart rate
- Baseline avg. pulse wave amplitude
- Condition 1 avg. cold pressor heart rate
- Condition 1 avg. cold pressor pulse wave amplitude
- Condition 2 avg. cold pressor heart rate
- Condition 2 avg. cold pressor pulse wave amplitude
Citations
- Some background materials adapted from OpenStax Anatomy and Physiology, https://openstax.org/details/books/anatomy-and-physiology. Available for free under a CC-by-4.0 license.
- OpenStax College (2013, April 25). Anatomy and physiology. OpenStax College. Retrieved from http://cnx.org/content/col11496/latest
Please cite:
Haen Whitmer, K.M. (2021). A Mixed Course-Based Research Approach to Human Physiology. Ames, IA: Iowa State University Digital Press. https://iastate.pressbooks.pub/curehumanphysiology/
