Properties of Blood as a Buffer and Blood Glucose
Biol 256 Week 3 Laboratory
Karri Haen Whitmer
Part I: Blood pH Homeostasis
Acidity and alkalinity describe a property of chemicals based upon relative concentration of hydrogen ions in a solution. The pH scale measures this value and ranges from 0 to 14. A pH of 7.0 is considered neutral. A pH value greater than 7 is basic, and a pH less than 7.0 is acidic.
The pH scale is defined as the negative log of the hydrogen ion concentration of a solution (figure 1). This means each pH value on the scale represents a ten-fold difference in hydrogen ion molarity than the next value. For instance, a solution with pH of 8.0 is one-hundred times more basic than a solution with a pH of 6.0. Similarly, a solution with a pH of 5.0 is ten times more acidic than a solution with a pH of 6.0.
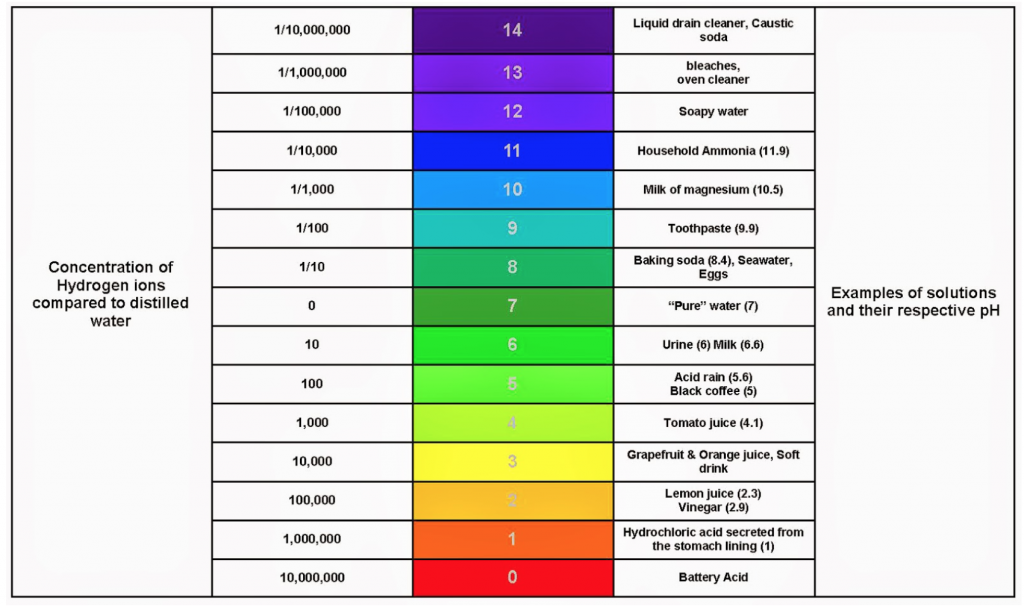
In biological systems, it is important to keep the pH of a solution within a narrow range of values. To accomplish this, buffers are used. Buffers resist changes in the pH of a solution when hydrogen ions or hydroxide are added (or removed). Buffers dissociate in solution and neutralize extra hydrogen ions or hydroxide ions by participating in reactions with them.
Normal blood pH is 7.4, and arterial pH may only vary between 7.35 and 7.45 without being pathological. The Carbonic Acid-Bicarbonate buffer system is the most important buffer for maintaining the pH homeostasis of blood. In this system, gaseous metabolic waste carbon dioxide reacts with water to form carbonic acid, which quickly dissociates into a hydrogen ion and bicarbonate (see below).
CO2 + H2O ⇌ H2CO3 ⇌ H+ + HCO3–
Besides the carbonic acid-bicarbonate buffer system, there are other buffers in whole blood, including the phosphate buffer system. Additionally, some proteins have buffering capacity, such as hemoglobin and blood serum albumin (a common carrier protein in blood). These have a lesser effect than the carbonic acid-bicarbonate system on maintaining blood pH homeostasis.
In this week’s activity, you will test whether five solutions behave as buffers:
- Saline (a salt water solution)
- Phosphate Buffered Saline (PBS), which is a solution of disodium hydrogen phosphate, sodium chloride and potassium chloride commonly used the lab
- 5% blood serum albumin (a protein found in blood serum)
- Blood Plasma (Sheep), diluted 10X with PBS (the liquid part of blood, which contains all the water, ions and proteins minus any formed elements)
- Whole Blood (Sheep) diluted 10X with PBS (containing all the components in “live” blood, including the cells)
Part II: Blood Glucose Homeostasis
Blood sugar homeostasis is important 1.) to consistently provide body cells with the necessary glucose to sustain metabolic reactions and 2.) to protect cells against damage that can occur when circulating blood glucose levels are too high for too long. For healthy individuals, the American Diabetes Association recommends a fasting (no food or drink, except water, for 8 hours) plasma glucose level of less than 100 mg/dL and, 2 hours after meals, a concentration less than 140 mg/dL.
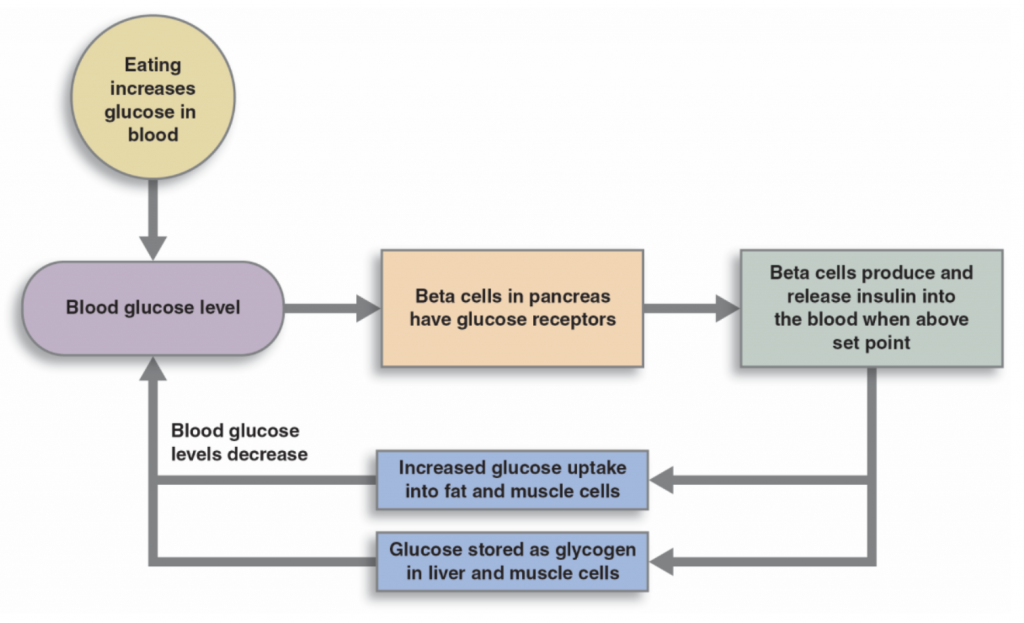
In order to tightly control blood glucose levels, α- and β-cells of the endocrine pancreas secrete two hormones – insulin and glucagon. When eating a meal, the surge in blood sugar is detected directly by receptors on the pancreatic islet β-cells. These cells then secrete insulin, which binds to insulin receptors on various body tissues. Occupied insulin receptors signal body cells to increase the number of glucose transporters, special proteins that shunt glucose from the blood, through cell plasma membranes, and into the cell. The increase in transporters results in quick internalization of blood glucose by the cells.
When blood glucose levels are too low, e.g., less than 70 mg/dL or lower, the body may not have enough circulating blood glucose to sustain the body’s chemical reactions. Symptoms of low blood sugar (hypoglycemia) can be severe and include: nervousness, shaking, fatigue, blurry vision, trouble thinking, and even the loss of consciousness.
Low blood sugar is detected by the α- cells of the pancreas, which increase glucagon secretion. Glucagon activates liver enzymes, which then convert the glucose storage molecule, glycogen, into glucose. Glucagon also initiates the endogenous synthesis of glucose from other biomolecules like amino acids. The newly released or synthesized glucose passes into the blood stream and raises blood glucose levels.
Diabetes is a condition in which the body fails to respond to insulin, resulting in the body’s inability to control glucose homeostasis. Typically, in Type I diabetes, pancreatic β-cells are destroyed by an autoimmune reaction resulting in low or absent insulin in the body. Type II diabetes is also called “insulin resistance.” Generally, in this disease, the body manufactures insulin, but there is a problem that prevents insulin receptors from sending signals that increase the presence of glucose transporters in the plasma membranes of cells.
In Lab this week, your TA may test your Blood Glucose using a Contour Blood Glucose Monitoring System. A blood sample will be obtained from the side of your middle or ring finger using an Accu-Chek Safe-T-Pro Lancet. It delivers a quick, almost painless pinprick and only a small amount of blood is needed.
Laboratory Methods
Exercises
The following text describes the laboratory methods for analysis of blood buffering and blood glucose.
In this experiment, students will determine the buffering capabilities of a variety of solutions by measuring the pH of the solutions when they are treated with a weak base. Each group of students will measure the pH changes that occur in Saline, Phosphate Buffered Saline (PBS), 5% Albumin in PBS, Blood Plasma diluted 1/10 with PBS, and Whole Blood diluted 1/10 with PBS.
Laboratory Objectives
- Students will practice pipetting technique.
- We will use iWorx and calibrate the electrodes with LabScribe.
- The calibrated electrodes will be used to determine the pH changes that occur with addition of NaOH to the test solutions.
- Analyze the change in pH for each solution and determine if it is a buffer.
- Finally, we will measure each student’s blood glucose level with a blood glucose monitor.
Equipment Required
- PC Computer
- iWorx TA (IXTA) data acquisition unit
- ISE-100 combination pH electrodE
- Saline
- PBS
- 5% albumin in PBS
- 1/10 blood plasma in PBS
- 1/10 whole blood in PBS
- Beakers
- 10-100μL or 20-100 μL pipette
- Distilled water
- Kimwipes®
- 0.1 M NaOH
Practice using the micropipette
To draw up a specific amount of a solution, set the dial on the micropipette to the appropriate volume, then depress the plunger, and immerse the pipette tip in the solution. The micropipette plunger has a first “soft” stop. When the plunger is pushed to the first stop, it allows the pipette to draw up the programmed amount as the plunger is gently returned to the original position. To discharge the drawn-up solution, the plunger is pushed all the way down to the second “hard” stop.
To practice, place a plastic tip on the pipette, push the plunger to the first stop, submerge the pipette tip into the distilled water and gently allow the plunger to return to its original position. Look at the plastic tip and note how much distilled water has been taken into the tip. Discharge the distilled water back into the container of distilled water and repeat. Did you get the same amount of distilled water drawn into the tip as the first time? Continue practicing until you feel confident that you are operating the pipette properly.
PART I. Set up the computer
- Turn On iWorx Unit Box on Lab Table at the switch at the back of the box. Make sure Green Light is lit and all equipment is attached to the iWorx box.
- Log into the computer using your ISU ID.
- Click the folder icon in the lower left task bar.
- Click “this PC” in the left side task bar.
- Double click the Biol 256L Course Materials P-Drive under Network Locations.
- Double click the “Week3_BiologicalBuffers” file.
- Click OK to the Hardware Found Box, if it appears.
PART II: Calibrate the pH Electrode
Note: electrodes are delicate and expensive sensors, which can easily crack. Do not tap or drop it. When placing it in a beaker, do so carefully.
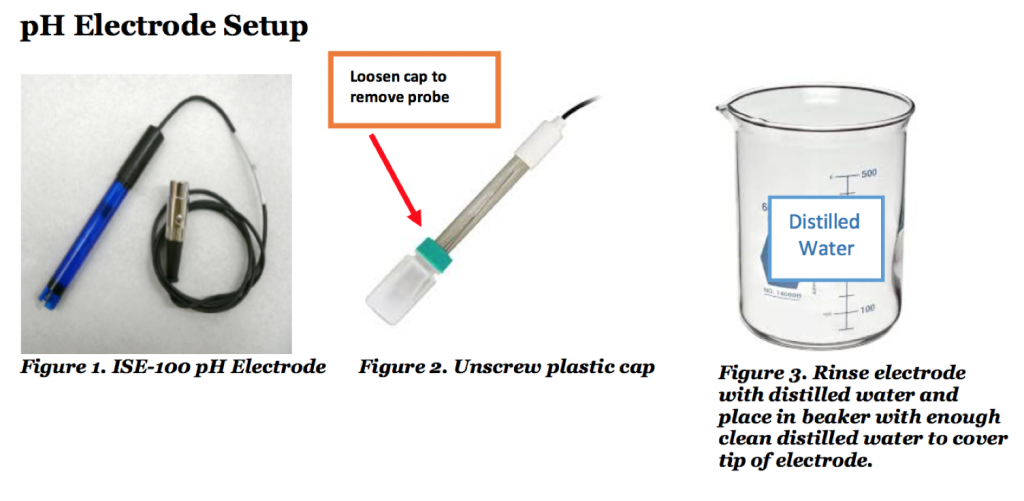
- Remove the ISE-100 pH electrode from its bottle of buffer by unscrewing the cap a little so that you can easily pull out the electrode. Make sure top portion of the bottle is removed.
- Replace screw cap of bottle if totally separated and place back in dry storage beaker where you found the electrode. Rinse the electrode with distilled water while holding the electrode over the large beaker used for the collection of waste liquids.
- Place the tip of the ISE-100 pH electrode in a small beaker containing enough room temperature distilled water to submerge the tip. Keep the electrode in distilled water for a few seconds.
- Obtain the calibration buffers: One beaker will contain pH 7 buffer and the other will contain pH 10 buffer. Each beaker should be filled with enough buffer to cover the tip of the ISE-100 pH electrode, but NO MORE is necessary!
- Remove the electrode from the distilled water and gently blot any extra drops of water using Kimwipes. Submerge the end of the electrode in the beaker of pH 7 buffer.
- Click Record (the red button on the upper toolbar) on the LabScribe Main window to begin recording. After a few seconds, the trace will reach a stable baseline. Type pH 7 in the Mark box to the right of the Mark button (at the top- center of the screen). Press the Enter key on the keyboard to mark the stable baseline of the recording. This will mark the output of the ISE-100 pH electrode in pH 7 buffer. You may continue recording while changing the beakers of buffers.
- Remove the ISE-100 pH electrode from the beaker of pH 7 buffer. Hold the electrode over the beaker used for collecting waste liquid and rinse it with distilled water. Blot any extra drops of water with Kimwipe.
- Position the electrode in the beaker of pH 10 buffer.
- As you continue to record, the trace will reach a stable baseline, allow it to record for several seconds. Type pH 10 in the Mark box. Press the Enter key on the keyboard to mark the stable baseline of the recording. Click Stop on the LabScribe Main toolbar to stop recording.
- Remove the electrode from the beaker of pH 10 buffer. Hold the electrode over the beaker used for collecting waste liquid, and rinse it with distilled water from a wash bottle. Blot any extra drops of water and place the electrode in a clean beaker of room temperature distilled water.
Units Conversion
- Scroll to the beginning of the calibration data for the ISE-100 pH electrode.
- To show the data collected at pH 7 and pH 10 on the Main window at the same time, you can use either the Double Time Display icon to adjust the Display Time. Click Double Time several times until your pH 7 mark and the pH 10 mark are on the same screen or the Double Cursor icon will allow two red cursors to appear on the Main window.
- Place one red cursor on a flat section of data collected when the ISE-100 pH electrode was in the pH 7 buffer and the second red cursor on a flat section of data collected when the electrode was in the pH 10 buffer.
- Click on the Auto Scale icon in the tool bar above the graph screen.
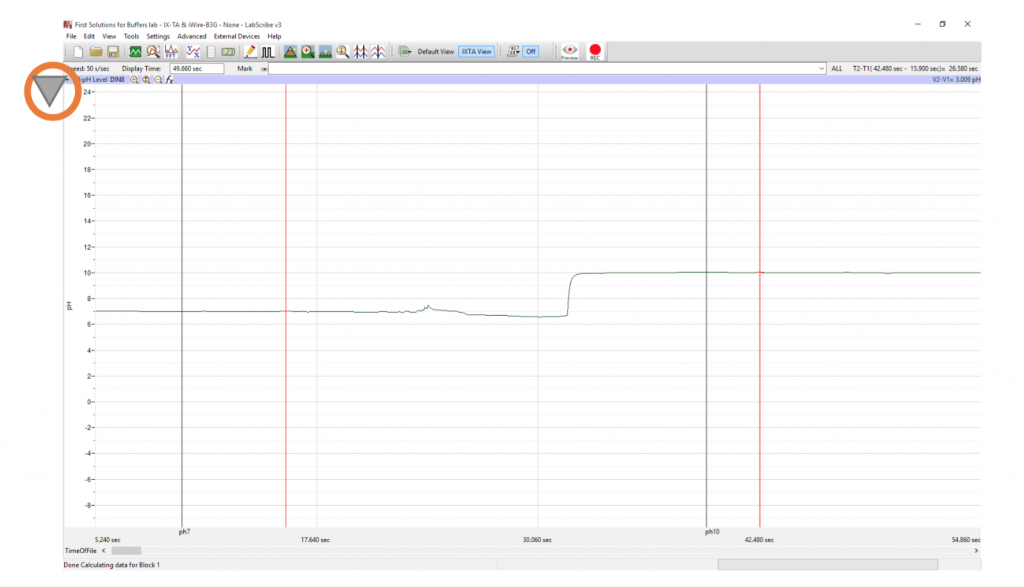
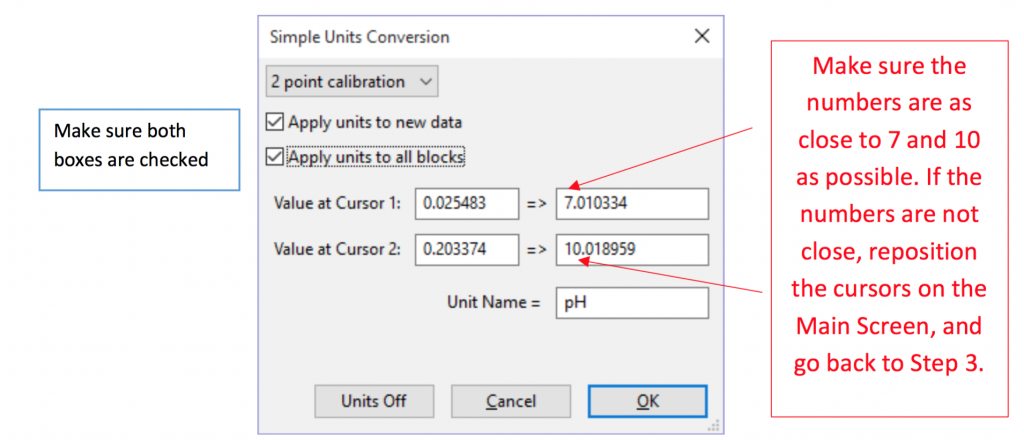
- To convert the voltages at the positions of the cursors to pH values, use the Simple Units Conversion dialogue window. To access this dialogue window, click on the grey arrow (the upper left corner of the screen, see orange circle on figure 4, above) to the left of the channel title, pH, to open the channel menu.
- Select Units from the channel menu, and select Simple from the units submenu.
- On the Units Conversion window, (see picture below) make sure 2 point calibration is selected in the pull-down menu in the upper-left corner of the window.
- Put a check mark in the box next to Apply units to all blocks. Notice that the voltages from the positions of the cursors are automatically entered into the value equations.
- Enter the two buffers used in the calibration recording in the corresponding boxes on the right side of the conversion equations. Enter the name of the units, pH, in the box below the buffer values.
- Click on the OK button in the lower right corner of the window to activate the Units Conversion.
PART III: Test the Potential Buffers
Important: Click on the single-cursor mode icon for the rest of this experiment.
Solutions to test: Saline, Phosphate Buffered Saline (PBS), 5% Bovine Serum Albumin (BSA) in PBS, 10X sheep blood plasma in PBS, 10X sheep whole blood in PBS
For each solution to be tested:
- Click on the single cursor mode icon.
- Place approximately 10mL of the test solution in a small beaker. Label each buffer solution with a removable paper label which you will remove during clean up at the completion of the lab.
- Immerse the electrode in the test solution and click Record. Wait a few minutes for the pH to stabilize and mark this point as the Start for Solution X (name the solution) press ENTER.
- Add approximately 50𝝁L of NaOH to the test solution. Gently swirl the solution and wait a few seconds for the pH to stabilize. Mark this point as 1 aliquot. Press ENTER.
- If the pH has changed less than 0.5 units, add another 50𝝁L of NaOH and mark 2 aliquots and press ENTER once the solution has stabilized. Continue adding 50𝝁L of NaOH and marking until you observe a change of 0.5 units or greater. Stop adding NaOH if you have added 15 aliquots of 50𝝁L without a change in pH of at least 0.5 units.
- In Data Table 3.1 of your Lab Report, record the number of 50𝝁L aliquots of NaOH required to cause the pH to go up at least 0.5 pH units. If you observed no change in pH after 15 aliquots were added, note “15+” in the data table.
- Repeat the procedure with the other test solutions making sure to rinse the electrode with clean distilled water and blotting it dry with a clean Kimwipe between solutions.
- Once you have tested all the test solutions, rinse the electrode again with distilled water and blot it with a Kimwipe. Gently insert the electrode into its original bottle of buffer and gently screw on the cap. Make sure the electrode is submersed in the buffer and stays upright! If the electrode dries out the equipment will be damaged. Please see the below figure.
- Finish the Week 3 Properties of Blood Worksheet.
- Note: Because the plasma and whole blood are diluted tenfold, their buffering ability is diluted as well. Therefore, assume these were ten times less effective than if undiluted plasma or blood were used.
Lab Clean Up
When the buffer part of lab is complete, please remove small labels from beakers and place in the trash. Rise the beakers several times with water and return them to their original locations to dry. Please leave the electrode in the same condition is was found: place electrode back in its small beaker with lid on (please make sure buffer solution is in the container because the electrodes must not dry out), and place the electrode storage bottle upright inside a larger beaker.
Blood glucose testing
When buffer work in lab has completed, TAs will offer students the opportunity to participate in a blood glucose test. Students will record their last meal and blood glucose value on the lab report; however, this part of the lab is volunteer only, since students must draw blood. TAs may offer one point extra credit for participation in this activity. Students who decide to participate must sign the consent form at the TA podium.
Please cite:
Haen Whitmer, K.M. (2021). A Mixed Course-Based Research Approach to Human Physiology. Ames, IA: Iowa State University Digital Press. https://iastate.pressbooks.pub/curehumanphysiology/

