
Soil input recommendations
Arturo Flores
- Interpret soil test reports
- Calculate the required fertilizer to amend soil nutrient deficiencies
- Design fertilizer formulas based on the soil needs and materials available
Make soil input recommendations
One of the big questions in agriculture has been and will be ‘what and how much should I apply to increase yield?’ It is a common question asked by most farmers, with the belief that there is a magic formula to once and for all improve the soil quality and boost yield. However, this is far from being true. As has been discussed throughout this course, soil is a complex and dynamic system. Therefore, improving soil is a holistic process that should consider each one of its factors that could be limiting production. Soil laboratory analysis is an accepted measure performed by farmers around the globe to obtain some insight about what is going on in their soils and use it as a starting point to take management decisions.
The soil test report obtained after analysis may include recommended fertilizer application rates and even recommended products. Nevertheless, this service is not always available or economically accessible for every user. The process of interpreting a soil test report is not rocket science, and with a basic understanding of the overall condition of soil, it is possible for any user to improve the soil quality. It should be noted that a soil test report is not completely accurate and may just represent the condition of the soil where the sample was taken. However, is still valuable to be able to read, understand, interpret and act according to what the report is telling the user. The most important thing to remember when interpreting soil test results, is that soil quality or fertility is not just a matter of nutrient balance, but also about the chemical and physical conditions of soil, including acidity, salinity, and moisture content.
FIRST: Evaluate and improve the physical condition of the soil
Porosity and moisture content are limiting factors that can reduce agricultural productivity. Fine soil textures are good for retaining moisture, but bad for resisting compaction. Conversely, sand and gravel retain low quantities of humidity, but resist compaction better than clays. Compacted soils and not granular structures make root growth, water infiltration and percolation significantly harder. When roots can’t penetrate deep and water sits for too long on the root-zone (0 – 12 in), the root system becomes shallow and relies on the surface conditions to thrive. This is a problem, especially when water has trouble draining away because waterlogging near the surface increases nutrient reduction reactions and changes the chemical soil conditions. As a result, crops are more susceptible to drought and nutrient deficiencies.
Moreover, soil physical conditions can be managed temporarily to better adequate the soil with optimal growing conditions. Artificial drainage, such as tile pipe or canals can be implemented to reduce waterlogging and increase draining rates. Canals are built to collect excess water from run-off after high precipitation events, and also to regulate the water table, preventing it from reaching the root-zone. Conversely, when soil is too dry, there is no moisture that can be used to absorb nutrients. Nutrients use water as transport to move through the soil and to be absorbed by the plant’s roots. Irrigation can be useful to maintain optimal soil moisture and the effects of drought stress, including plasmolysis and the inability to feed on plant nutrients. Surface structure and compaction are modified with soil tilling with chisel and disc plows, or with rotovators. These technologies increase soil porosity in the short term but may lead to the development of hardpans when mechanization occurs regularly on not optimal conditions (eg., excess soil moisture). Soil texture is hardly altered because it requires large amounts of material. This is seen more often in sport turf management, where the soil is amended with large quantities of sand that increase drainage and reduce the risk of compaction. However, the economic cost represents a significant restriction for conventional agriculture, and the incorporation of organic matter is more common for enhancing texture and structure.
Commonly, these problems are not presented in a conventional soil fertility test, unless otherwise specified. However, they can be the reason for crops not being able to thrive as expected. When the growing medium lacks proper soil physical fertility, the application of other inputs, such as lime or fertilizers, may not result in a significant improvement of yield. If the soil’s physical condition is considered optimal, it is time to address the chemical fertility problems identified from the soil test report.
SECOND: Improving Soil Chemical Fertility
Soil pH is the primary chemical property regulating nutrient availability, and most soil test reports include this value. Acid soils (pH<7) tend to have more aluminum readily available, which results toxic for plants, and calcium, phosphorus and magnesium are less available. Alkaline conditions (pH>7) decrease phosphorus and micronutrients availability and increase salinity susceptibility. Nutrient deficiencies caused by soil pH can be reduced with the application of lime (increase pH), or with acidifying materials containing sulfur (reduce pH). These solve the problem in the short term and pH will return to the original level if it is not constantly managed. Liming corrects passive acidity but does not change soil natural behavior and mineralogy, which is the reason for the soil’s natural pH. For example, in tropical countries like Costa Rica where precipitation rates are very high (>120 in/year), it is common to find soils with pH of 5 or even lower. Thus, for farmers in the region, liming pastures and other agricultural fields becomes a regular practice every one or two years.
Soil salinity negatively affects soil aggregation, structure, infiltration, and salts may be toxic for crops. It’s important to remember that soil salinity is not the same as sodic soils. The difference is in the type of salts present in the soil. Sodicity means higher sodium content, and general salinity includes calcium, magnesium, chloride, and carbonate accumulation. Common techniques to deal with these conditions include washing salts away and applying gypsum. When water for irrigation is available, applying large quantities of water help leach salts away from the root zone. However, the constant application of irrigation water or the poor quality of it can help build up the salt accumulation. Therefore, the efficacy of this method will greatly depend on the quality of water. The application of gypsum is done to reduce the effect of sodium. The calcium contained in gypsum replaces the sodium adhered to the colloids, which then reacts with the sulfur creating soluble sodium sulfate in the soil solution that is easily leached away. Soil test reports include salinity obtained through measuring the electrical conductivity of the soil sample. Sodicity is obtained by comparing the concentration of sodium with the total CEC.
To efficiently leach salts away, the soils profile should be wet enough for water to drain and carry salts away. The following are used to calculate the leaching requirement:
- LR = ECw / ( 5xECc – ECw)
- WR = ET / ( 1 – LR)
where LR stands for Leaching Requirement and the result has no unit it is a factor, ECw is the electrical conductivity of water to be used (in dS/m), and ECc is the desired electrical conductivity to achieved or the threshold that the crop can handle. In the second equation WR is the water required to leach salts away, and the ET represent the evapotranspiration of the area which means the total moisture being lost through evaporation and transpiration that has to be compensated for to achieve and optimal salt flush (in mm/day).
Example
There is a hotel in a dry region of the western territory of Costa Rica, where they are having problems with their gardens. The soil and water were sent for analysis, and they obtained that their soil has a ESP of 10% and an EC of 5 dS/m. And their water turns out to have an ECw of 1 dS/m. They decided to work better with plants that can tolerate up to ECc of 1 dS/m in the soil, but first they have to determine the water requirement to maintain the soil in the 1 dS/m range. If the ET of the area is 6 mm/day, help them calculate how much water they should apply per day through irrigation.
1. Obtain the Leaching Requirement factor:
LR = (1 dS/m) / (5×1 dS/m – 1 dS/m)
LR = 0.25
2. Calculate the Water Requirement per day:
WR = (6 mm/day) / (1 – 0.25)
WR = 8 mm/day
Result: The recommended water requirement is 8 mm/day to maintain optimal growing conditions for their plants. Because they have an ESP < 15%, they don’t have sodium related problems, therefore, the application of gypsum is not critical.
Gypsum requirement can be calculated with the following equation:
- Gypsum requirement (ton/ha) = Na content (cmol/kg) x 4.5
Example
A farm in Guatemala is having problems growing crops. Soil samples were submitted for analysis and the results showed a ESP of 18% and a CEC of 20cmol/kg. They decided to apply gypsum to improve their soil quality but need help calculating the total requirement. Help them solve the problem.
1. Calculate the sodium content:
Na (cmol/kg) = Total CEC x ESP
Na = (20 cmol/kg) x 0.18
3.6 cmol Na / kg
2. Calculate the gypsum requirement:
Gypsum = (3.6 cmol/kg) x 4.5
16-ton Gypsum / ha
Result: they need to apply 16 tons of gypsum per hectare.
THIRD: Make fertilizer recommendations
Fertilizer application is an alternative solution to compensate for nutrient deficiencies. They can be applied to build up the soil nutrient pool up to a critical threshold, to compensate for the nutrient mining done by the crops, or a combination of both. It is important to remember that over application of nutrient may result in luxury consumption by the crop, which results in toxicity and can be as detrimental as the deficiency of such nutrients. Therefore, it becomes vital to correctly interpret the nutrient levels and apply fertilizing products accordingly. Organic derived fertilizers contained lower levels of nutrients compared to synthetic fertilizers, but they can also help improve microbial activity and provide the benefits of soil organic matter. Conversely, synthetic formulas are intended to provide higher rates of nutrients and make them available more easily compared to organic products. Bulk blended fertilizers contained raw particles of different materials, in which each particle provides a different element. These tend to be cheaper but nutrient distribution is not as even and effective as chemical formulas can be. Granular fertilizers contained particles of equal size and chemical composition that are obtained by mixing together raw materials through chemical reactions. These required some extra processing and prices may be higher, however, they ensure that each particle contains an equal amount of nutrients, providing a more even application. It is on the farmer’s judgement and accessibility the preference and acquisition of one over the other.
Sometimes the nutrient ratio to apply is given in the soil test report, however, this is not always the case. The nutrient ratio indicates the proportion of NPK in the product to apply. For example, a 15-15-15 fertilizer has a ratio of 1-1-1, and the ratio 18-6-12 is 3-1-2. This helps decide on the product to apply and provide guidance when a custom formula is being created.
In this picture we can see the soil test report from a dairy farm in Guatemala. Soil in the region is derived from volcanic ashes and tends to have acidity problems due to high precipitation rates in the region. The results inside the red box show the required nutrients needed to bring the soil to an ‘adequate’ or optimum level, this means above deficiency.
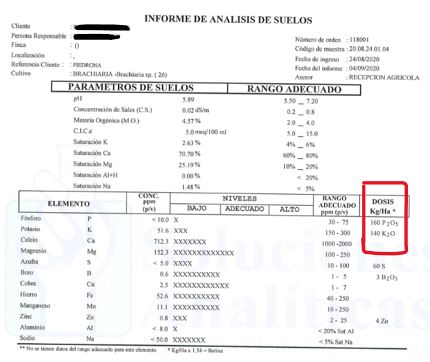
To decide in which fertilizer to apply, obtaining the recommended nutrient ratio can help. To do this follow the steps:
- Obtain the recommended rate of each nutrient by subtracting the actual level from the desired ‘optimum’ level (Rate = optimum – actual). In this case the lab already reports this result (we just have to transform it into our desired units).
160 kg P2O5 ha-1 = 142.51 lb P2O5 acre-1
140 kg K2O ha-1 = 124.60 lb K2O acre-1
- Nitrogen is not commonly analyzed in this kind of tests because of its mobility and ease to leach and volatize. Therefore, tissue analysis is preferred, and nitrogen fertilization attempts to compensate for the biomass produced in certain are. The image shows the crop here is Bracharia, and a commonly accepted rate of N for this is 100 kg N ha-1.
100 kg N ha-1 = 89 lb N acre-1
- The ratio is obtained by dividing the total required of each nutrient by the smallest value, in this case N.
89 lb N acre-1 / 89 = 1
142.51 lb P2O5 acre-1 / 89 = 1.6
124.60 lb K2O acre-1 / 89 = 1.4
The recommended ratio here will be 1 – 1.6 – 1.4. Knowing this ratio, it is possible to choose from commercial formulas that best fit the needs or to mix fertilizing materials to supply the required nutrients.
The process of balancing soil nutrients consists in bringing deficient nutrients up to an optimal threshold. The following videos provide a step by step in the process and help understand how to make fertilizer recommendations. When creating a fertilizing mix, it is important to consider the compatibility of the materials to avoid precipitation or insolubility of some nutrients.
Video 1: Calculate the nutrient ratio
Video 2: Calculate how many bags of fertilizer we need
Video 3: Create your own NPK fertilizer
Extra:
