
Soil maps around the world
Bradley Miller and Arturo Flores
- Compare the difference between soil maps in the United States versus the rest of the world.
- Discuss the available alternatives for the lack of soil maps.
Keywords: soil survey, site specific maps,
Soil maps around the world
A paradox in public support for soil mapping is that users are increasingly asking for the maps to do more. Then, when the soil maps fall short of those expectations, opinions shift to the soil survey maps not being useful. For example, many farm managers have sought to be more strategic with their sampling for soil fertility by dividing a field into management zones (the core concept of Precision Agriculture). A common approach to identify those management zones is to use the delineations from the soil survey maps. Sometimes this works well, and sometimes the soil survey maps do not include important variations. Note that sub-field management was not included as one of the purposes for soil survey maps.
Given the many purposes of soil maps and the large success of the soil survey program in the USA, many Americans take for granted that they can go online and look at a soil map for around 99% of the land in the USA. Few countries have soil maps with the coverage extent and level of detail provided by the USA soil survey program. At least part of this achievement can be explained by synergistic public investments, such as soil conservation efforts and providing jobs for veterans after major wars/conflicts. Many countries shut down their soil survey programs during the Farm Crisis of the 1980s (Farm Crisis). The USA stands out in its continued funding of soil surveys through that time.
Soil maps in the United States
In 1899 the USA’s federal government established the Bureau of Soils to conduct a consistent and coordinated soil survey. Today, the USA soil survey maps include a plethora of interpretations to help translate the knowledge of soil scientists into information needed by landowners to make management decisions. These interpretations can include the suitability for recreational facilities (e.g., campgrounds or golf courses), wildlife habitat, building site development (e.g., basements or streets), sanitation facilities (e.g., septic tanks or landfills), as a construction material (e.g., source of fill dirt or gravel), and water management (e.g., reservoirs or irrigation).

One of the early soil surveyors for the USA’s Bureau of Soils was Hugh Hammond Bennet. During the soil mapping of Louisa County, Virginia in 1905, he was directed to investigate declining crop yields in the area. He was struck by the differences in the condition of soil under virgin timberland compared to cultivated fields. His advocacy for soil conservation led to him becoming the first director of the Soil Erosion Service in 1933. Although the degradation of soil has always been a challenge for human civilizations, the USA experienced a particularly cataclysmic series of events in the 1930s. Coincidently, on the day that Bennet testified before congress in 1935, a dust storm event from the central USA occurred so dramatically that it darkened the sky in Washington D.C. Commonly referred to as the Dust Bowl, the combination of management practices not suited for dryland ecosystems and multiple droughts wiped out tens of thousands of farms. Spurred by the start of the Dust Bowl and investment in public works to stimulate the economy during the Great Depression, Congress elevated the Soil Erosion Service in the USDA and renamed it the Soil Conservation Service. By 1938, the Soil Conservation Service –known today as the Natural Resource Conservation Service – subsumed the Bureau of Soils, making soil conservation the supervisor of soil mapping. While all the previously mentioned needs of a soil survey have remained in place, the lead purpose of soil survey in the USA has been to support soil conservation policy since that time.
Prior to the adoption of aerial photography for soil mapping, most of the maps made by the USA soil survey were made at the county scale. Because of this relatively small extent (large map scale), USA soil survey maps can include more detail. However, until they started using aerial photographs, these maps were more like geologic maps because they could only recognize differences in soil parent material (e.g., bedrock, till, or alluvium) but could not see where different topographic positions occurred in the map. After World War I, aerial photography became more readily available, and the USA soil survey was then able to differentiate landscape positions.
In the USA Midwest, where single season crops were grown, it was possible to have aerial photographs of bare soil. Seeing patterns of lighter and darker soil allowed soil mappers to delineate the tops of hills and the swales between them. This style of soil mapping is called high-low mapping. In areas where there was continuous vegetation cover, the aerial photographs enabled soil mappers to see the type of vegetation growing in different areas and delineate differences in expected soil series based on that. In this way, the level of detail that could be included in a map depended on the map scale, availability of information in base maps, and the purpose of the map.
The USA method of fully utilizing the factors of soil information to associate patterns of soil variation is known as the soil-landscape paradigm. This is a specific example of the geographic concept of spatial association, which is that some variables covary with each other in space. By looking at variables that are more readily observed, one can infer variables that aren’t as easily observed. In the case of the soil landscape paradigm, a soil mapper could observe soil properties in one location and infer that other locations with matching climate, vegetation (the part of organisms that can be seen in an aerial photograph), landscape position, and parent material would also have the same combination of soil properties. For example, the Clarion soil series is mapped on the tops of the gentle hills of the Dows geologic formation (region known as the Des Moines Lobe). Within a county scale map, climate doesn’t change very much. However, there are measurable differences in climate across multiple counties. For this reason, the Clarion soil series is not associated with exactly the same soil properties from one county to the next. Although parallel in the other factors of soil formation, the Clarion soil series is associated with slightly different soil properties as observed in each county and the same is done for all soil series. This strategy allows for a general concept of soil series to be easily communicated, while also helping the county soil maps to be more accurate.

Soil maps elsewhere
The intensive and constant improvements on the USA Soil Maps have produced high-quality and reliable sources of information both for agricultural development and policy making. However, the reality is different outside of the United States. Underdeveloped countries, especially, rely on existent soil classification systems to map their own soils. There is no one concrete reason for the nonexistent efforts on mapping the regions soils in detail as the US has done with their own. Perhaps lack of economic resources, competent politicians, or even disinterest caused by underestimating soil. However, despite the lack of regional soil maps, Central America has thrived and managed soil so efficiently that agriculturally it is one of the most productive regions in the world.
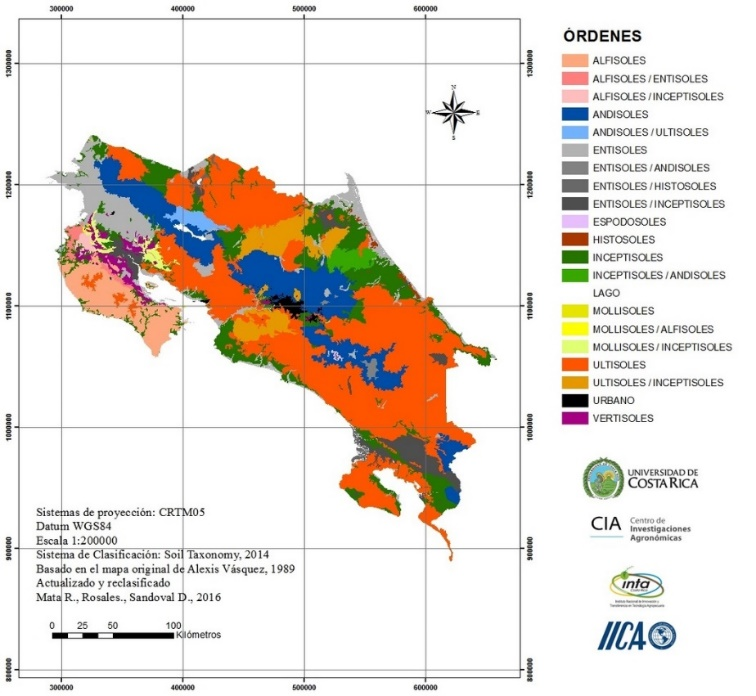
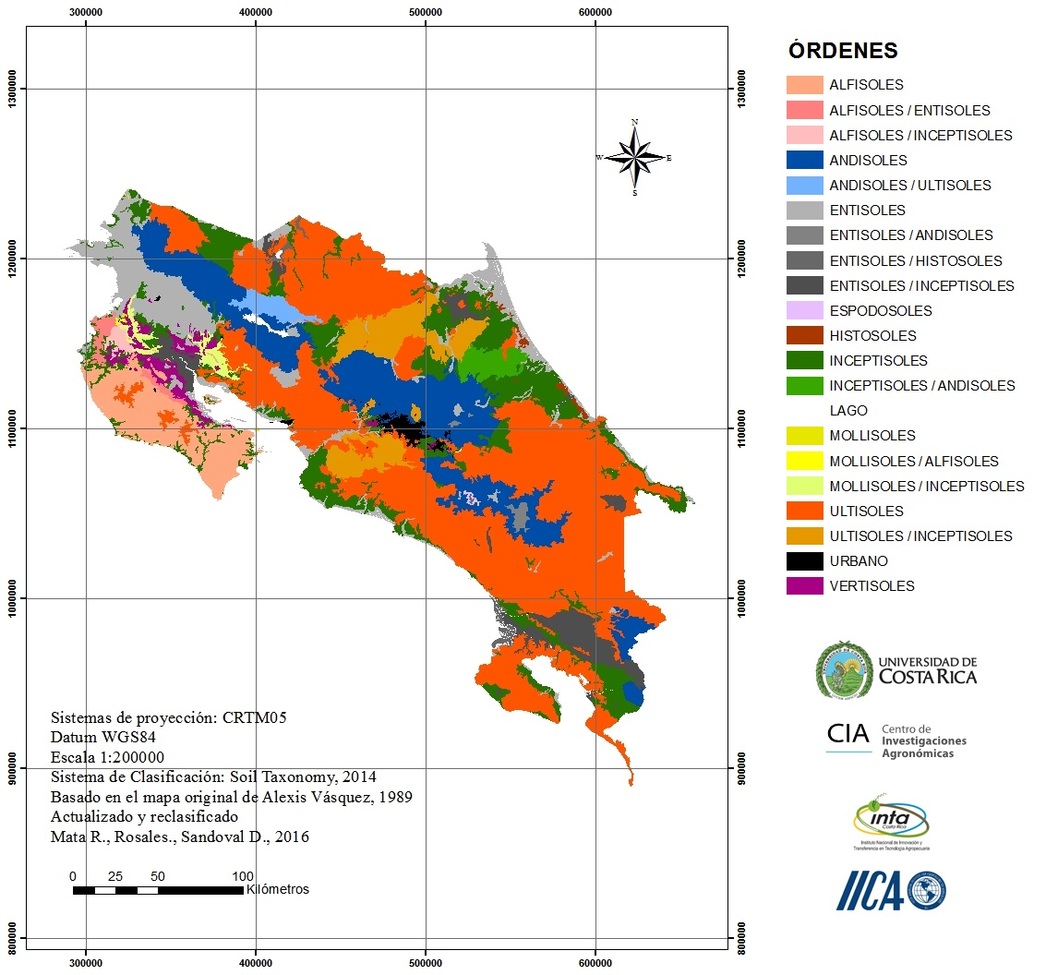
Contrary to the popular use of public available soil maps in the USA, private parties have created their own maps to suit their interests, rather than complying with the national demand. In Guatemala, significant efforts have been made by the sugar cane industry to create reliable soil maps that otherwise are not available. However, these maps have a limited geographic extent, that is, the region that falls within the sugar cane producing region. Also, because those maps are created with private interests, their accessibility is limited to the general public. Private universities have tried to provide useful data regarding the status of Guatemalan soils, but they are not widely spread and are little known even among farmers. A similar situation occurs in other tropical countries, such as in Honduras and Costa Rica, where banana and pineapple companies invest in their own soil and topography departments to evaluate their land, map their soils, and try to enhance agricultural production. Overall, the private sector efforts are always with the intention of increasing the economic benefit that soil maps can provide. These situations leave small and medium-sized farmers relying on scarce soil maps.
Soil survey maps provide an overview of the distribution of soil variability; however, they fail to represent fertility parameters and any kind of abnormalities, temporal or permanent, of greater importance mainly for agriculture. This situation puts every farmer in the world at the same starting point: specific soil maps for their land with enough detail to make decisions. Precision agriculture (PA) has slowly gained importance and acceptance among farmers because it relies only on data gathered for that specific field, instead of using regional soil maps. Agriculture is undergoing a paradigm shift in which conventional agriculture is turning into a more data-supported method. Whereas conventional agriculture treats fields as a whole homogeneous unit, PA addresses the local and independent variability that may explain A) soil’s fertility, and B) soil’s dynamic behavior.
Different technologies are being adopted to practice PA at different scales. Portable equipment, like Veris® technologies (Figure3), that can instantly measure soil pH, EC, and organic carbon by just dragging the equipment once over the field. The most valuable feature of this type of sensors is that the observations are directly transformed into spatial maps. Sugar cane companies in Guanacaste, Costa Rica, are seeing benefits of just tilling compacted soils and doing localized fertilizer applications, as input efficiency increases, and yield is boosted while reducing costs.
The more detailed maps are, the more specific agricultural treatment can be. Conventional sprayers used in pineapple farms are not able to easily adjust their settings once they start working. Drones with individual nozzle control allow adjustments on-the-go depending on treatment maps previously created based on field observations. Dota in Costa Rica is the region of the country known for its coffee production. It is in the mountains and the soil is derived from volcanic materials. Accessibility is limited to machinery and conventional agriculture becomes harder because of the steep topography. Now, drones are being used to evaluate coffee plantations and determine fertilizer requirements based on spectral data captured by the UAV. In Guatemala, sugar cane, pineapple and banana producers use UAVs to also spray fertilizers and pesticides in access-restricted zones, close to urban development’s and where planes are not able to reach. A revolutionary company called DISAGRO® works in Latin America and offers PA services that combine meteorology, soil, vegetation, and satellite data to create site-specific management plans. Many other companies and technologies are being developed in the region, demonstrating that the lack of detailed soil maps is not a limiting factor for the region’s agricultural success.
- The United States soil maps provide an adequate level of detail to evaluate soil properties and determine management concerns; however, despite their quality and public availability, they are not suitable for site-specific management.
