
Chapter 4: Data Management and Quality Control
Thomas Lübberstedt and Walter Suza
In this chapter, you will learn about limitations. Marker data are not perfect and do contain errors. Unlike phenotyping, genotyping is often not replicated to minimize costs. There are differences in error rates for different types of markers. Therefore, it is important to know factors that affect marker data quality and to employ quality control to minimize error. Whereas DNA is consistent across cells, RNA and cellular metabolites are not. Therefore, there is an even higher chance of variation between replications for non-DNA markers because of environmental effects. Also, if not exactly the same stages or cells are sampled when different tissues are considered (for example, seed vs. leaves), this may have a bearing on the marker data quality.
- Understand sources of error in marker data development
- Understand approaches to minimize errors in marker data development
- Familiarize with marker data management systems
Marker Data Pipelines
Marker Data Information
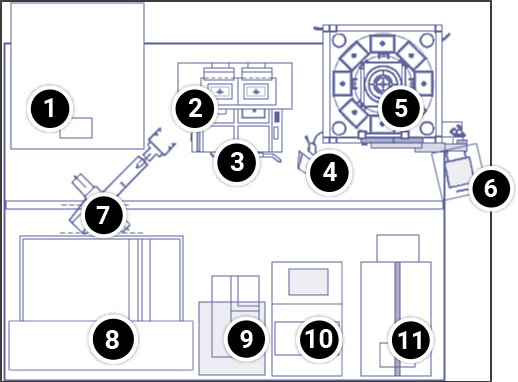
A marker data pipeline is a system through which marker analysis is conducted as a means to supply marker data to inform research and cultivar development processes. In practicality, the analytical part of the system is tied to the data generation components. For example, robots used to handle samples for PCR analysis in thermo-cyclers. Thermo-cyclers have both internal computers and peripheral conduits for connection to external computers for data storage and analysis.
Select a location in the layout below to view more detailed information on each item. Current DNA marker laboratories in major breeding companies generate more than 1 million SNP datapoints per day.
- Visualization of multiple PCR products is achieved at a single installation
- Thermocycler PCR blocks and docking connectors
- Thermocycler PCR blocks and docking connectors
- PCR plates are barcoded for identification using computers
- Refrigerators for storing PCR plates are strategically arranged to increase throughput
- Careful disposal of potentially toxic waste is important
- Transfer of sample plates between instruments by robotic fixtures
- Robots are used to ensure accuracy and reproducibility in measuring and mixing small volumes
- Robots are used to ensure accuracy and reproducibility in measuring and mixing small volumes
- PCR plates must be sealed to prevent loss of samples due to evaporation during high-temperature PCR cycles
- Unsealing of PCR plates may be necessary to further evaluate the PCR products
Equipment for Marker Data Development
The type of equipment required for marker data development and service available impact the cost of genotyping. Table 1 illustrates the cost of various genotyping assays and companies that provide such services.
| Assay | Equipment costs (Detection) | Service |
|---|---|---|
| SSRs | ~$1,000 | TraitGenetics |
| AFLPs | ~$1,000 | Keygene |
| Taqman | ~$100,000 | TraitGenetics |
| Sequenome-Massarray | ~$500,000 | Sequenom |
| Illumina-Beadarray | Illumina, TraitGenetics | |
| Affymetrix | Affymetrix | |
| Illumination-Infineon | Illumina |
Steps in Marker Data Production
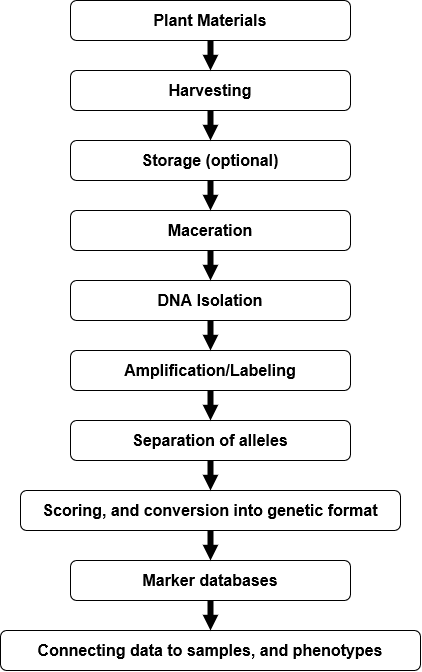
Step 1: Plant Materials
Handling of a sample once it arrives at the laboratory is a critical step. It is customary to label samples and enter the data into a data management system. High throughput laboratories are computerized with databases that track samples to determine what to test for. Labeling mistakes will, therefore, have an impact on data interpretation. However, the use of barcode labels helps alleviate the problem of sample identification. For grain testing, the first step is usually inspection of the sample. However, commercial grain may be contaminated with other grain, which may lead to wrong conclusions.
Step 2: Harvesting
Sample deterioration after harvesting may cause degradation of target metabolite markers and impact the quality of DNA. To minimize deterioration of especially the vegetative tissues, samples must be quickly immersed into liquid nitrogen or placed in dry ice. DNA isolation and its quality may be compromised by plant metabolites such as tannins and phenolics. These metabolites increase in concentration during leaf development, thus reducing DNA quality extracted in mature compared to young leaves.
Step 3: Storage
Careful and organized storage of samples and extracted DNA is important in case of a possibility of repeating the analyses. Plant samples may be homogenized and aliquoted into small volumes for long-term storage at -80 oC. Extracted DNA may be stored below -15 oC for at least three months.
Step 4: Maceration
Maceration describes a procedure to grind and soften tissue by soaking into a liquid resulting in separation of constituents for subsequent analysis. During this process, compounds such as phenolics, tannins and anthocyanins are leached from the sample. Therefore, inefficient maceration may have a negative impact on the quality of DNA and affect subsequent analytical processes resulting in failure to detect an allele.
Step 5: DNA Isolation and Quality
Successful quantification of DNA depends on the quality of the sample DNA analyzed. Therefore, appropriate extraction methods for each sample type must be determined to attain accurate DNA quantification (Holden et al., 2003). Table 2 shows how different reagents kits for DNA isolation impact DNA quality and the associated cost for using a particular kit.
Table 2 The Impact of various DNA extraction kits on sampe quality. Data from Zetzsche et al., 2008.
| Kit | Company | Relative Extraction Efficiency | OD ratio 260/280
(Ø) |
Fragment Length
(Ø) |
Handling Time
[in h, 20 preps] |
Material Cost
[in C, (100 preps)] |
| Nucleopsin Plant II | Macherey & Nagel | 0.15 | 1.91 | 2.5 | 202 | |
| GeneElute Plant Genomic DNA | Sigma | 0.16 | 2.05 | 2.5 | 167 | |
| Mag DNA Isolation | Agowa | 0.19 | 1.77 | 1 | 1050 | |
| Invisorb Spin Plant Mini | Invitek | 0.36 | 1.60 | 2.5 | 199 | |
| Power Plant DNA Isolation | Mobio | 0.28 | 2.08 | 2.5 | 377 | |
| DNeasy Plant Mini | Qiagen | 0.16 | 1.51 | 2.5 | 238 | |
| Plant DNAzol | Invitrogen | 0.64 | 1.66 | 3.5 | 120 | |
| Puregene DNA Tissue | Gentra/Qiagen | 0.87 | 1.49 | 5 | 105 | |
| Genomic Tip 20/G (adapted) | Qiagen | 0.63 | 1.93 | 8 | 924 | |
| Laboratory protocol | (BGBM) | 0.44 | 1.59 | 3 | 140 | |
| Genomic DNA Isolation Plants | Nexttec | Not determined | Not determined | 1 | 215 |
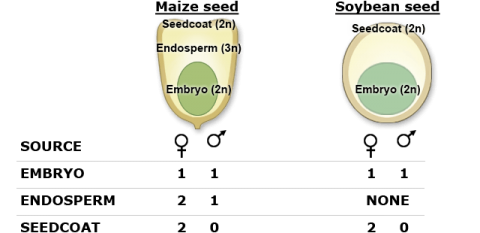
This 2020 Creative Component from Iowa State University to provides more information about the contribution of haploid genomes in maize and soybean.
Step 6: Amplification/Labeling
If DNA isolation is inefficient, the DNA may be degraded or contaminated with compounds that interfere with the PCR process. DNA degradation will reduce the sensitivity of PCR amplification. Certain contaminants may reduce the efficiency of PCR amplification, while some contaminants may inhibit the reaction or lead to artifact PCR products that may result in wrong interpretation of results. Usual good laboratory practices such as changing gloves and laboratory coats, using disposable pipette tips, separate reaction reagents and pipette sets, and so on for each room, significantly decrease the chance of contamination between different stages of the detection procedure.
Step 7: Separation of Alleles
Electrophoresis artifacts can distort the allele size due to altered DNA migration through the gel resulting in incorrect interpretation of the results.
Step 8: Scoring and Conversation Into Genetic Format
In addition to errors, marker data development process may encounter other challenges such as missing data. As shown in Table 3, certain marker systems will produce more missing data than others.
| Records | Missing Data | Average % missing data ± standard deviation | ||
| SRRs | Replicate 1 | 5,520 | 652 | 11.8 |
| Replicate 2 | 5,520 | 868 | 15.7 | |
| Average across replicates | 5,520 | 760 | 13.8  2.77 2.77 |
|
| SNP-MassARRAY | Replicate 1 | 8,142 | 154 | 1.9 |
| Replicate 2 | 8,142 | 187 | 2.3 | |
| Average across replicates | 8,142 | 170.5 | 2.1 0.28 |
|
| SNP-Invader | Replicate 1 | 4,761 | 161 | 3.4 |
| Replicate 2 | 4,761 | 138 | 2.9 | |
| Average across replicates | 4,761 | 150 | 31.0.34 |
Step 9: Marker Databases
A major challenge in genomics is how to both integrate and analyze rapidly increasing sequence information as a result of new technologies.
Step 10: Connecting Data to Samples and Phenotypes
As mentioned earlier, marker data are not free of errors. However, as illustrated in Table 4, certain marker systems may result in higher rates of error than others.
| Marker type | Polymorphism status of parents | Average % allele match to inbred parents S.D. |
Average % partial mismatch S.D. |
|---|---|---|---|
| SSRs | Monomorphic | 96.84.8 |
96.84.8 |
| Polymorphic | 73.3 1.6 |
73.3 1.6 |
|
| All markers | 81.9 1.4 |
81.9 1.4 |
|
| SNP-MassARRAY | Monomorphic | 98.3 2 |
98.3 2 |
| Polymorphic | 95.45.5 |
95.45.5 |
|
| All markers | 97.0 3.8 |
97.0 3.8 |
|
| SNP-Invader | Monomorphic | 98.31.6 |
98.31.6 |
| Polymorphic | 94.26.3 |
94.26.3 |
|
| All markers | 95.55.4 |
95.55.4 |
Advanced Automation has more information about bar code labeling for agriculture.
Seed selection (chipping) technologies have helped to increase the throughput for genotyping without destroying the seed itself. Based on the genomic composition of seed (shown on the next slide), sampling the seed coat will only provide genomic information for the female parent, the endosperm (monocots) will provide information for both the male and the female parent (at unequal proportions). Although the embryo would provide equal proportions of the maternal and paternal genomes, it is not sampled to ensure seed viability.
Causes of Errors in Marker Data Production
Errors in Marker Production
Errors in marker production processes can have a huge impact on biological conclusions and, therefore, should not be neglected. Errors are due to various causes, but their occurrence and impact on data quality can be minimized by considering these causes in the production and analysis of the data. However, increased effort to control errors increases the costs per data point. Certain applications may require the most sensitive procedures and may warrant the high cost associated with error control, for example, procedures to estimate the degree of “contamination” with transgenes. There are other applications, however, which are more robust. For example, procedures for fingerprinting germplasm tend to be more robust, and even with considerable error they may still allow classification of germplasm into various categories (for example, different heterotic groups).
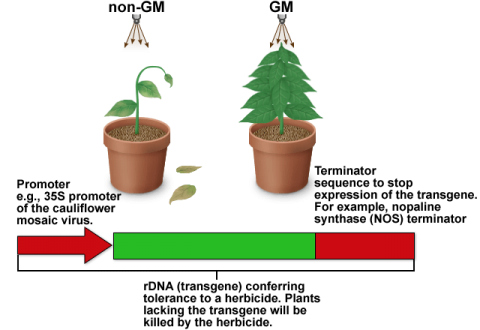
We will use testing of genetically modified organisms (GMOs) as an example of how errors may occur during various steps of data development, and how such errors can be minimized. GMO detection is conducted by both private and public entities and may focus on seed, food and feed. Testing of GMO is based on the detection of recombinant DNA (rDNA) or recombinant protein in the GMO.
GMO Detection Methods
Part A: GMO Detection Methods
The detection of rDNA (recombinant DNA) by the polymerase chain reaction (PCR) is widely used. Therefore, this section is entirely focused on causes of error in detection of rDNA (Fig. 4 and Table 5).
DNA-associated causes of errors that can impact the overall decision regarding presence or absence of rDNA in food and feed are listed in Table 5.
| Causes of error | How the error occurs | Effect of the error on data |
|---|---|---|
| DNA sequence flanking the marker | No amplification (or less efficient amplification) because of a mutation in the target primer sequence | Null product |
| DNA sequence flanking the marker | Insertion or deletion in the amplified fragment | Size homoplasmy of different targets |
| DNA sequence flanking the marker | In heterozygous individuals, preferential amplification of one allele when its denaturation is favored (because of low /GC content) | False-negative |
| Sample quality | ||
| Contamination of the DNA by foreign DNA | Amplification of non-target sequence | Mistaken product |
| Presence of inhibitors in DNA solution | Inhibition of restriction enzymes and PCR failure | False-negative |
| Biochemical artifacts and equipment | ||
| Low quality reagents | Poor fragment labeling and detection | False-negative, or mistaken product |
| Poor equipment precision or reliability | Uneven pipetting, evaporation during PCR, poor fluorescent label detection | False-negative, or mistaken product |
| Tag polymerase errors | Slippage in the steps of the PCR | False product |
| Tag polymerase errors | Incomplete addition of extra adenine residues at the 3′ end of the amplified fragments | False product |
| Lack of specificity | Amplification of non-specific products that is due to annealing of the primer to another locus | Mistaken product |
| Lack of specificity | Non-specific restriction reaction | Mistaken product |
| Electrophoresis artifact | Inconsistency of allele size between different experiments | |
| Electrophoresis artifact | Distortion of the allele size by factors that alter DNA migration through a gel (for example, temperature or high concentration of PCR products) | Size homoplasmy of different products; mistaken product |
| Human error | ||
| Sample handling | Confusion between samples (for example, mislabeling or tube mixing) | Mistaken product |
| Experimental error | Contamination with foreign DNA or cross-contamination between samples | Mistaken product |
| Experimental error | Use of wrong protocols (for example, omission of reagents, incorrect primers, or concentration of reactants) | False-negative; mistaken product |
| Data handling | Misreading of the profile or misidentification of florescence peak | Mistaken product |
| Data handling | Miscopying or confusion of the genotypes in the database | Mistaken product |
| Data handling | Data computation and analysis | Mistaken product |
PCR in GMO Testing
PCR is used to determine presence (end-point PCR) or amount based on quantitative PCR (qPCR) amplification of rDNA in a sample. Therefore, many factors that affect the PCR method will also have a bearing on application of this method in GMO detection.
The predominant use of PCR in GMO testing stems from the following reasons:
- PCR allows the detection of the smallest amounts of DNA.
- The entire PCR reaction can be completed within hours.
- Automation of the PCR process allows processing of hundreds of samples in parallel.
The success in detecting small quantities of rDNA depends on PCR sensitivity. The sensitivity of PCR is affected by various factors (Table 5). Another important aspect is specificity of PCR, which determines whether a specific target or multiple targets will be amplified by the reaction. Before preparing samples for PCR analysis two important questions arise (1) How much sample should be analyzed and (2) How does sample size affect limit of detection and limit of quantification.
Limit of Detection
The first challenge in GMO detection is defining the limit of detection. Limit of detection (LOD) is the smallest amount of GMO which can be detected quantitatively with a sufficient degree of precision.
The size of the genome of a species influences LOD of GM seeds in a ground sample. Using maize as an example, there is 0.0027% (wt/wt) of a single copy of the haploid maize genome in 100 ng DNA sample. Thus, levels of DNA below 0.0027% cannot be detected reliably in a 100 ng sample (Kay and Van dem Eede, 2001).
Limit of Quantification
Limit of quantification (LOQ) is the smallest amount of GMO for which a percentage can be determined with a sufficient degree of precision.
Reference Materials
Different kinds of reference materials are used as positive controls for qualitative and quantitative purposes in PCR-based detection. Certified powdered reference materials derived from GM and non-GM samples, or plasmids used for transformation can be used to validate PCR methods.
Sources of Error
Part B: Sources of Error in GMO Testing
Sources of error in GMO testing can be classified into two groups, (1) Pre-laboratory sources of error, and (2) Laboratory sources of error.
1. Pre-Laboratory sources of errors
a. GMO introgression into fields
The possible source of GMO in conventional fields is surrounding authorized trial or commercial cultivation of GM varieties. For example, the chance of pollen from a GM plant fertilizing a non-GM plant is high for open-pollinated plants than for self-pollinated plants, and increases in cases of wind pollination than insect pollination.
b. GMO introgression into fields
Minute quantities of GMO in seeds can be carried over to GM free seed lots during transport, especially when the same containers are used for transportation of both GM and non GM products. Moreover, the PCR method is highly sensitive such that small amount of rDNA in dust may result in false-positive results. Therefore, one of the most critical considerations in GMO testing is prevention of cross-contamination of the samples.
c. Sampling
In order to identify seed lots with detectable amounts of GM seed before marketing, sampling must be made immediately after harvesting at the processing facility. Importantly, seed lot testing plans must establish (a) the number of individual seeds to sample and test, and (b) the maximum number of unacceptable seed that can be tolerated in the sample before a decision is made to reject the seed lot.
GM Testing Plan
For example, a testing plan is designed such that less than 5 out of 500 individuals testing positive for rDNA is acceptable, but results above this threshold warrants rejection. Whether such a plan is “good” or “bad” cannot be ascertained until certain parameters are established using statistical models. The models help define the following:
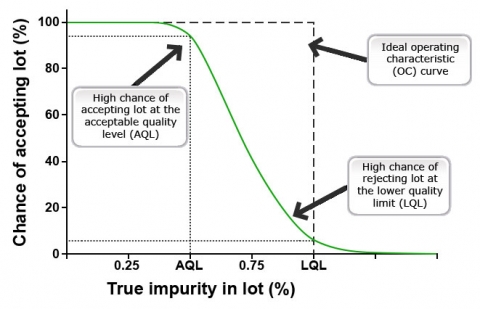
- Lower quality limit (LQL) is the lowest level of purity in the seed lot than can be regarded as acceptable to the consumer.
- Acceptable quality level (AQL) is the lowest level of purity in a seed lot that current production practices can support.
- Producer’s risk is regarded as the chance of rejecting a seed lot that is nearly pure.
- Consumer’s risk is the chance of accepting a seed lot that contains a small amount of GM seed. In ideal situations, the consumer may prefer complete purity, that means LQL = AQL = 100%. However, due to practical limitations complete purity of seed lots may not be achieved.
It is important that AQL >LQL to establish a reasonable testing plan that takes into account both producer’s and consumer’s risks. If AQL<LQL, it would be impossible to produce seed that is pure enough to be acceptable to teh consumer. For example, AQL and LQL of 99.9% and 99% respectively may require a testing plan that rejects at least 95% of the samples with purity levels at or below the 99% LQL and accept at least 90% of the samples with purity of 99% or greater. ,>
Operation Characteristic Curve
Producer’s and consumer’s risk probabilities are based on binomial distribution probabilities. The formulas used in the calculations are described in a report by Remund et al., 2001. A statistical program called Seedcalc is used to evaluate testing plans against established criteria. Figure 5 is an example of an operation characteristic (OC) curve generated by the Seedcalc tool.
Laboratory sources of error
a. Sample preparation
Reducing the laboratory sample by grinding can affect both LOD and LOQ of GMO in a sample. It is important to ensure that samples are ground to sufficiently fine particles. More particles are present in a sample of finely ground mix. Importantly, different particle sizes affect DNA recovery the performance of qPCR performance (Holden et al. 2003). Care must also be taken to prevent cross-contamination by dust during sample preparation. Dust suction systems may be installed to control contamination.
b. DNA extraction
As discussed earlier, PCR is an enzymatic reaction and can be affected by the presence of inhibitors and other substances that can impair specificity. Assessment of DNA purity is necessary and must be done prior to running a PCR reaction. Also, DNA extraction methods must be optimized for the relevant rDNA target and a species.
c. PCR detection
Ironically, the weakness of the PCR in the context of GMO detection is the high sensitivity of the reaction. This means, even minute copies of rDNA in a PCR mix may result in a false positive outcome. Importantly, the source of contamination is often the previous PCR products that may have spilled over, or dried up and spread in aerosols. Another important source of contamination is dust generated during grinding of materials containing rDNA. The risk of false positives is also high in laboratories that handle reference materials for verification of specific transgenic events.
Lab Error Sources – Various Results and Reactions
d. False-positives and false-negative results
In GMO testing if the test result is positive (genetic modification target is detected) when the actual condition is negative (GMO target is absent), this is referred to as a false positive. False positives occur due to carryover contamination with non-target DNA. The most significant source of contamination in PCR analysis is aerosols from previously performed PCR reactions and new samples. A false negative occurs if the test result is negative when the actual condition is positive. False negatives may occur due to certain causes of errors, for example, human error. Information is available about ways to prevent false positive in PCR analysis.
e. Unexpected reactions
Unexpected reactions may occur as a result of both human and mechanical errors. Failure to design primers may render the process of rDNA quantification unreliable due to lack or primer specificity. Technologies such as TaqMan (the module on Markers and Sequencing) require the design of a primer and a probe for each GMO. However, there are no standardized procedures for developing such TaqMan primers and probes. In addition, the polymerase and other PCR reagents may become defective through cycles of freezing and thawing and need to be tested whenever new supplies are purchased. Uncalibrated instruments such as spectrophotometers and pipettes may result in incorrect DNA concentrations.
f. Method validation
The goal of method validation is to evaluate the performance characteristics and limitations of GMO testing methods. Parameters used for method validation are described in the Parameters for GMO activity page.
Data Management and Quality Control
Parameters for GMO Detection
An example of a system for handling and managing marker data (Fig. 6) is provided by the International Center for Agricultural Research in the Dry Areas (ICARDA) Generation Genomic LIMS & GEMS. The ICARDA system consists of four main components offering users and researchers means to manage and share research information. The ICARDA LIMS & GEMS components are (1) LIMS Laboratory Information Management System, (2) GEMS Gene Management System, (3) Storage Management, and (4) Extra tools and services.
Steps in Genotyping Process
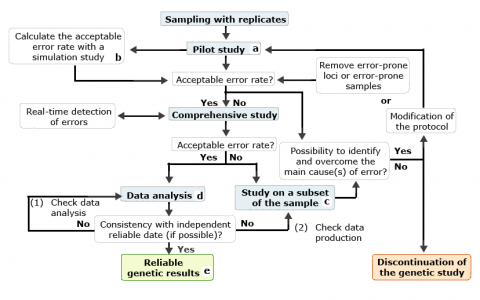
Steps that end with a superscript letter (a-e) are defined as follows:
- Objective is to estimate the error rate associated with the samples, the method and the protocol used. This may be done by replicating a sufficient number of samples.
- Deciding on an acceptable error rate depends on the error rate, the purpose of the genetic study, the genotyping method used, the ability to detect eventual errors and the cost in terms of money and time.
- The control study aims to find the cause of errors that did not exist in the pilot study.
- The calculated error rate must be considered in the data analysis.
- The results with a reliability index that is based on the error rate measured are used for breeding purpose.
Status of Marker Technology in Breeding Companies

In 2000, Monsanto Company switched to SNP-based genotyping at the Ankeny, Iowa facility with gel-free detection systems and a fully automated genotyping process. From 2000 to 2006, total molecular marker data point production grew over 40-fold, while cost per data point decreased over sixfold. More than 1 million SNP data points are handled per day by mostly automated pipelines in laboratories of major breeding companies.
For Your Information
- Read Cankar et al (2006) to learn about effects of DNA extraction method and sample matrix on quantification of genetically modified organisms.
- Read Holden et al (2003) to learn about evaluation of extraction methodologies for corn kernel DNA:
More information:
- Avoiding false positives with PCR:
- Microarray-technology-based approaches are used to detect selected targets by hybridization of labeled PCR-amplified products. For example, Xu et al. (2007) developed event-specific oligonucleotide array for soybean. Also, a low density-DNA chip for the identification of transgenic events in maize is available (Leimanis et al., 2006). It is important to note that failure in PCR amplification of a target or labeling of targets will lead to failure to detect a transgenic event in a sample.
- Event-specific detection of GM targets in soybean by microarrays.
- A microarray-based detection system for GM foods.
Lamb and Booker (2011) describe a statistical approach based on simulation modeling to quantify low levels of GMO contamination to account for false positive and negative results in GMO testing. The detection and quantification of the prevalence of genetically modified organism (GM) contamination in seed exports is a critical element of regulatory compliance. While the procedures to reliably detect high levels of GM contamination are well understood, no comparable statistical approaches are available for the quantification of levels of GM prevalence below the established detection rate of standard tests. We present a simple statistical approach based on simulation modeling for the quantification of low levels of GM contamination. The approach can be modified to match any sampling regime and can account for rates of false-positive and negative assay results. The application of this method is demonstrated using the low level of contamination in Canadian flax breeder seed lots by the GM flax variety ‘Triffid’. We show that GM contamination is likely present in seed lots at rates between two GM seeds per million and six seeds per hundred thousand. We also show that this low level of presumed contamination is indistinguishable from the number of positive tests expected from a clean seed lot given the potential rates of false-positive tests.
References
Cankar, K., D. Stebih, T. Dreo, J. Žel, and K. Gruden. 2006. Critical points of DNA quantification by real-time PCR effects of DNA extraction method and sample matrix on quantification of genetically modified organisms. BMC Biotechnol. 6:37.
Dayteg, C., S. Tuvesson, A. Merker, A. Jahoor, and A. Kolodinska-Brantestam. 2007. Automation of DNA marker analysis for molecular breeding in crops: practical experience from a plant breeding company. Plant Breeding 126: 410-415.
Eathington, S.R., T.M. Crosbie, M.D. Edwards, R.S. Reiter, and J.K. Bull. 2007. Molecular markers in a commercial breeding program. Crop Sci. 47(S3) S154-S163.
Holden, M. J., J.R. Blasic, Jr., L. Bussjaeger, C. Kao, L.A. Shokere, D.C. Kendall, et al. 2003. Evaluation of extraction methodologies for corn kernel (Zea mays) DNA for detection of trace amounts of biotechnology-derived DNA. J. Agric. Food Chem. 51: 2468-2474.
Holst-Jensen, A., M. De Loose, and G. Van den Eede. 2006. Coherence between legal requirements and approaches for detection of genetically modified organisms (GMOs) and their derived products. J. Agric. Food Chem. 54: 2799-2809.
Kay, S., and G. Van den Eede. 2001. Limits of GMO detection. Nature Biotechnol. 19: 405.
Kwok, S., and R. Higuchi. 1989. Avoiding false positives with PCR. Nature 339: 237-238.
Lamb, E. G., and H. M. Booker. 2011. Quantification of low-level genetically modified (GM) seed presence in large seed lots: a case study of GM seed in Canadian flax breeder seed lots. Seed Sci. Res. 21: 315-321.
Leimanis, S., M. Hernández, S. Fernández, F. Boyer, M. Burns, S. Bruderer, et al. 2006. A microarray-based detection system for genetically modified (GM) food ingredients. Plant Mol. Biol. 61: 123-139.
Pompanon, F., A. Bonin, E. Bellemain, and P. Taberlet. 2005. Genotyping errors: Causes, consequences and solutions. Nat. Rev. Genet. 6:847-859.
Prince, A. M., and L. Andrus. 1992. PCR: how to kill unwanted DNA. Biotechniques 12: 358-360.
Remund, K.M., D.A. Dixon, D.L. Wright, and L.R. Holden. 2001. Statistical considerations in seed purity testing for transgenic traits. Seed Sci. Res. 11: 101–119.
Querci, M., M. Van Den Bulcke, J. Žel, G. Van den Eede, and H. Broll. 2010. New approaches in GMO detection. Anal. Bioanal. Chem. 396:1991-2002.
Xu, J., S. Zhu, H. Miao, W. Huang, M. Qiu, Y. Huang, et al. 2007. Event-specific detection of seven genetically modified soybean and maizes using multiplex-PCR coupled with oligonucleotide microarray. J. Agric. Food Chem. 55: 5575-5579.
Zetzsche, H., H.P. Klenk, M.J. Raupach, T. Knebelsberger, and B. Gemeinholzer. 2008. Comparison of methods and protocols for routine DNA extraction in the DNA Bank Network. DNA Bank Network.
