
Chapter 1: Molecular Plant Breeding Concepts
Thomas Lübberstedt and Walter Suza
The surge in the development of new tools for molecular genetics between the 1980s and 1990s made it possible to identify genetic variation at the molecular level, and facilitated to understand the impact of genetic variants on the phenotype. Improvements in sequencing instrument capacity over the years have resulted in increased output (in kilo base pairs generated) in the last decade, allowing major sequencing projects to be completed.
- Be able to summarize basic breeding principles
- Review articles related to molecular plant breeding
- Familiarize with overall concepts in molecular plant breeding
Changes in Instrument Capacity and Developments in NGS
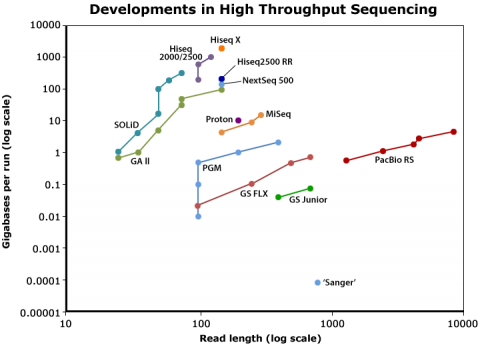
Sequencing technology (Fig. 1) has become dramatically more powerful over past 20 years or so, leading to reduced sequencing cost and increased volume of sequenced organisms. There also has been a rapidly increase in the number of (re-) sequenced genomes in databases.
DNA Sequencing Costs
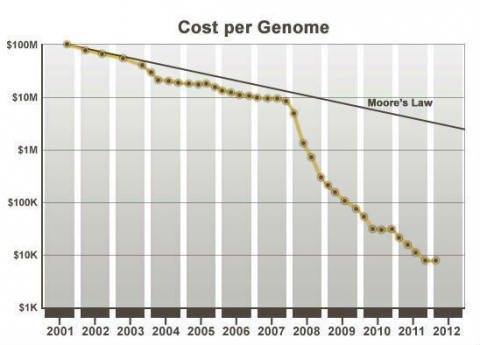
Improvement in DNA sequencing technology has had an impact on the cost of sequencing resulting in the rapid drop in the cost of sequencing per genome over the years (Fig. 2). DNA and other genomic technologies will be increasingly important in plant breeding because the relative costs of genotyping versus phenotyping have declined substantially (Eathington et al. 2007; Bernardo, 2008), while at the same time knowledge about genes, markers linked with genes/QTL has accumulated. Taken together this means, if an equivalent evaluation of breeding materials can be conducted at the DNA level compared to agronomic evaluation, it will become increasingly beneficial to switch to DNA assays. For this reason, molecular plant breeding combines conventional plant breeding methods with molecular approaches for the improvement of crop plants.
Traditional Plant Breeding
Genetic Structure of Variety Types
The genetic structure of variety types affects, which molecular methods can or cannot be applied to improve breeding materials. For example, marker-assisted backcrossing, which requires a homozygous recurrent parent, is not applicable to clone breeding, because clonal varieties are highly heterozygous. Thus, segregation in BC generations will make it impossible to recreate the recurrent parent.
Reproduction Systems, Propagation, and Types of Varieties
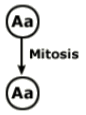
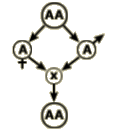
Plant species can be reproduced sexually, asexually, or by both modes (Fig. 3). Sexual reproduction occurs when the nucleus of a pollen grain unites with an egg cell in the ovary to produce the embryo of a kernel. Asexual reproduction represents the propagation of an individual from vegetative tissue.
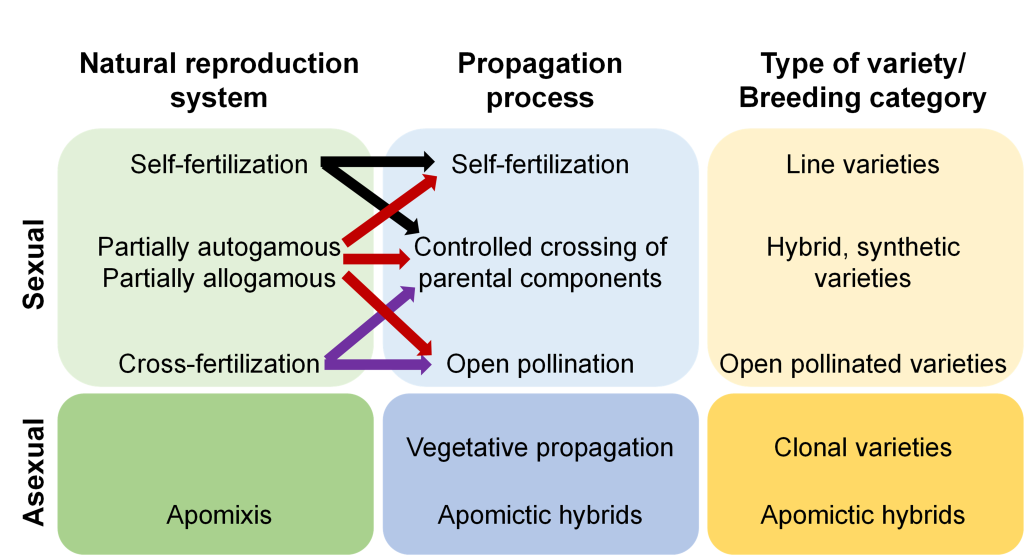
Fig. 3 Reproduction systems, propagation methods, and types of varieties.
Genetic Variation Within a Variety
The terms homogeneity and heterogeneity refer to the genetic relationship among plants in a cultivar. A cultivar is homogeneous when plants that make up the cultivar are genetically identical and heterogeneous when plants that make up the cultivar are genetically different.
Genotype Structures of Varieties
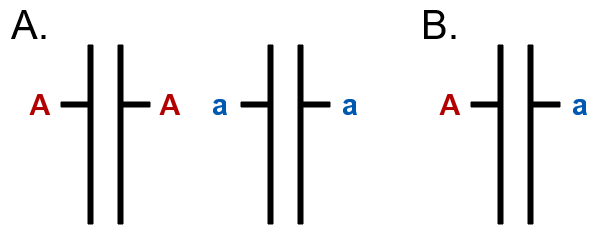
The terms homozygosity (Fig. 4A) and heterozygosity (Fig. 4B) refer to the genetic makeup of an individual plant in a cultivar. A locus is homozygous when the alleles at that locus are identical. The locus is considered heterozygous when the alleles at that locus are different. The level of homozygosity of a plant is a measure of the percentage of loci in that plant’s genome that are identical. The primary method of achieving homozygosity is by self-pollination of individuals, which is routine for developing pure-line cultivars, or inbred lines used to produce a hybrid. Heterozygosity results from crossing plants with different alleles at some or all loci. Crosses may be done by hand or through open pollination by wind or insects. Plants in a clonal, synthetic, or hybrid cultivar are highly heterozygous. Plants in a pure-line cultivar are homozygous.
Breeding Categories
A summary of breeding categories and their modes of propagation are provided in Table 1. The seed of a pure-line variety is produced by self-pollination. As a result, the individual plants are considered to be homozygous (have identical alleles at most or all loci) and homogeneous (genetically similar to other individuals in the variety).
| Clone breeding | Line breeding | Population breeding | Hybrid breeding | |
|---|---|---|---|---|
| Mode of propagation | asexual | sexual | sexual | sexual |
| Heterozygosity of plants | heterozygous | homozygous | heterozygous | heterozygous |
| Genetic variation within a variety | uniform | uniform | heterogeneous | uniform |
| Reproduction | possible
|
possible
|
possible
|
undesirable
|
Seeds of Hybrid Varieties
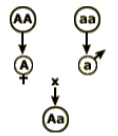
The seed of a hybrid variety used for a commercial planting is produced by crossing two genetically dissimilar parents. Therefore, the hybrid is heterozygous. There are multiple types of hybrids, including single-crosses, modified single crosses, three-way crosses, and double crosses. They differ in the number of inbred lines that are used to produce commercial seed. The F1 (hybrid) plants produced from a single-cross are genetically identical or homogeneous, but the plants in a three-way or double-cross hybrid are genetically different or heterogeneous.
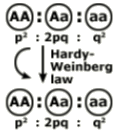
Synthetic and open-pollinated varieties are produced sexually by open pollination. As a result of open pollination, the plants in a commercial field of synthetic and open-pollinated varieties are heterozygous and heterogeneous.
Clonal varieties are reproduced asexually from a single plant that the breeder has selected. As a result, all of the plants in a clonal variety are genetically identical or homogeneous. Clonal varieties are also heterozygous since selection is practiced in the F1 generation.
Alternatives in Genetic Structure
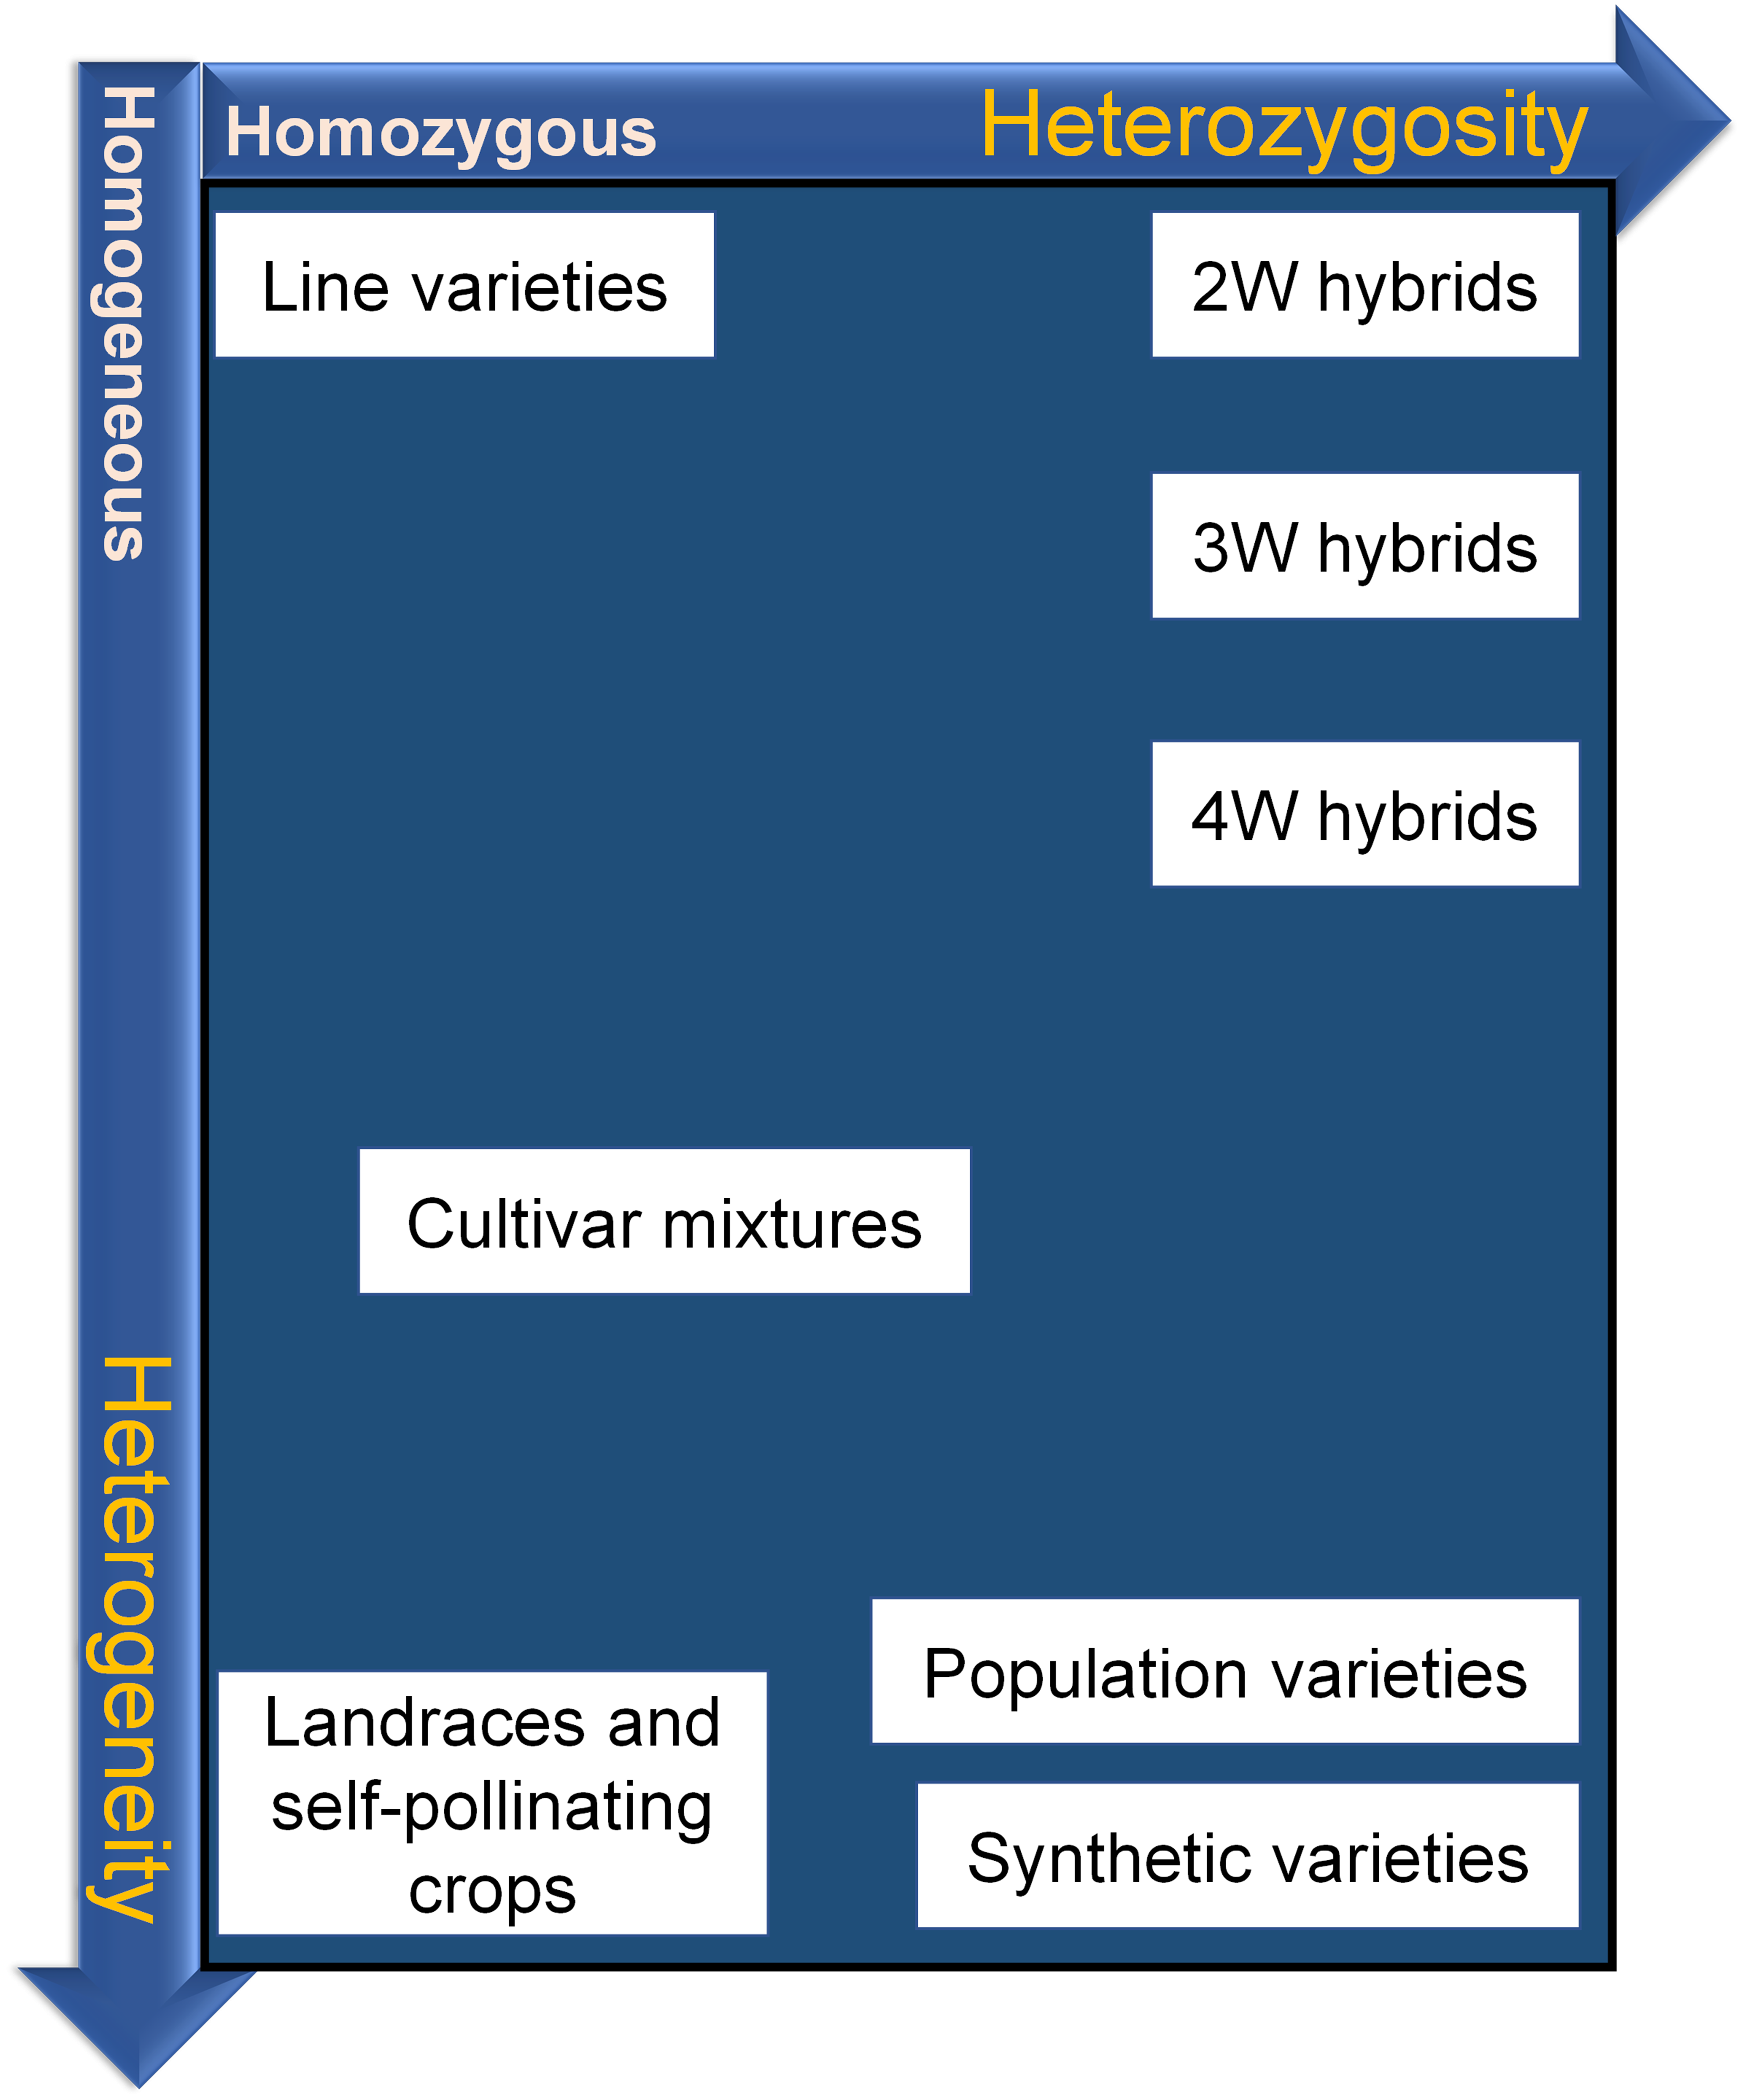
Figure 5 displays variety types based on the two genetic dimensions characteristic for any type of variety: degree of heterozygosity of individuals within varieties, and degree of heterogeneity of varieties.
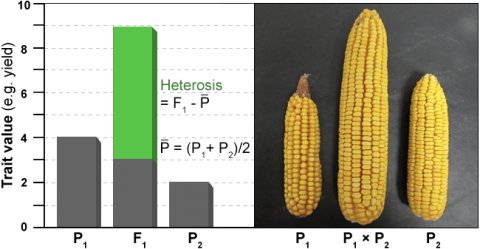
Heterosis
Heterosis, commonly referred to as hybrid vigor, can be expressed in many ways (Fig. 6). Two of the most common are mid-parent heterosis and high-parent heterosis. Mid-parent heterosis is measured as the performance of the hybrid as compared to the mean performance of its parents. High-parent heterosis is measured as the performance of the hybrid as compared to the best performing parent. Correlations between heterosis and hybrid performance are generally low.
Formation of Heterotic Groups
Formation of heterotic groups is important for maximizing the performance of hybrid cultivars. A heterotic group is a set of individuals, which generally perform well when grown in hybrid combination with an individual from a complementary heterotic group. An important heterotic group in U.S. elite maize is referred to as Stiff Stalk, which for the most part traces back to lines developed from the Iowa Stiff Stalk Synthetic (BSSS) a population developed by G.F. Sprague in 1933-34. In U.S. elite maize breeding, other heterotic groups are generally referred to as non-Stiff Stalk. U.S. breeders find that the best hybrid performance is generally obtained by crossing inbreds from the Stiff Stalks with those from one of the other heterotic groups (Fig. 6).
| Variety type | Advantages | Disadvantages |
| Line | Breeding and multiplication are relatively easy | Hetrosis is not exploited; Genetic vulnerability high, especially in diploids |
| Population | Heterosis is exploited; More stable, low genetic vulnerability | Genetic heterogeneity may result in presence of undesirable genotypes |
| Hybrid | Optimum exploitation of heterosis; Built-in penalty for reproduction and seed multiplication in farmers field; Product uniform in maturity, quality | Breeding and see multiplication; Genetically vulnerable |
| Clonal | Heterosis is exploited; Breeding relatively easy | High cost of vegetative propagation; Easy transmission of diseases, especially viral diseases |
Basic Steps in Traditional Breeding
Traditional plant breeding follows a cycle of activities (Fig. 7). Several basic breeding methods are available with numerous modifications. The approach chosen depends primarily on the reproductive biology of a crop species.
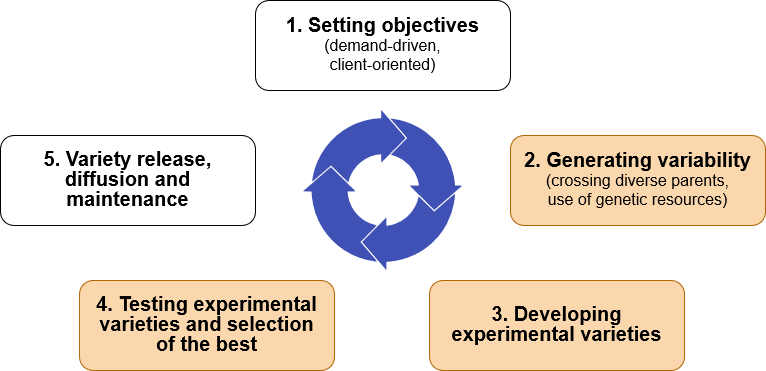
Economic factors and environments and resources available are important considerations in determining the optimal approach. Therefore, details for steps 2, 3, and 4 in Fig. 7 are different for each breeding program and breeding category. However, the basic steps are identical for developing any cultivar, and will be used to structure the second half of this course.
Integration of Molecular Genetics and Biotechnology with Plant Breeding
New Technology
The past few years have seen an explosion of new technology and data in the area of molecular genetics and genomics. New technology and information from the analyses of massively-produced genomic sequence data will help increase plant breeding efficiency. Integration of genomics and plant breeding is also useful for research on gene function, development of markers and transgenic varieties (Fig. 8).
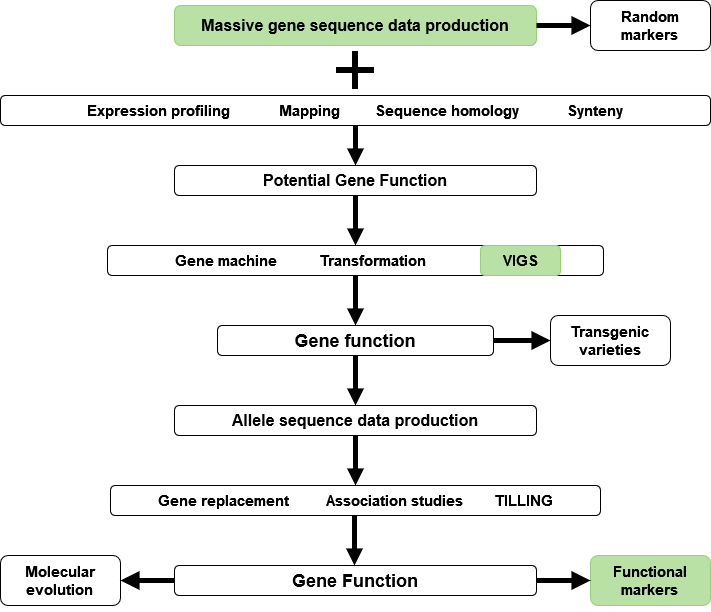
Data obtained from sequencing can be used to determine gene expression patterns, homology, and syntenic features. Gene sequence information can also be used in mapping experiments to isolate loci of interest. Plant transformation by biolistic methods or Agrobacterium, and virus-induced gene silencing (VIGS) strategies are used to establish gene function. Genes of interest identified from genomics experiments can be used to engineer novel traits in transgenic varieties. Also, information on gene function is useful for reverse genetics strategies to replace genes, perform association studies, or targeted mutagenesis (targeted induced local lesions in genomes – TILLING) for crop improvement. Ultimately, integration of genomics and breeding tools (Fig. 8) can generate information about allele function and identify sequence motifs for use as functional markers, or as tools for molecular evolution studies.
Application of Markers in Plant Breeding
In general, marker-assisted plant breeding involves (1) marker-assisted selection (MAS), where a marker is associated with a trait of interest; (2) marker-assisted backcrossing (MABC) to recover the recurrent parent with a trait of interest; (3) marker-assisted recurrent selection (MARS) for quantitative trait loci (QTL) using a panel of polymorphic markers that are linked to the QTL of interest, and (4) genomic prediction of line, more generally genotype or population performance. Moreover, markers can be used in discovery projects for identifying new marker trait associations, fingerprinting germplasm to help select parental lines and understand structure of germplasm, among others. Information in Table 3 illustrates the versatility of molecular marker application for biodiversity monitoring, germplasm maintenance, breeding and registration of varieties.
| Basic steps in plant breeding | Tasks that can be addressed with genomics tools |
| Genetic resources | Biodiversity monitoring Registration and maintenance |
| Phase I: Production of genetic variation | Selection of complementing parents Targeted gene introgression Controlled recurrent selection |
| Phase II: Development of variety parents | Genomic prediction of genetic potential Pyramidization (stacking) Prediction of best hybrids |
| Phase III: Testing of experimental varieties | Reduced testing (costs) |
| Registration | Variety protection (UPOV) Patenting |
Diagnostics in Plant Breeding
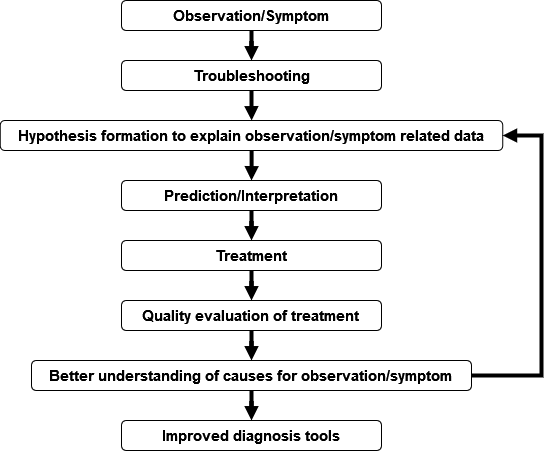
Diagnosis
Dia means “apart”, gno means “to know or discern things.” In the medical area, the term diagnosis is used, to describe the process to identify and determine the nature and cause of symptoms through evaluation of pre-existing data (such as patient history), examination of patients by using conventional or laboratory methods to generate and ultimately interpret those different sources of information. In a biological sense, diagnosis deals with characterizing the distinguishing features of, e.g., an organism in a taxonomic context. In the broadest sense, diagnostics is about application of quantitative methods for interpretation of data (Fig. 9).
Major Tasks
In plant breeding, the major tasks are:
- generation of genetic variation as a source for
- developing components of varieties, and
- testing of experimental varieties (Lubberstedt 2013).
All three of these key tasks can be performed intuitively based on the experiences of plant breeders, but they increasingly benefit from diagnostic procedures.
Central questions in plant breeding revolve around:
- identification of the best founder genotypes at the outset of breeding programs to generate genetic diversity, which relates to the usefulness concept in plant breeding,
- identification of the best variety components (such as inbred lines) or varieties, and
- evaluation of the performance of combinations of variety components such as experimental hybrids.
Traditionally field trials (similar to clinical trials) are used, to address all three of those questions. Increasingly, DNA-based markers are used in marker-aided procedures to support or substitute field trial based evaluation. To a more limited extent compared to medicine, non-DNA based “biomarkers” are employed in plant breeding. However, in all cases, the purpose of using respective test procedures is to reliably predict optimal genotypes or genotype combinations. With technological progress in the area of genomics, the question becomes, whether novel procedures provide such predictions more reliably, in shorter time, and/or at lower costs compared to traditional procedures.
Classification of Diagnostic Methods
There are different classifications of diagnostic tools (Table 4). Diagnostics can be based on phenotypic characters, or on molecular features. Phenotypic characterization can be based on destructive (after harvesting plant materials and any kind of treatment) or non-destructive methods (such as spectral characterization or seed color markers). Non-destructive methods have the advantage of not interfering with normal growth and development of the organism. For example, seed can be classified and sorted into desirable and undesirable with regard to, e.g., oil content, before sowing. However, for several traits, such non-destructive methods are not available. An example might be inducible resistance in the absence of a pathogen.
| Classification of Diagnostic Methods | Distinguishing Features |
|---|---|
| Destructive vs. non-destructive | Samples get destroyed with destructive methods, thus, non-destructive methods are preferable. A recent example is seed chipping, allowing characterization of seed fractions, without interfering with seed germination. |
| Phenotypic vs. molecular | Phenotypes can be strongly affected by non-inherited environmental factors. DNA-based methods exhibit much greater heritabilities, i.e., they are not as strongly influenced by environmental factors. |
| DNA vs. non-DNA biomarkers | DNA-markers report the potential or risk for target trait expression, whereas non-DNA biomarkers have the capability of reporting the onset or expression of a target trait (such as medical biomarkers for disease onset) |
| Functional vs. random DNA-markers | Functional markers are derived from polymorphisms causally affecting target target trait expression; in contrast, most random DNA-markers are effective by linkage with respective causal polymorphisms. |
| Technical classification biomarkers | Depending on the molecular class: DNA, RNA, Proteins, metabolites |
| Technical classification DNA-markers | Can be depending on the underlying DNA polymorphism (SNP, INDEL, SSR) or detection technology. |
Using Molecular Techniques
A major reason for using molecular techniques is the ability to monitor or predict a trait of interest, before it becomes phenotypically visible. The best examples probably are related to human diseases. Based on molecular markers it is possible to predict the risk of individuals to suffer from a particular disease (based on DNA markers), but also to determine the onset of a disease such as cancer (based on non-DNA expression markers). Prediction of the onset of a disease might be crucial to determine the timing and mode of therapies. In plant breeding, seed chipping has been developed to allow selection prior to sowing of selected kernels based on DNA markers, which effectively reduces costs for cultivation and evaluation of undesirable genotypes.
For molecular markers it is practical to distinguish DNA-based and non-DNA based markers. Because DNA is present in each cell and not affected by environment, DNA-based information is consistent across plant organs, developmental stages, and environments or treatments. This can be an advantage in terms of robustness of information. However, the limitation of DNA-based markers is, that they do not provide information on changes in plant development or responses to environmental factors. Thus, DNA markers enable to assess the potential of a particular genotype to develop a particular phenotype. However, they provide no information on actual metabolic processes that can be monitored by non-DNA molecular markers. Within both DNA and non-DNA markers, there are various technological and economic criteria.
Diagnostic Procedures
Another mode of discrimination of diagnostic procedures is based on the question, whether they report on causative factors resulting in phenotypic changes, or whether their predictive value is based on association. For DNA, so called “perfect”, “ideal”, or “functional” markers (Andersen and Lübberstedt, 2003) have been described (FMs: will be used in the following for simplification). These FMs are derived from polymorphisms within genes, which cause trait variation.
Thus, in the case of presence of a particular allele at a polymorphic site within a resistance gene (as example), it can be predicted that the respective genotype will be resistant to a particular disease (isolate). Once established, resistance assays on plants are no longer required for this particular disease. In contrast, if a DNA marker is linked to a resistance gene, its informativeness depends on the linkage disequilibrium present in the breeding population.
Other approaches based on random DNA markers are receiving increasing attention in plant breeding in relation to genomic selection strategies (Heffner et al., 2010). This is to a large extent driven by progress in sequencing and DNA marker technology, which allows genotyping of breeding populations with 1000s of markers per genotype at low costs. Genomic selection has initially proven to be successful in animal breeding, and has more recently been employed in the plant breeding context. With increasing information on genes affecting traits of interest and knowledge on causative polymorphisms, in the longer run combined approaches based on FMs and genomic selection for unexplained genetic variation will be developed.
Perspectives
Whereas genomic selection will likely become a major research area in plant breeding in the coming years, its objective is neither gene nor quantitative trait polymorphism (QTP) identification. Nevertheless, progress in genetic studies of agronomic traits, driven by progress in sequencing technology, and based on genome-wide association studies, map-based gene isolation, among others, can be expected to lead to a dramatic increase in the number of genes and QTP identified with impact on agronomic traits in the next decades. The question then becomes in the longer run, whether more targeted approaches to select for optimal haplotypes and genotypes will be more effective than genomic selection, which might lead to fixation of unfavorable haplotypes. In medical sciences, non-DNA biomarkers play a much greater role than in plants. Whereas the risk as determined by DNA markers (equivalent to the term “potential” in plants) in medical sciences might be of some value for individuals, employers, insurances, it is more critical to know, whether a particular condition occurred, which requires a treatment. This is also true because a genetic treatment by gene therapy is in most cases not available. Understanding the molecular mechanism(s) underlying a particular disease can be instrumental for developing a respective treatment. This concept might in the longer run also be of interest for crop sciences. If compounds would become available that help to counteract particular forms of stress, application of such compounds by spraying or seed coating might substitute or complement respective breeding efforts for improving agronomic performance.
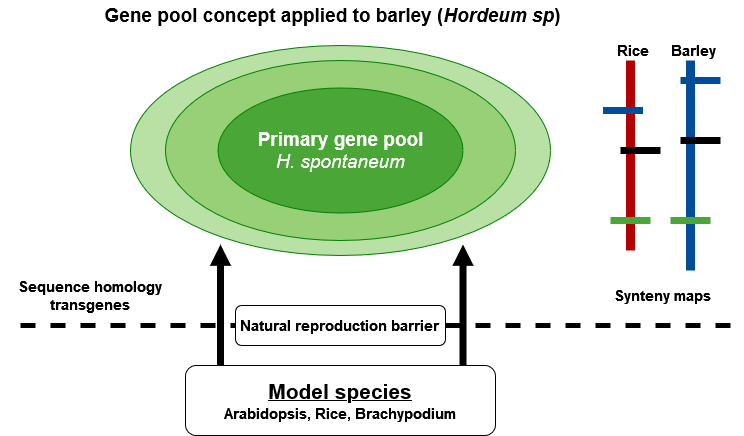
Use of Genomics and Biotechnology
Genomics and biotechnology expand the pool of genes that can be tapped into by natural barriers of reproduction (Fig. 11). Moreover, by establishing and exploiting genomic information beyond reproduction barriers using synteny relationships of genomes within families, information about the location of valuable genes can be efficiently transferred. More specifically: transformation helps to introduce even microbial genes into plants. Markers help to establish relationships between related genomes. In this way, detailed information obtained in model species can be transferred to related non-model species and make efforts more efficient to isolate genes for traits of interest in related crop species (such as cereals or brassica species). Altogether, this broadens access to a wider range of genetic variation, and makes its exploitation more targeted.
References
Bernardo, R. 2002. Breeding for quantitative traits in plants. Stemma Press, Woodburry.
Bernardo, R. 2008. Molecular Markers and Selection for Complex Traits in Plants: Learning from the Last 20 Years. Crop Sci. 48:1649-1664.
Cabrera-Bosquet, L., J. Crossa, J. von Zitzewitz, M. D. Serret, and J. L. Araus. 2012. High-throughput phenotyping and genomic selection: The frontiers of crop breeding converge. J Integr Plant Biol 54:312-320.
Eathington, S. R., T. M. Crosbie, M. D. Edwards, R. S. Reiter, and J. K. Bull. 2007. Molecular markers in a commercial breeding program. Crop Sci. 47(S3): S154-S163.
Heffner, E.L., A.J. Lorenz, J. Jannink, and M. E. Sorrells. 2010. Plant breeding with genomic selection: potential gain per unit time and cost. Crop Sci 50:1681-1690.
Lübberstedt, T. 2013. Diagnostics in plant breeding. In: Diagnostics in Plant Breeding, Lübberstedt,T. and Varshney R. Eds., Springer, pp. 3-10.
Mardis, E. R. 2011. A decade’s perspective on DNA sequencing technology. Nature 470: 198-203.
Moose, S. P., and R. H. Mumm. 2008. Molecular plant breeding as the foundation for 21st century crop improvement. Plant Physiol. 147: 969-977.
Nakaya, A., and S. N. Isobe. 2012. Will genomic selection be a practical method for plant breeding? Ann Bot. doi:10.1093/aob/mcs109
Nederbragt, Lex. 2012. Developments in NGS. figshare. http://dx.doi.org/10.6084/m9.figshare.100940
Schnell, F.W. 1982. A synoptic study of the methods and categories of plant breeding. Z Pflanzenzüchtg. 89:1-18.
Wetterstrand KA. DNA Sequencing Costs: Data from the NHGRI Large-Scale Genome Sequencing Program. Available at: www.genome.gov/sequencingcosts
