
Chapter 12: Genomic Tools for Variety Registration and Protection
Thomas Lübberstedt and Laura Merrick
Plant variety protection requires registration and evaluation of attributes that characterize the cultivar, which until recently mainly constitutes characterization by traditional (non-molecular) methods (e.g., statistical data of morphological traits, color chart references, disease resistance). However, there is an increasing interest in using molecular markers for variety registration and protection. Focus on testing of genomic methods to identify those that will allow for discrimination among varieties includes attention to the concept of essentially derived varieties (EDV). The impact is that if a variety is tested and then classified as EDV, then ownership rights can be exercised in the form of demand for payment and authorization on the part of the holder of the proprietary variety from which the new variety is said to have been derived. Molecular breeding methods themselves—not just plant varieties—are also affected by IPR—particularly by patents. Such methods and materials include the following (Xu 2010):
- Methods for generation, identification, and transfer of genetic variation
- Selection of genetic variation
- Genetic materials (DNA, markers, genes, sequences)
- Methodologies [marker detection, marker-assisted selection (MAS), genetic transformation, plant generation]
Kesan (2007) provides a good summary of the intellectual property alternatives available for protection of plant material in a chapter in the online book Intellectual Property Management in Health and Agricultural Innovation: A Handbook of Best Practices.
- Learn the role of international agencies (e.g., ISF, OECD, UPOV, AOSCA) involved in setting policies, regulations and rules for
- certified seed production
- variety registration
- variety protection
- Understand the use of genomic tools in maintenance breeding to retain genetic purity and trait stability of registered crop varieties propagated for seed dissemination
- Become aware of the use of genomic tools for monitoring and detecting the absence or presence of transgenes and learn the concept of coexistence in relation to the production and marketing of genetically modified (GM) and non-GM crops
- Review alternatives for using DNA and non-DNA markers for variety registration and variety protection
- Compare plant variety protection available under “Plant Breeders’ Rights” within UPOV Conventions to plant-related intellectual property protection available from patents
- Learn about the concept of DUS (distinctiveness-uniformity-stability) as part of the required testing of candidate plant varieties for certified cultivar registration and consider the pros and cons of DNA-based markers in DUS testing schemes
- Describe the concept of essentially derived varieties (EDV) and the role that DNA markers could play in establishing and enforcing legal protection in relation to known EDVs
International Rules for Certified Seed Production
Effects of Concentration in Global Seed Security
Starting in the 1970s, the commercial seed industry began restructuring dramatically through a series of mergers, consolidations and integration of the whole seed chain (Howard 2009). The Seed Industry Structure graphic was developed by Philip Howard (Howard 2009, 2013, 2023) to illustrate the mergers in these sectors that took place during the decade or so that began in the mid-1990s.
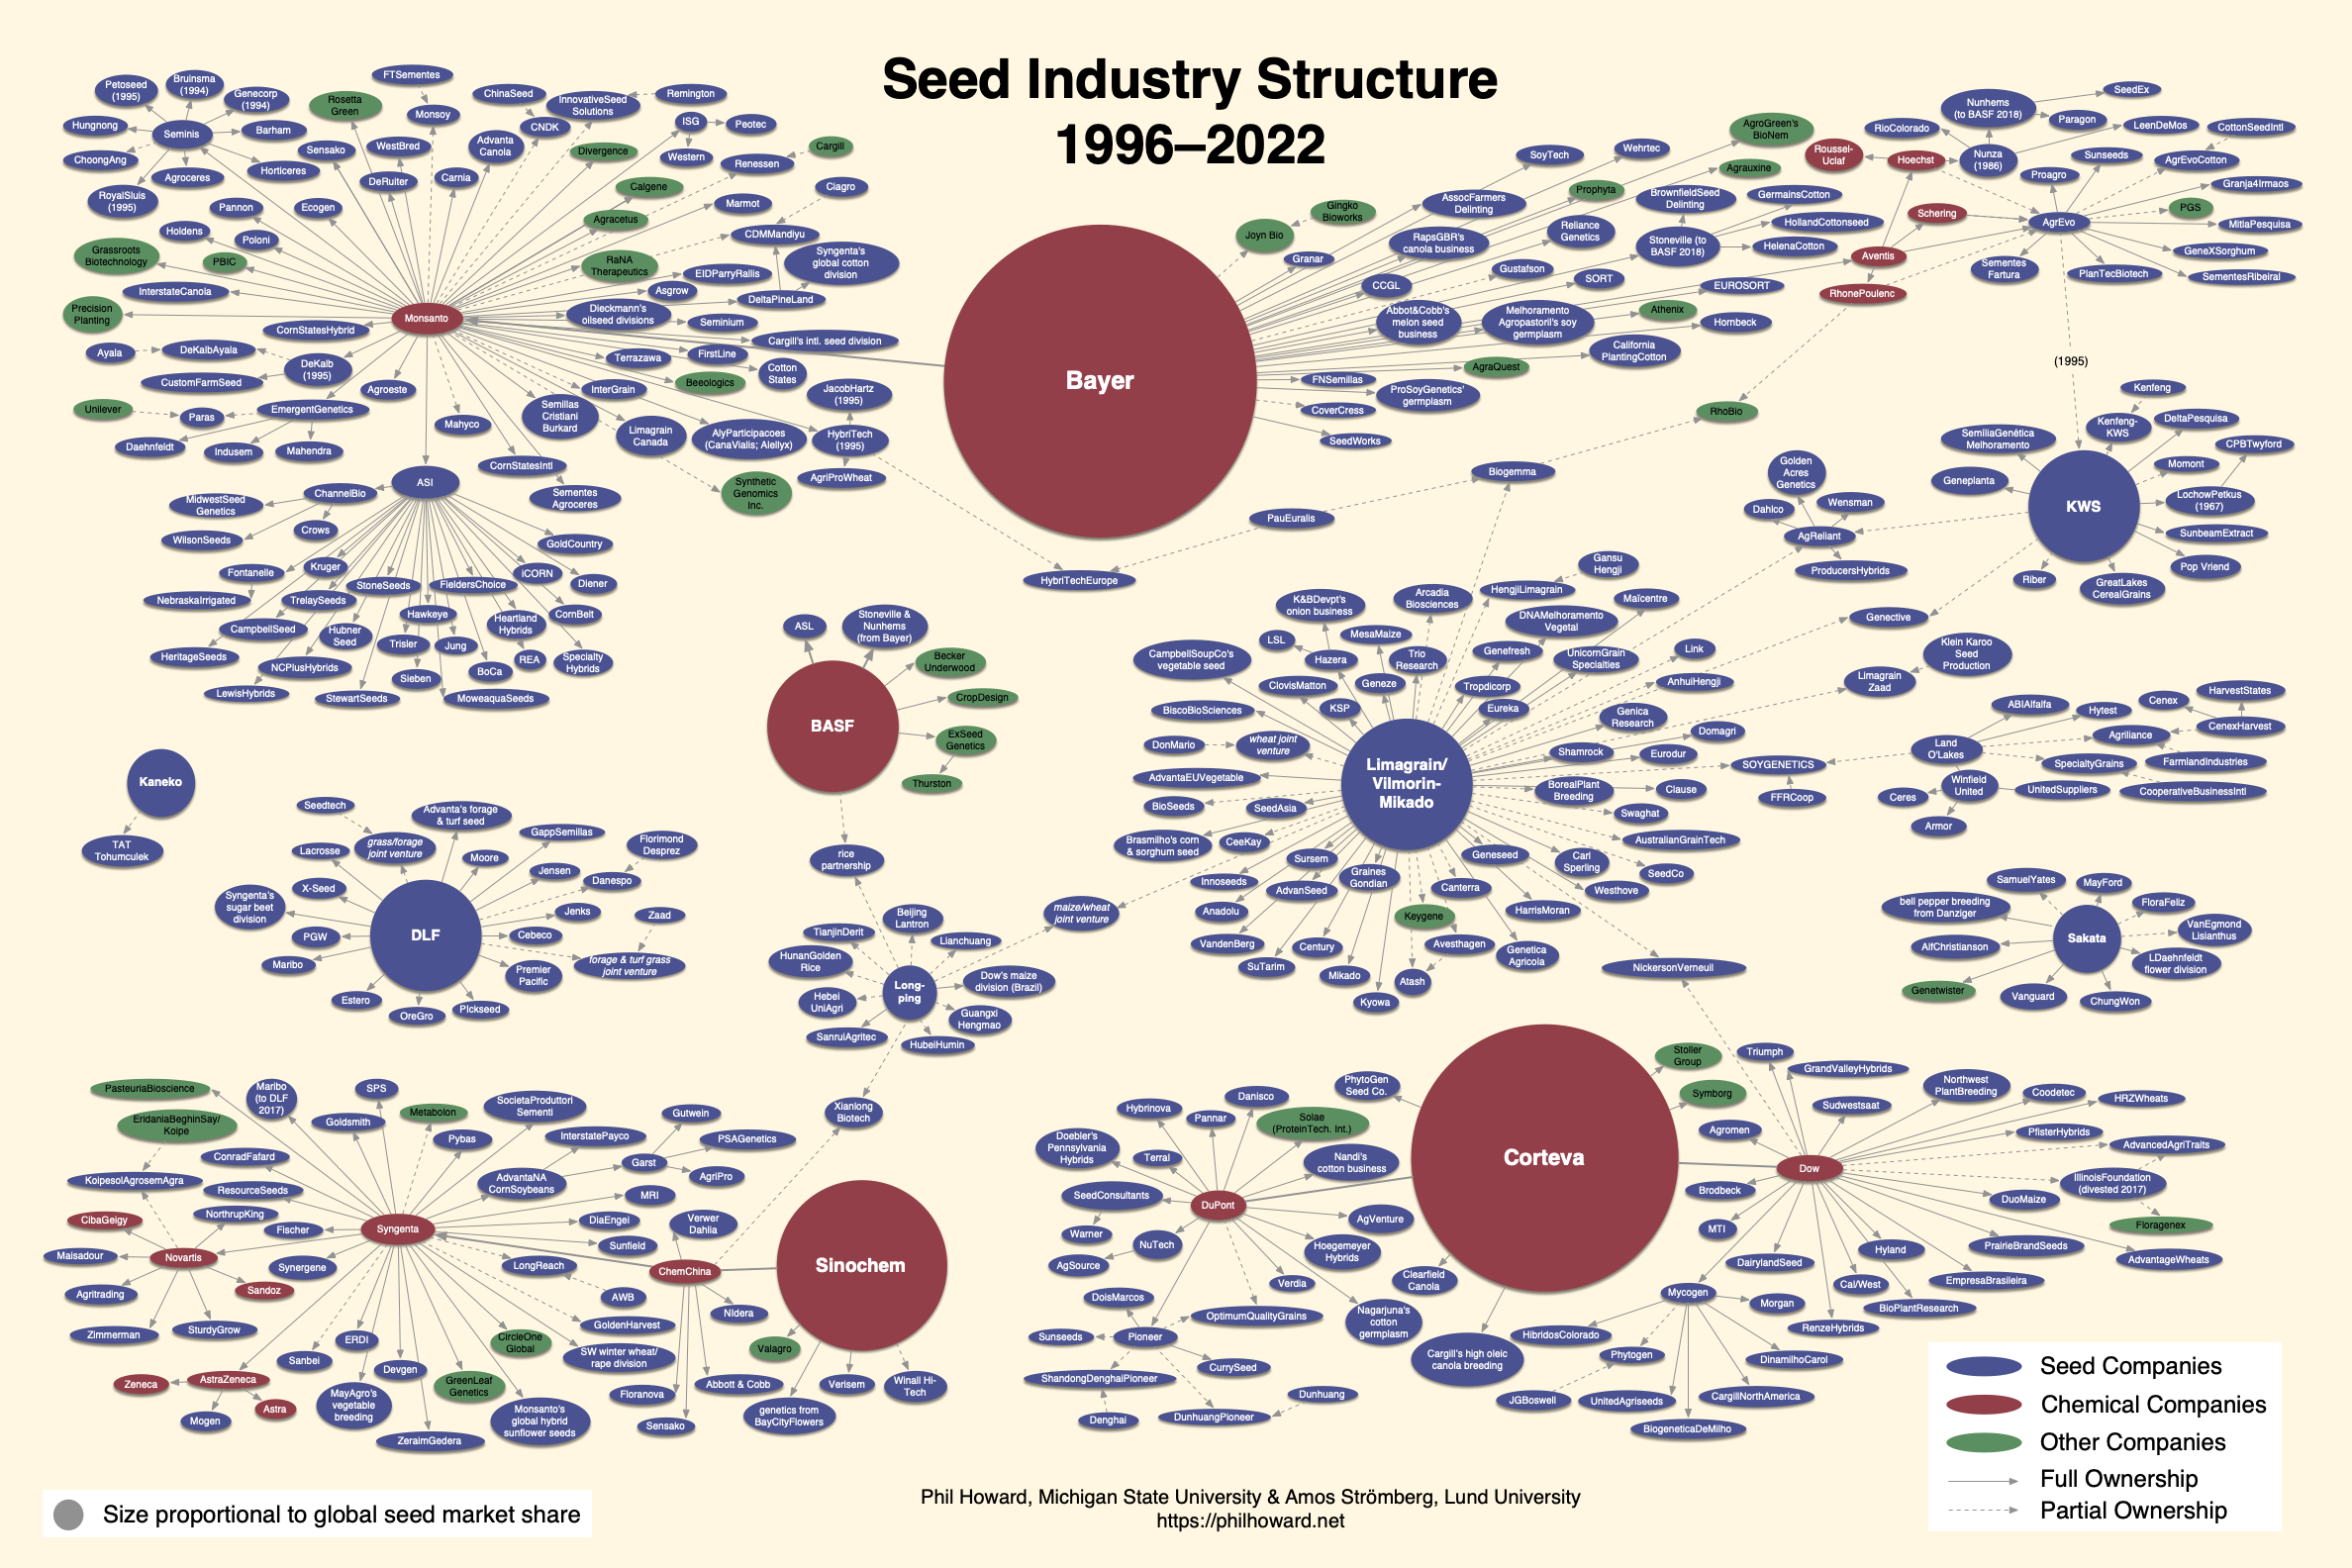
Simultaneous concentration in global agricultural biotechnology and chemical sectors impacted the commercial seed industry, but also farmers as their target market. The concentration of agricultural biotechnology-related sectors also influenced the conduct of plant breeding in both private and public sectors in the United States and elsewhere (Fernandez-Cornejo 2004, Kloppenburg 2005). A document from the United Nations Food and Agriculture Organization titled Seed Systems and Plant Genetic Resources of Food and Agriculture (Louwaars et al. 2011) provides examples of concentration in the seed industry:
“The top five companies now account for over 30% of the global commercial seed market, but in some sectors, the concentration is higher: in the sugar beet seed market the top three companies now account more than 90% of the market, the top five maize companies account for around 85% of the maize market and the top five vegetable seed companies represent around 70% of the vegetable seed market. Increasingly the emphasis is on the crops with the highest profit margins and the largest markets.”
Regulation and Policies Impacting Crop Improvement and Cultivar Development Worldwide
The increasingly globalized nature of the seed industry has spurred development of seed-related associations at national, regional, and international levels. Such associations help to set rules and advocate for their members in relation to laws that “generally regulate the release of new varieties, control the quality of seed, and, increasingly, protect new varieties through plant breeder’s rights. One important trend is the growing use of accreditation principles in some countries, introducing private certification and testing services or in-company systems to replace or complement government tasks” (Louwaars et al. 2011). The European Union, for example, maintains and updates region-wide variety lists (known as the Common Catalogue), uniform certification methods, and seed quality standards. Increasingly as well, individual countries—both developed and developing ones—are also adopting such standardized lists and methods, which are often modeled on guidelines that have been agreed upon by international organizations or agencies.
Rules and Standards Set by International Seed Federation and Allied Organizations
One organization that sets rules governing seed trade on a global scale is the International Seed Federation. The efforts of the ISF date back to 1924 through the work of two allied organizations on which it was founded, although ISF itself was officially started in 2002. “[ISF] represents the interests of the mainstream of the seed industry at a global level through interaction and dialogue with public and private institutions that have an impact on international seed trade” (ISF 2013a). By 2008 there were 70 countries in the Federation. The mission of the ISF is to:
- Facilitate the international movement of seed, related know-how, and technology
- Mobilize and represent the seed industry at a global level
- Inform its members
- Promote the interests and image of the seed industry
ISF Activities
The ISF carries out the following activities (ISF 2013a):
- Hosts annual congresses on recent developments in seed trade and plant breeding
- e.g., environmental and health issues, regional trade groupings, new technological advances, greater globalization, increased farmer and consumer sophistication
- Facilitates internal and external communications
- e.g., congress reports, newsletters, seed trade statistics, web site and print communiques
- Issues rules to standardize contractual relations between buyers and sellers at the international level
- Provides procedural guidelines for dispute settlement in areas of trade and IPR
- Represents and promotes the seed industry at a number of intergovernmental organizations (Table 1)
| Intergovernmental Organization | Abbreviation |
|---|---|
| Convention and Biological diversity | CBD |
| Food and Agriculture Organization of the United Nations | FAO |
| International Plant Protection Convention | IPPC |
| International Seed Testing Association | ISTA |
| International Union for the Protection of New Varieties of Plants | UPOV |
| Organization for Economic Cooperation and Development | OECD |
| World Intellectual Property Organization | WIPO |
International Seed Federation Rules Effecting Crop Varieties
Members of the ISF have to adhere to official national rules and standards, but also have to follow rules and guidelines set internationally by the Federation. The most recent version of the ISF Rules and Usages for the Trade in Seeds for Sowing Purposes was adopted by the ISF General Assembly in Rio de Janeiro, Brazil in June of 2012 (ISF 2013b).
In the ISF Rules and Usages document, there are general instructions and guidelines pertaining to such activities as seed contracts, obligations of parties, seed certification and testing (including control of varietal “trueness to type”), import or export authorization, multiplication of stock seed, shipment instructions, payment, and dispute resolution. In the document, tolerance levels are set for purity, other crop seeds, weed seeds, inert matter, germination, and seed moisture content and there are also specific rules pertaining to particular types of crops:
- Seeds of field crops
- Seeds of forage and turf crops
- Vegetable and ornamental species
- Tree and shrub seeds
ISF Rules and Usages Example
For example, Table 2 shows rules for seed purity and germination percentages adapted from “Part C-Vegetable and Ornamental Species” in the Specific Rules section of the 2013 ISF Rules and Usages document.
| Family | Crop | Species | Purity | Germination |
|---|---|---|---|---|
| AMARANTHACEACE | Orach | Atriplex hortensis | 95 | 70 |
| Swiss Chard | Beta vulgaris | 98 | 80 | |
| Beet | B. vulgaris | 99 | 80 | |
| AMARYLLIDACEAE | Welsh Onion | Allium fistulosum | 99 | 80 |
| Leek | A. ampeloprasum | 99 | 80 | |
| Onion | A. cepa | 99 | 80 | |
| Chives | A. schoenoprasum | 98 | 80 | |
| APIACEAE | Dill | Anethum graveolens | 97 | 80 |
| Chervil | Anthriscus cerefolium | 99 | 80 | |
| Celery/Celeriac | Apium graveolens | 99 | 80 | |
| Parsnip | Pastinaca sativa | 95 | 75 | |
| Parsley | Petroseliunum crispum | 99 | 75 | |
| ASPARAGACEAE | Asparagus | Asparagus officinalis | 99 | 80 |
| BRASSICACEAE | Upland Cress | Barbarea verna | 98 | 85 |
| Garden Cress | Lepidium sativum | 98 | 90 | |
| Watercress | Nasturtium officinale | 98 | 80 | |
| FABACEAE | Lentils | Lens culinaris | 99 | 85 |
| Common Bean | Phaseolus vulgaris | 99 | 85 | |
| Runner Bean | Ph. coccineus | 99 | 82 | |
| Pea, wrinkled | Pisum sativum | 99 | 87 | |
| Pea, round | P. sativum | 99 | 88 | |
| Sugar Pea | P. sativum | 99 | 87 | |
| LAMIACEAE | Basil | Ocimum basilicum | 97 | 75 |
| Marjoram | Origanum majorana | 97 | 70 |
Setting Standards for Variety Identity and Variety Purity
International Seed Federation sets standards for both plant variety identity and variety purity. In the ISF Rules and Usages document (ISF 2013b), the term certification (of a seed lot) is defined as follows:
“… Commonly this term identifies the activity of assessing varietal identity, variety purity and other standards. The most common are the OECD Seed Schemes, AOSCA Standards/Guidelines and the EU norms”.
OECD and AOSCA are abbreviations for the following international agencies:
- OECD (Organization for Economic Co-operation and Development) is an international organization that sets standards through the OECD Schemes for the Varietal Certification or the Control of Seed Moving in International Trade (OECD 2013).
- AOSCA (Association of Official Seed Certifying Agencies) is the main organization for establishing standards for certified classes of seed (genetic purity, cultivar identity, and quality assurance) in North America and certain countries elsewhere (United States, Canada, South America, Australia, and New Zealand); AOSCA cooperates closely with OECD.
Molecular Characterization
By definition, OECD states that variety “… denotes an assemblage of cultivated plants which is clearly distinguished by any characters (morphological, physiological, cytological, chemical, or others) and which, when reproduced (sexually or asexually), retains its distinguishing characters.” OECD rules (OECD 2013) indicate that a so-called “National Designated Authority” must check that a variety is distinct and has sufficiently uniform and stable characters, which is typically abbreviated in English as DUS (Distinctiveness, Uniformity, Stability).
AOSCA runs a program called Identity Preserved or IP, which “refers to the maintenance of a product’s specific traits or characteristics through growing, production and marketing channels [and] the purpose of AOSCA IP’s certification program is to assist in preserving the genetic and/or physical identity of a product” (AOSCA 2013).
Molecular Characterization In Relation to Registration and Variety Protection of Plants Derived From Biotechnology
Plant varieties derived from biotechnology must be characterized as part of their registration and plant varietal protections enacted in association with commercial release. Molecular characterization is also utilized as an aid to inform risk and safety assessment of genetically modified plants both when they are being evaluated for commercialization and after they are registered, marketed, grown by farmers, and in the case of food crops eaten by consumers.
Characterization at the molecular level of plants derived from biotechnology can focus on inserted DNA within the plant genome, the insertion site itself, expressed material (RNA and protein) or intended and potentially non-intended effects of transformation.
Main Considerations
Molecular characterization of genetically modified (GM) plants focuses on the following three main considerations:
- Transformation method
- Description of the transformation procedures
- Description of DNA sequences to be inserted into the plant genome
- Inserted DNA, insertion site and expressed material
- Description of inserted DNA (e.g., genetic deletions, rearrangements, or truncations occurring during transformation)
- Description of RNA expressed from inserted DNA in different tissues or at different times during plant development
- Description of protein expressed from inserted DNA in different tissues or at different times during plant development
- Inheritance and genetic stability
- Inheritance of inserted DNA
- Stability over multiple propagation cycles
Examples of Genomic Tools
The following are examples of genomic tools that can be used as profiling techniques to characterize GM plant varieties (Tzotos et al. 2009):
- Genomics to indicate which genes are active
- For example, using gene expression micro-arrays for messenger RNAs to determine if genes in a GM cultivar remain active and stable over production cycles relative to similar non-GM varieties
- Proteomics to extract the total sum of proteins from a particular cell, tissue, or organism for the purpose of determining their identity (sometimes known as expression profiling)
- For example, using two-dimensional gel-electrophoresis of proteins followed by mass spectrometry to determine proteins expressed in a GM cultivar in response to a disease like soybean cyst nematode
- Metabolomics to assess the complete set of low molecular weight compounds in a sample of a cell, tissue, or organism at a specified time and under specified environmental conditions
- For example, using high-throughput liquid chromatography in conjunction with nuclear magnetic resonance to determine nutritional differences between conventional and GM varieties
Genomic Tools to Use in Maintenance Breeding
Maintenance Breeding to Retain “Trueness-to-type” Within a Cultivar Over Time
The term “maintenance breeding” refers to all breeding activities that conserve the genetic makeup or composition of a plant variety. The concept of maintenance breeding focuses on selection for the purpose of retaining or sustaining the breeding material as “true-to-type” over successive generations. The procedures followed have the goal of maintaining the genetic purity of the line or variety as opposed to improving it with the intention of producing a new and different cultivar. The term maintenance breeding has been used in reference to breeding and selection activities practiced by farmers who maintain local traditional varieties (known as landraces), which by their nature have not been derived from commercial plant breeding (Zeven 2000, 2002). However, maintenance breeding is also used in the context of maintaining the yield potential of improved cultivars resulting from formal plant breeding activities in both the public and private sectors (Peng et al. 2010).
The goal of maintenance breeding is to achieve stability of traits expressed by that particular variety. Stability can be considered to be uniformity over time and is a requirement for varieties registered for protection under the UPOV Convention (UPOV 2010). Therefore the breeder or the institution that develops and releases the cultivar is responsible for maintenance of the variety in question. Once a variety has been registered, the breeder has an incentive to maintain the variety because lack of stability might lead to cancellation of the plant variety protection conferred by the registration (UPOV 2010).
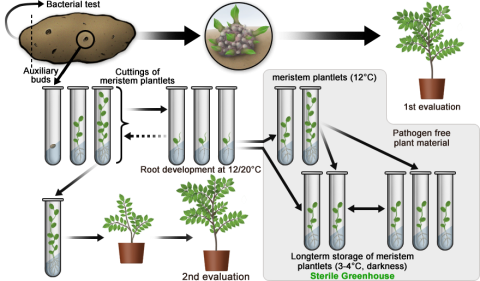
An Example of Maintenance Breeding of a Potato Variety by Use of Rapid micro-Propagation
Below is an example of applying a biotechnological method (micro-propagation) to facilitate maintenance breeding of potato.
This example describes an accelerated propagation method for multiplication of plant material of a potato cultivar by use of a so-called rapid micro-propagation system. To generate representative plant material as part of a cultivar maintenance breeding effort, the propagation starts with B clones in the 5th year of the breeding program. For each potato tuber, one bud is used to raise a single plant. From a single plant, one million clones are produced within one year! Table 3 shows the alternative pathways for rapid micro-propagation of potato that allows for a very large volume of clones to be produced in a short time and stored easily and in large volume for later use. Figure 1 depicts the alternative pathways that can greatly speed up the breeding timeline.
| Plant Material for Evaluation or Storage | Description of Steps |
|---|---|
| Pathway 1—Bud to Whole Plant for Evaluation Testing | Axillary buds from potato progated directly to grow out whole plants in greenhouse; then grown to maturity |
| Pathway 2—Bud to Meristem Plantlet to Whole Plant for Evaluation Testing | Axillary buds excised and grown as cuttings of meristem plantlets in test tube tissue culture; then grown to maturity |
| Pathway 3—Bud to Meristem Plantlet for Long-term Storage | Axillary buds excised and grown as cuttings of meristem plantlets in test tube tissue culture; then grown as pathogen-free plant and maintained in long-term storage |
Rapid Micro-Propagation
Current Global Status of Commercialized Genetically Modified Crops
According to a database hosted by the Center for Environmental Risk Assessment (CERA 2012), since 1994 regulatory approval has been granted globally for 22 genetically modified (GM) crops (see Table 5 on next slide). Regulatory approval does not necessarily mean the GM varieties are now in commercial production—some were approved but never commercialized; others have been approved and commercialized, but withdrawn from the market.
With respect to GM crops that have been commercially produced, there has been a steadily expanding number of countries since the first commercial GM crops were first released in the mid-1990s. According to the latest annual report by the International Service for the Acquisition of Agri-Biotech Applications (James 2012), in 2012 more than 17 million farmers in 28 countries—20 developing countries and 8 industrial ones—planted over 170 million hectares (420 million acres) of GM crops, which represents a nearly steady increase of 5-10% increase per year since transgenic crop varieties were first commercialized in 1996. Table 4 below shows the countries producing major GM crops commercially in 2012 [data derived from James (2012)].The top five ranked countries producing GM crops in 2012 were (in millions of hectares) the United States (69), Brazil (37), Argentina (24), Canada (12), and India (11). Globally in 2012 the number of hectares of GM crops in developing countries for the first time exceeded those in industrialized countries (52% vs. 48%).
| Rank | Country | Million ha. | Maize | Soybean | Cotton | Canola | Sugar beet | Papaya |
| 1 | USA * | 69.5 | Yes | Yes | Yes | Yes | Yes | Yes |
| 2 | Brazil | 36.6 | Yes | Yes | Yes | No | No | No |
| 3 | Argentina | 23.9 | Yes | Yes | Yes | No | No | No |
| 4 | Canada | 11.6 | Yes | Yes | No | Yes | Yes | No |
| 5 | India | 10.8 | No | No | Yes | No | No | No |
| 6 | China * | 4.0 | No | No | Yes | No | No | Yes |
| 7 | Paraguay | 3.4 | Yes | Yes | Yes | No | No | No |
| 8 | South Africa | 2.9 | Yes | Yes | Yes | No | No | No |
| 9 | Pakistan | 2.8 | No | No | Yes | No | No | No |
| 10 | Uruguay | 1.4 | Yes | Yes | No | No | No | No |
| 11 | Bolivia | 1.0 | No | Yes | No | No | No | No |
| 12 | Philippines | 0.8 | Yes | No | No | No | No | No |
| 13 | Australia | 0.7 | No | No | Yes | Yes | No | No |
| 14 | Burkina Faso | 0.3 | No | No | Yes | No | No | No |
| 15 | Myanmar | 0.3 | No | No | Yes | No | No | No |
| 16 | Mexico | 0.2 | No | Yes | Yes | No | No | No |
| 17 | Spain | 0.1 | Yes | No | No | No | No | No |
| 18 | Chile | <0.05 | Yes | Yes | Yes | No | No | No |
| 19 | Colombia | <0.05 | No | No | Yes | No | No | No |
| 20 | Honduras | <0.05 | Yes | No | No | No | No | No |
| 21 | Sudan | <0.05 | No | No | Yes | No | No | No |
| 22 | Portugal | <0.05 | Yes | No | No | No | No | No |
| 23 | Czech Republic | <0.05 | Yes | No | No | No | No | No |
| 24 | Cuba | <0.05 | Yes | No | No | No | No | No |
| 25 | Egypt | <0.05 | Yes | No | No | No | No | No |
| 26 | Costa Rica | <0.05 | No | Yes | Yes | No | No | No |
| 27 | Romania | <0.05 | Yes | No | No | No | No | No |
| 28 | Slovakia | <0.05 | Yes | No | No | No | No | No |
| * Other crops: USA (Alfalfa, Squash); China (Poplar, Torcountries producing GM cropsa and 93% of GM-cotton in India (James 2012)nding on the crop.illion acres), which representsomato, Pepper); Sweden and Germany (White Potato in 2011, but it was taken off the market in 2012) | ||||||||
| Crop | No. of events | Trait | Trait Introduction Method* | Country with Regulatory Approvals |
|---|---|---|---|---|
| Beta vulgaris –
Sugar Beet |
3 | Herbicide Tolerance | AT | Australia, Canada, China, Colombia, European Union, Japan, Mexico, New Zealand, Philippines, Russian Federation, Singapore, South Korea, USA |
| Brassica napus – Argentine Canola,
Canola, Oilseed rape, Rapeseed, Turnip |
32 | Herbicide Tolerance,
Pollination control system, Modified Product Quality |
AT, CH, MB | Australia, Canada, China, European Union, Mexico, New Zealand, USA, Japan, South Africa, South Korea, Taiwan, Chile, Philippines, Singapore |
| Brassica rapa –
Polish canola |
4 | Herbicide Tolerance | CH | Canada |
| Carica papaya –
Papaya |
4 | Disease Resistance | AT, MB | USA, Canada, Japan, China |
| Cichorium intybus – Chicory, Radicchio
Rosso |
3 | Herbicide Tolerance,
Pollination control system |
AT | USA |
| Cucumis melo –
Melon, Cantaloupe |
2 | Modified Product Quality | AT | USA |
| Cucurbita pepo –
Squash |
2 | Disease Resistance | AT | Canada, USA |
| Dianthus caryophyllus – Carnation | 19 | Modified Product Quality,
Herbicide Tolerance |
AT | Colombia, European Union, Norway, Australia, Japan, Malaysia |
| Glycine max L. –
Soybean |
31 | Herbicide Tolerance,
Modified Product Quality, Insect Resistance, Altered Growth/Yield, Abiotic Stress Tolerance |
AT, CH, MB | Australia, Brazil, Canada, Japan, Mexico, New Zealand, South Korea, Taiwan, USA, Argentina, South Africa, European Union, Philippines, Colombia, Indonesia, Singapore, China, India, Paraguay, Turkey, Uruguay, Malaysia, Russian Federation, Thailand, Bolivia, Chile, Costa Rica, Switzerland |
| Gossypium hirsutum L. – Cotton | 56 | Herbicide Tolerance,
Insect Resistance |
CH, MB, AT, PTP | South Korea, Australia, Brazil, Burkina Faso, Canada, China, Colombia, Costa Rica, European Union, India, Japan, Mexico, New Zealand, Philippines, Singapore, South Africa, Taiwan, USA, Argentina, Paraguay, Pakistan, Sudan, Myanmar |
| Lycopersicon esculentum – Tomato | 11 | Modified Product Quality,
Insect Resistance, Disease Resistance |
MB, AT | China, Canada, Mexico, USA |
| Malus x Domestica – Apple | 2 | Modified Product Quality | AT | Canada, USA |
| Medicago sativa –
Alfalfa, Lucerne |
5 | Herbicide Tolerance,
Modified Product Quality |
AT, CH | Australia, Canada, Japan, Mexico, New Zealand, Philippines, Singapore, South Korea, USA |
| Nicotiana tabacum L. – Tobacco | 2 | Herbicide Tolerance,
Modified Product Quality |
AT | USA |
| Oryza sativa L. –
Rice |
7 | Modified Product Quality,
Insect Resistance, Herbicide Tolerance |
AT, MB, rDNA | Japan, China, Iran, Colombia, USA, Australia, Canada, Honduras, Mexico, New Zealand, Philippines, Russian Federation, South Africa |
| Populus sp. –
Poplar |
2 | Insect Resistance | AT | China |
| Rosa hybrida –
Rose |
2 | Modified Product Quality | AT | Colombia, Japan, USA, Australia |
| Saccharum sp – Sugarcane | 3 | Abiotic Stress Tolerance | AT | Indonesia |
| Solanum tuberosum L. – Potato | 44 | Modified Product Quality,
Insect Resistance, Disease Resistance, Herbicide Tolerance |
AT | USA, Canada, Australia, Japan, New Zealand, Philippines, South Korea, Mexico, European Union, Argentina, Russian Federation |
| Zea mays L. –
Maize, Corn |
142 | Herbicide Tolerance,
Insect Resistance, Pollination control system, Modified Product Quality, Abiotic Stress Tolerance, Altered Growth/Yield |
CH, MB, EP, AT, CMPR, ABI, WMPT | Canada, Japan, Mexico, South Korea, Taiwan, USA, European Union, Colombia, Philippines, South Africa, Turkey, Argentina, Australia, New Zealand, Brazil, Paraguay, China, Malaysia, Russian Federation, Singapore, Indonesia, Uruguay, Honduras, Panama, Cuba, Thailand, Vietnam, Chile, Egypt, Switzerland |
* Trait introduction methods used: ABI = aerosol beam injection; AT = Agrobacterium tumefaciens; CH = conventional breeding – cross hybridization and selection; CM = chemically induced mutagenesis; CMPR = chemically mediated introduction into protoplasts and regeneration; EP = electroporation of embryos; MB = microparticle bombardment; rDNA = direct DNA transfer system; WMPT = Whiskers-mediated plant transformation
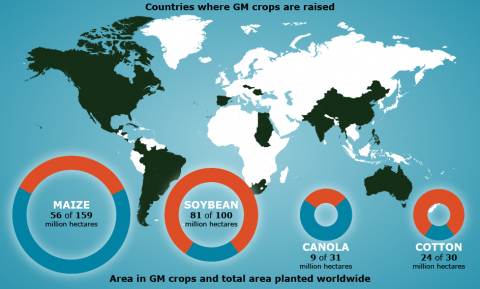
Report on Top Four GM Crops
According to the ISAAA report (James 2012), in 2012 the top four GM crops in terms of area worldwide (in millions of hectares) were soybean (81), maize (56), cotton (24), and canola (9). As shown in Table 6, percentage of area devoted to GM vs. non-GM varieties of those four crops varied globally: soybean and cotton (81% adoption of GM varieties) and maize and canola (30-35% adoption of GM varieties).
| Millions of hectares (% total area per crop) | |||
|---|---|---|---|
| Crop | Area in GM crops | Area in non-GM crops | Total area (GM + non-GM crops) |
| Soybean | 81 (81%) | 19 (19%) | 100 |
| Maize | 56 (35%) | 103 (65%) | 159 |
| Cotton | 24 (81%) | 6 (9%) | 30 |
| Canola | 9 (30%) | 22 (70%) | 31 |
On a per-country basis, in some cases adoption rates were up to 90-97%, depending on the crop and the country, e.g., 97% adoption of GM-canola in Canada and 93% of GM-cotton in India.
In terms of traits that were introduced into GM-varieties through biotechnology, a total of 59 countries—the 28 countries listed in Table 4 with commercialized GM crops plus an additional 31 countries that to date do not allow commercial production—have granted some form of regulatory approval allowing GM-crops to be either imported, used for food or feed or both (direct use or processing), or released into the environment since the first regulatory statutes of this type were approved starting in 1994.
According to James (2012), globally there have been about 2500 regulatory approvals of GM crops involving about 25 crops and 320 GM events. Herbicide tolerance continues to be the most common GM trait, but other GM traits include insect resistance, disease resistance, abiotic stress tolerance, modified product quality, and pollination control systems; in recent years so-called “stacked” traits are increasingly prevalent, e.g., GM-corn with herbicide tolerance + Coleoptera pest resistance engineered into the genome of the same plant. Worldwide, developers who have obtained regulatory approval targeting GM events in crop plants include about 45 private companies or public sector entities, either singly or in partnerships.
GM Crop Statistics
Tracking Dispersal Routes
Use Genomic Tools to Track Dispersal Routes for Admixture of Genetically Modified Crops
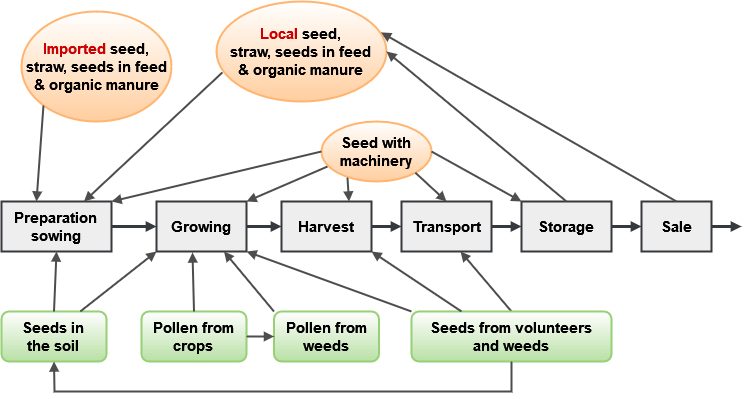
As GM crops are increasingly adopted, there is a need to monitor their potential for mixing with non-GM crops at all stages ranging from field to market since the presence of transgenes within crops marketed as non-GM conventional or organic may be either banned, against regulation, or contrary to consumer preference. Therefore an important use for genomic tools in relation to plant variety protection is as an aid in the detection of adventitious presence of products from genetic modification in places where such GM material should otherwise not be present. Contamination can occur at any stage in the crop production and marketing process—from seed production for distribution of the variety to field preparation and planting through crop growth and harvest to postharvest transport, storage and sale. In the European Union, GM and non-GM food products need to be kept separate throughout the product stream from farm to the consumers. Traceability requirements mean that tolerance levels of so-called adventitious mixing have been developed and audit trails are required (Tzotos et al. 2009).
The routes for possible contamination can be by seed in the soil or in machinery or storage containers (either directly from imported or local seed deliberately or inadvertently planted or otherwise handled). For example, seeds of certain types of crops can survive for anywhere from 5 years up to more than 20 years in the soil seed bank: parsnip, carrot, oilseed rape, sugar or fodder beet, alfalfa, and white and red clover (Tolstrup et al. 2003). Contamination can also be derived from pollen or seed from the crop itself or neighboring populations of crops or even weeds or crop wild relatives that have resulted from previous hybridization and introgression from GM crops.
Figure 3 depicts a number of both man-made and biological routes in which GM material can end up as an admixture when it should otherwise be absent. The figure is adapted from a report by Tolstrup and colleagues titled Report from the Danish Working Group on the Co-existence of Genetically Modified Crops with Conventional and Organic Crops (Tolstrup et al. 2003).
Coexistence Concept Applied to Crop Varieties In Production And Marketing Systems: Genetically Modified Vs. Conventional Vs. Organic
The term coexistence is currently being applied as a concept to describe the situation where different forms of cropping systems—in particular, production based on GM crops vs. that based on conventional, non-GM crops vs. that based on certified organic, non-GM crops—that potentially can exist side-by-side without excluding or impeding any agricultural option. Coexistence strategies are being proposed and considered nationally and regionally in Europe (Devos et al. 2009). According to one definition, coexistence is
“ … the practice of growing crops with different quality traits or intended for different markets in the same vicinity without them becoming commingled and thereby possibly compromising the economic value of both. Coexistence is based on the premise that farmers should be free to cultivate the crops of their choice using the production system they prefer, whether they are GM, conventional or organic” (CropLife 2013).
The goal of setting policy with regard to coexistence is based on an assumption that consumers should be able to maintain free choice about the production systems associated with crop products that they consume or otherwise use.
Range of Coexistence Measures
A range of on-farm coexistence measures could be adopted to ensure purity of a crop by addressing issues raised and stages of production and marketing such as those described in Figure 3. Devos and colleagues (2009) illustrate the following points where such strategies potentially must occur to ensure that coexistence would be possible:
- Seedbed Preparation and Start Material — seed purity
- Sowing — spatial isolation (isolation distances based on field characteristics or pollen barriers); temporal isolation (flowering period or crop rotation)
- Growing — cleaning of machinery; removal of bolters to prevent or limit cross-fertilization
- Harvest — cleaning of machinery; separation of machinery by providing space for maneuvering
- Post-harvest — control of volunteers; specific tillage operations; applications or herbicides or weeding
- Storage, Processing, and Transport — cleaning of storage and processing rooms; cleaning of transport vehicles
Regional or national standards have been set for purity of many crops such those shown in Table 7, which shows the threshold values for the maximum amount of adventitious GM seed allowable in seed lots of conventional, non-GM crops. The information in this table is a regional standard for the EU, and is adapted from a Commission Directive to amend the European Union Council Directive regarding conditions and requirements concerning the presence of genetically modified seed in seed lots of non-GM varieties (CEC 2002). Note that these assessments require molecular techniques for monitoring levels in seed lots with respect to the threshold values.
| Species | Maximum adventitious presence of GM seed |
|---|---|
| Oilseed Rape/canola | 0.3% |
| Maize, Beet, Seed Potato, Cotton, Tomato, Chicory | 0.5% |
| Soybean | 0.7% |
Isolation Distances
Planting and field management adhering to standards set to be in compliance with a coexistence concept would need to deal with relative isolation distance used as a method to limit gene flow from a GM crop to neighboring non-GM conventionally managed or organically managed crops. Setting isolation distance standards requires knowledge of crop reproductive systems and prior assessment of gene dispersal rates, such as are shown for three forage grasses in Table 8.
| Species | Distance | Gene dispersal | Reference |
|---|---|---|---|
| Perenial ryegrass | 182.8m | 0.95% | Griffiths, 1950 |
| 365.6m | 0.52% | ||
| Meadow fescue | 155.0m | 0.70% | Rognli, 2000 |
| Creeping bent grass | 185.0m | 0.07%
(highest single value, 0.38%) |
Christoffer, 2003 |
| 354.0m | 0.03%
(highest single value, 0.15%) |
Practical Limits of Detection
Detection limits of genomic methods need to be known (Table 9), in order to design proper testing designs.
| Plant | Size of genome (1 C value) | Detection limit | Quantification limit |
|---|---|---|---|
| Oilseed rape | 1.15 pg | 0.01% | 0.12% |
| Maize | 2.73 pg | 0.03% | 0.27% |
| Soybean | 1.14 pg | 0.01% | 0.11% |
| Wheat | 17.33 pg | 0.17% | 1.73% |
Table 10 provides information on cost estimates and time requirements for different GM detection procedures.
| Method | Duration | Price |
|---|---|---|
| ELISA | 3-5 days* | US $134 |
| Lateral flow strip test | 10 -20 min. | US $5 |
| PCR detection (screening) | 3-5 days | US $250 |
| PCR quantification | 3-5 days | US $250 |
| * Execution time (working days) for test carried out by a commercial laboratory
** Additional charge after previous detection (price stated for maize) |
||
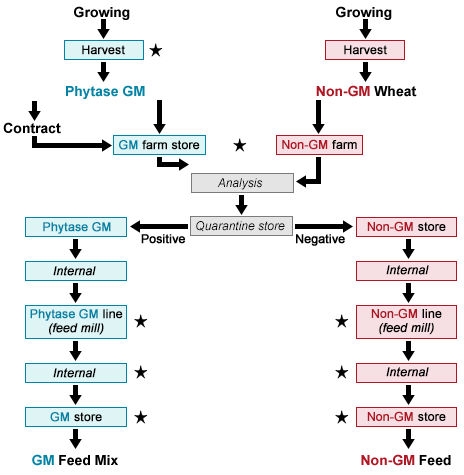
Production Chains
Production chains for particular crops that are processed post-harvest into raw material have been worked out for the purpose of
- evaluating where it might be possible to ensure separation between non-GM and GM products and
- predicting any extra handling costs that might be necessary.
Fig. 4 illustrates the production chain for so-called phytase wheat that has been genetically engineered for increased phytase activity. [Phytase is an enzyme that improves phosphorus (P) adsorption from feed in monogastric animals, so higher phytase content in feed can replace the need for P as an additive in feed and thus reduce discharge of P in livestock manure (Tolstrup et al. 2003).] In this case, the wheat is grown, and then both grain and milled products are handled through processing into a feed mix. In Fig. 4, critical steps with respect to coexistence are marked with a star symbol (★).
Additional Costs
Estimated additional costs associated with the production chain of non-GM and GM phytase wheat are shown in Table 11. Adherence to co-existence standards is estimated to be about 24% over the course of production—from field to processing to marketing.
| Affected Party/Activity | Percentage change
in costs |
|---|---|
| FARMER | |
| Seed | +1.4 |
| Control measures | +1.5 |
| Farm Production Subtotal | +2.9 |
| MERCHANT AND FOOD PROCESSOR | |
| From farm store | +6 |
| Analysis | +3 |
| GM store and non-GM store at local grain merchant | 0 |
| Transport to final destination | +11 |
| Marketing and Processing Subtotal | +20 |
| ADMINISTRATION | +4 |
| Total Including Administration | +24 |
Lawsuits for Patent Infringement
Utility patents are one alternative legal way of protecting not just plant varieties, but also plants, seeds, plant-related technologies, and methods for “… generation, identification, transfer and selection of genetic variation … [including] genetic materials (e.g., DNA, markers, genes and sequences) and methodologies (marker detection, MAS, genetic transformation and plant generation)” (Xu 2010). Patents are granted by the government to the inventor of new intellectual property that involves what is deemed a creative step. A patent is allowed by the agency granting the patent only if the claimed intellectual property is judged to be:
- Useful
- Novel, and
- Non-obvious
This section provides examples of reprints from media coverage of lawsuit settlements involve molecular techniques or plant materials protected by patents. Table 12 in the next section compares features of patents to those of other forms of intellectual property protection available for plant material.
Past Lawsuit Examples
UPOV and Its Rules for Protection of New Varieties
International Union for the Protection of New Varieties of Plants
The International Union for the Protection of New Varieties of Plants (abbreviated as UPOV, which is based on the French spelling of the name: Union Internationale pour la Protection des Obtentions Végétables) is an intergovernmental organization with headquarters in Geneva, Switzerland. The objective of UPOV is “… to provide and promote an effective system of plant variety protection with the aim of encouraging the development of new varieties of plants, for the benefit of society” (UPOV 2013). As of December 2012, there were 71 member states (countries) globally, ranging from Kyrgyzstan to Kenya to Korea and the EU.
UPOV and “Plant Breeders’ Rights”
The intent of the UPOV system is to encourage innovation in plant breeding, but notably the system is designed to be independent of any market regulation (such as regulation of production, certification, and marketing of plant varieties or importing or exporting) that may be regulated at a national, regional or other level. UPOV offers protection to the breeder of a plant variety in the form of intellectual property rights termed the “Plant breeders’ Rights”, if his or her plant variety satisfies the conditions set out in the UPOV Convention. Members of UPOV are basically obliged to grant and protect breeder’s rights, which are granted for a period of not less than 20 years from the date of grant (25 years for trees and grapevines, but 20 years for all other plants).
UPOV Rules for Variety Registration
Under the UPOV system, “breeders” are defined broadly—“a breeder might be an individual, a farmer, a researcher, a public institute, a private company etc.” (UPOV 2013). Table 0 provides a comparison between plant variety protection under terms of two major UPOV actions (UPOV 1978 Act and UPOV 1991 Act) and patent laws that are compatible with the Agreement on Trade-Related Aspects of Intellectual Property Rights (“TRIPs” or the “TRIPs Agreement“), adopted in 1994 as a treaty administered by the World Trade Organization (Helfer 2004).
According to UPOV rules, there are a set of four basic conditions that must be met for obtaining protection (UPOV 2013):
- Novelty – “the variety must be new in the sense that it must not have been sold or disposed of to others during a specified period prior to the filing of the application”
- Variety denomination – “name of the variety to be used when offering for sale, marketing, or propagating material of the variety”
- Formalities and payment of fees, and
- DUS – that is, the candidate variety must be distinct, uniform, and stable
Comparison of Principal Differences Among Patent Laws
| Breeders’ rights in UPOV 1978 Act | Breeders’ rights in UPOV 1991 Act | TRIPs-compatible patent laws | |
|---|---|---|---|
| Eligibility for protection | Plant varieties that are novel, distinctive, uniform and stable. | Plant varieties that are novel, distinctive, uniform and stable. | Plant varieties, plants, seeds and enabling technologies that are novel, involve an inventive step and are capable of industrial application. |
| Minimum exclusive rights in propagating material | Production for purposed of commercial marketing; offering for sale; marketing; repeated use for the commercial production of another variety. | Production or reproduction; conditioning for the purposes of propagation; offering for sale; selling or other marketing; exporting; importing or stocking for any of these purproses. | Making the patented product, using the patented process or using, offering for sale, selling or importing for those purposes the patented product or the product obtained by the patented process. |
| Minimum exclusive rights in harvested material | No such obligation, except for ornamental plants used for commercial propagating purposes. | Same acts as above if harvested material obtained through unauthorized use of propagating material and if breeder had no reasonable opportunity to exercise his or her right in relation to the propagating material. | Making the patented product, using the patented process or using, offering for sale, selling or importing for those purposes the patented product or the product obtained by the patented process. |
| Breeders’ exemption | Mandatory. Breeders free to use protected variety to develop a new variety. | Permissive. But breeding and exploitation of variety “essentially derived” from an earlier variety require the right holder’s authorization. | Generally not recognized, although compatibility with TRIPs not yet tested. |
| Farmer’s privilege | Implicitly allowed under the definition of minimum exclusive rights. | Permissive within reasonable limits and subject to safeguarding the legitimate interests of the right holder. | Generally not recognized, although compatibility with TRIPs not yet tested. |
| Additional exceptions to exclusive rights | None specified. | Acts done privately and for noncommercial purposes, acts done for experimental purposes. | Research and experimentation. All exemptions must comply with three-part test of TRIPs article 30. |
| Minimum term of protection | 18 years for trees and grapevines; all other plants 15 years. | 25 years for trees and grapevines; 20 years for all other plants. | 20 years from date the patent application filed. |
The Fourth Provision
The fourth provision is referred to as DUS—Distinctness + Uniformity + Stability. A plant variety shall be granted protection by UPOV if it is:
- Distinct – Article 7 of the UPOV convention says that a variety shall be considered distinct “… if it is clearly distinguishable from any other variety whose existence is a matter of common knowledge at the time of the filing of the application”
- Uniform – a variety has to be sufficiently uniform in its relevant characteristics
- Stable – a variety is stable if its relevant characteristics remain unchanged after repeated propagation, meaning that it remains “true-to-type”
When breeders have developed a new variety and want it to be registered and protected by the UPOV Convention, it must be tested by a specific set of defined DUS criteria that have been specified for each crop covered by UPOV. Before UPOV approval can occur, the breeder must submit representative seed to authorized DUS testing facilities that are the official testing facilities for each UPOV Member Country. If the variety fulfills all of the DUS criteria then the breeder will be granted the “Breeder’s Right” variety protection status by UPOV and the cultivar in question will be added to the approved national variety list maintained by UPOV member countries.
Exceptions to the UPOV Breeder’s Right
UPOV was established by Convention in 1961 and has been revised three more times to date: 1972, 1978, and 1991. The latest revision extended “Breeders’ Rights” to cover plant varieties obtained through genetic engineering as well as those derived from conventional breeding methods.
The 1991 Act of the UPOV Convention also specified a set of exceptions to the UPOV Breeder’s Right. One of these is termed a so-called “breeder’s exemption” and another is called “farmer’s privilege”. Authorization from the breeder is not necessary when using UPOV approved varieties in the following circumstances (UPOV 2013):
- breeding other varieties (compulsory)
- acts done for experimental purposes (compulsory)
- acts done privately and for non-commercial purposes (compulsory)
- farm saved seed (optional—for example, in subsistence farming systems where the crop is consumed or replanted but not sold)
According to Louwaars and colleagues (2011) the majority of developing countries that have not become members of UPOV perceive the “farmer’s privilege” clause in the 1991 UPOV Act to be too restrictive with respect to informal seed systems: under the latter rule farmers can save seed for their own use, but cannot exchange, share, or market seed to even relatives or neighbors. In some other non-member countries—in particular the USA, and also Australia and Japan—the “farmer’s privilege” clause is interpreted as inadequate protection for plant breeders. In the USA, this provides a major motivation for preferring enactment of patent systems instead (Loowaars et al. 2011).
Notice in Table 12 an important distinction between the Breeder’s Rights according to the UPOV Conventions and patent law is that the latter rules do not include any “breeders’ exemptions” or “farmers’ privileges” (Helfer 2004).
DUS Testing and the Potential for Inclusion of Genomic Tools
DUS TESTING IS A REQUIRED STEP PRIOR TO ELIGIBILITY FOR PLANT VARIETY PROTECTION UNDER UPOV.
UPOV provides guidelines and protocols for evaluating if proposed new “candidate” cultivars qualify as “distinct, uniform, and stable” (DUS) and therefore could be eligible for protection. As a requirement, each candidate variety proposed for plant variety protection under the UPOV Convention must be examined by an authorized UPOV testing agency. The DUS examination process at present involves growing the candidate cultivar in association with similar cultivars (termed reference varieties), typically for at least two seasons and assessed for a standardized set of descriptors that are usually morphological and agronomic traits and sometimes biochemical, although the use of molecular markers (in particular DNA profiling) is under discussion. UPOV test standards have been developed now for several thousand crop taxa (genera or species) that are sometimes termed “protected species”. DUS standards take into consideration the mode of reproduction. For example, outbreeding crops generally have a wider tolerance for uniformity under DUS rules than those for either inbreeding or vegetatively propagated crops (Xu 2010).
Example of DUS Testing Rules
CASE STUDIES OF OILSEED RAPE
The crop known as Winter Oilseed Rape (WOSR) is a variant of Brassica napus—also sometimes referred to as Argentine rape or rapeseed to distinguish it from other Brassica species that are also referred to as rapeseed such as Polish rape, which is B. rapa, or forms of brown mustard (B. juncea). All three of these Brassica species are sometimes called canola (the term is derived from “Can” Canadian, “O” oilseed, “L-A” low acid). WOSR is grown typically as either
- an industrial lubricant that is inedible for humans due to high level of bitter tasting glucosinolates and contains up to 50% erucic acid
- a culinary vegetable oil that has low glucosinolates and low erucic acid content; also known as “canola oil” or “rapeseed 00 oil” (00 meaning “double low”); regulated to a maximum of 5% erucic by weight in the EU and 2% in the USA
- or, more recently, as a biofuel, used either alone as biodiesel or blended with petroleum distillates
Projections for Oilseed Supplies
As of the May 2013-2014 projections for world supplies of oilseeds in million metric tons (USDA FAS 2013), globally rapeseed is the
- 2nd leading oilseed, accounting for 13% or 63 million metric tons (mmt) of the world supply, which totals 491 mmt overall (soybean is the leading oilseed at 58% of global supplies)
- 3rd leading vegetable oil, accounting for 15% or 24 mmt of the world supply, which is 166 mmt overall (palm oil is 1st at 35% of global vegetable oil supplies and soybean oil is 2nd at 27%)
- 2nd leading protein meal—a byproduct of oil extraction that is feed to livestock—accounting for 13% or 34 mmt of the world supply, which totals 278 mmt overall (soybean is the leading protein meal at 68% of global supplies)
The testing of candidate rapeseed varieties under UPOV rules must follow guidelines set in two UPOV documents, the first of which is a general set of rules applicable to testing all crop taxa and the second a set of crop-specific protocols:
- Test Guidelines TGP/1/3: General Introduction to the Examination of Distinctiveness, Uniformity and Stability and the Development of Harmonized Descriptions of New Varieties of Plants (UPOV 2002a.)
- Test Guidelines TGP/36/6 Corrected: Guidelines for the Conduct of Tests for Distinctiveness, Uniformity and Stability-Rape Seed (Brassica napus L. var. oleifera) (UPOV 2002b.)
Test Guidelines
The Test Guidelines specify a range of rules and requirements, including
- types of qualitative and quantitative characters to be assessed or measured
- guidelines for evaluation of character expression
- field trial or laboratory testing design and sampling schemes
- criteria for defining varieties and evaluating distinctiveness, uniformity, and stability
- statistical methods for analysis
- if relevant, parental formulas for assessing distinctiveness in hybrid varieties
The DUS Testing process is a requirement before PVP can be obtained under the UPOV Convention for a newly proposed plant variety in a particular country and must be carried out by an authorized national agency. In the United Kingdom, for example in DUS tests carried out during 2007-2008, 62 candidate varieties of Winter Oilseed Rape (WOSR) were examined in Year 1 and 48 in Year 2 and subsequent years; additionally a total of 493 reference varieties (so-called “common knowledge” cultivars already approved and marketed) were grown for comparison to the candidate ones (Wyatt 2008). As can be seen in Table 0, in the case of candidate WOSR varieties that are F1 hybrids, both male and female parental lines and maintainer lines must be grown in addition to the reference varieties and the candidate ones (Wyatt 2008). In the UK, DUS testing was carried out by the National Institute of Agricultural Botany (NIAB), an independent agency contracted to conduct DUS and certification mandated for seed regulation, varietal identification and varietal purity for the UK Department for the Environment, Food and Rural Affairs (Wyatt 2008).
Characteristics of Varieties
| Hybrids | Conventional O. P. Varieties |
|---|---|
| Male and female parental | Year 1 and Year 2 submissions |
| Maintainer line | Year 3 submissions |
| Reference varieties | Reference varieties |
| F1 hybrids |
The European Union commissioned a survey conducted in order to characterize features of variety testing in relation to UPOV DUS examinations (Arcadia International 2008). Table 14 provides a comparison of the WOSR DUS testing national schemes for six member countries of the European Union (Czech Republic, Denmark, France, Germany, Poland, and the United Kingdom) averaged over a series of years prior to 2008. There was a fair amount of variation in numbers of application tested per year (an average of about 50-225 applications per year), the fees collected for the DUS Testing (about US$ 100-US$ 2500), and the size of reference collections (about 135-700 reference varieties).
| Characteristics | Czech Republic | Denmark | France | Germany | Poland | United Kingdom |
|---|---|---|---|---|---|---|
| Average number of applications per year | 75 | 60 | 80 | 128 | 65 | 226 |
| Duration of the testing (years) | 2to 3 | 2 to 3 | 2 | 2 to 3 | – | 2 |
| Fees per application | US $116 | – | US $902 | US $993 | US $206 | US $2550 |
| Size of the reference collection | 543 | 520 | 700 | 423 | 137 | 650 |
Questions About Testing Sites
One important question for the EU is whether or not a single DUS Testing site could suffice for all EU countries or whether each member state in the European Union needs to maintain their own DUS testing program. Another significant concern for each country is that every time a new variety is tested, approved, and registered for UPOV protection, in theory each new variety must be added to the reference collection, thus annually increasing the size of the reference collection. One proposal is that molecular markers could be used as a management tool to help eliminate varieties that are already distant so that they could be eliminated in field trials, which would instead focus on the most similar varieties for detailed DUS evaluation. For example, a UPOV technical work group compared the results of DUS testing of winter oilseed rape in 4 EU member countries (United Kingdom, Germany, Denmark, and France) with simple sequence repeat microsatellites (SSRs) marker data (UPOV 2008).
In DUS testing of winter oilseed rape conducted in 2008 in Denmark showed that all rapeseed varieties—the new candidate varieties as well as the reference varieties—were sown out in plots of 4 meters with 4 rows and each variety was sown with 3 replications. In that trial a total of 41 characters were measured—most of them based on 20 or so measurements in 3 reps. Therefore in Denmark that year, a total of 1716 plots were sown out and approximately 3 million data points were scored! Furthermore, each new candidate variety are subjected to two years of testing before it can be eligible for granting plant breeders’ rights under the UPOV Convention. For a variety to be declared distinct it has to have one character with at least 2 Least Squares Difference (LSD) values of significance or four characters with at least 1 LSD. As you can imagine—this is a lot of work!
Table 15 on the next page summarizes the characters that must be evaluated during DUS testing of WOSR. The Test Guideline (UPOV 200b) notes that three specific traits are recommended as most helpful for grouping rapeseed varieties into major classes: Characteristic 1-Erucic acid content of the seeds, Characteristic 5-Leaf lobing, and Characteristic 11-Timing of flowering. Refer to Table 16 for an explanation of key codes corresponding to plant growth stages at which evaluation of specific characters must be made.
Characteristics Table
| Characteristic No. | Stage * | State(s) | Reference Varieties | Note |
| SEED | ||||
| 1. Erucic acid | 00 | absent present |
1 9 |
|
| COTYLEDON | ||||
| 2. Length | 15-17 | short medium long |
Briol; Akela Anka, Lisonne; Idol Astor; Anton |
3 5 7 |
| 3. Width | 15-17 | narrow medium broad |
Briol; Akela Lisonne; Doublol Astor; Falcon |
3 5 7 |
| LEAF | ||||
| 4. Green color | 23-27 | light medium dark |
Linetta; Anton Drakkar, Jaguar; Akela Logo, Orly; Gaspard |
3 5 7 |
| 5. Lobes | 23-27 | absent present |
Arista, Orly; Akela Drakkar; Falcon, Samourai |
1 9 |
| 6. No. of lobes (fully developed leaf) |
23-27 | few medium many |
Jaguar; — Drakkar; Falcon Lisonne; — |
3 5 7 |
| 7. Dentation of margin | 23-27 | weak medium strong |
Orly; Arvor Drakkar; Diadem, Tapidor Briol; Stego |
3 5 7 |
| Characteristic No. | Stage * | State(s) | Reference Varieties | Note |
| 8. Length (blade and petiole) |
23-27 | short medium long |
Polo; Hermes Lisonne; Cobra Amadeus; Barnapoli |
3 5 7 |
| 9. Length (widest point) |
23-27 | narrow medium broad |
Marinka; — Evita, Orly; Cobra –; Lirapid |
3 5 7 |
| 10. Length of petiole (varieties with lobed leaves only) |
23-27 | short medium long |
Polo; Hermes Lisonne; Ceres Amadeus; Barnapoli |
3 5 7 |
| PHENOLOGY – FLOWERING | ||||
| 11. Time of flowering | 61-62 | very early early medium late very late |
Polo, — Sponsor; Zeus Arista; Falcon Orly; Emerald Astor; Sparta |
1 3 5 7 9 |
| FLOWER | ||||
| 12. Color of petals | 62-63 | white cream yellow orange-yellow |
–; — –; Hobson Lisonne; Balcon, Samourai –; Pasha |
1 2 3 4 |
| 13. Length of petals | 62-63 | short medium long |
–; — Optima; Alfa, Ceres –; Barnapoli |
3 5 7 |
| 14. Width of petals | 62-63 | narrow medium broad |
–; Hodson Optima; Tapidor –; Alfa |
3 5 7 |
| 15. Production of pollen | 62-63 | absent present |
1 9 |
|
| WHOLE PLANT | ||||
| 16. Height (at full flowering) |
64 | low medium tall |
Nimbus; Samourai Optima; Woton Logo, Orly; Sparta, Link |
3 5 7 |
| Characteristic No. | Stage * | State(s) | Reference Varieties | Note |
| WHOLE PLANT | ||||
| 17. Total length (total length including side branches) |
75-80 | very short short medium long very long |
Polo; — Marinka; Bristol Lisonne, Rally; Diadem, Doublol Orly; Hobson Furax Nova; Stego |
1 3 5 7 9 |
| FRUIT – SILIQUE | ||||
| 18. Length (between peduncle and beak) |
75-89 | short medium long |
Nimbus; Eurol Marinka; Ceres Drakkar; Barcoli |
3 5 7 |
| 19. Length of beak | 75-89 | short medium long |
Logo, Orly; Idol Ligule, Lisonne; Ceres Drakkar; Barcoli |
3 5 7 |
| 20. Length of peduncle | 75-89 | short medium long |
–; Bristol, Eurol Derby; Ceres Drakkar; Stego |
3 5 7 |
| PHENOLOGY – INFLORESCENCE | ||||
| 21. Tendency to form inflorescences in the year of sowing for spring sown trials | absent or very weak weak medium strong very strong |
–; Falcon
–; — |
1
3 |
|
| 22. Tendency to form inflorescences in the year of sowing for late summer sown trials | absent or very weak weak medium strong very strong |
Petranova; —
Kardinal; — |
1
3 |
|
| * Refer to Table 16 below for explanation of key codes corresponding to plant growth stages | ||||
Key Codes Table
| Key | General Description | Pictorial Image of Major Stages |
|---|---|---|
| 0 | Germination |  |
| 00 | Dry Seed | |
| 10 | Seedling Growth |  |
| 11 | Appearance of cotyledons | |
| 13 | Cotyledons expanded | |
| 15 | 1 leaf-stage | |
| 17 | 2 leaf-stage | |
| 19 | 3 leaf-stage | |
| 20 | Rosette |  |
| 21 | 4 leaf-stage | |
| 23 | 5 leaf-stage | |
| 24 | 6 leaf-stage | |
| 25 | 7 leaf-stage | |
| 26 | 9-11 leaf-stage | |
| 27 | 12 or more leaves are completely developed | |
| 30 | Stem elongation |  |
| 31 | Distance between cotyledons and vegetation point ios more than 5 cm | |
| 35 | Distance between cotyledons and vegetation point ios more than 15 cm | |
| 39 | Distance between cotyledons and vegetation point ios more than 25 cm | |
| 50 | Stem elongation |  |
| 51 | Terminal bud is prsent, not raised above leaves | |
| 53 | Terminal bud is raised above the level of leaves | |
| 57 | Pedicels are elongating | |
| 59 | Buds are yellowing | |
| 60 | Flower |  |
| 61 | First open bud on terminal raceme | |
| 62 | Few buds are open on terminal raceme | |
| 64 | Full flower, lower siliques are elongating | |
| 65 | Lower siliques are starting to fill, less than 5% of buds are not yet open | |
| 67 | Seeds in lower siliques are enlarging, all buds are open | |
| 70 | Silique |  |
| 71 | Seeds in lower siliques are in full size translucent | |
| 75 | Seeds in lower siliques are green, opaque | |
| 79 | All seeds of siliques on terminal raceme are dark | |
| 80 | Maturation | 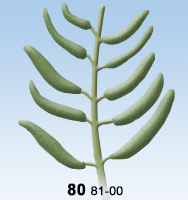 |
| 81 | Seeds in lower siliques on terminal raceme show brown areas | |
| 85 | Seeds in upper siliques show brown areas | |
| 89 | Brown siliques are brittle, stems are dry |
Non-DNA Markers With Potential For Use in DUS Testing
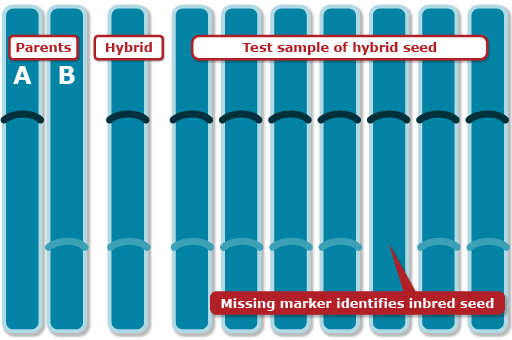
There are some non-DNA markers that can be of use in DUS Testing. One such technique used by a commercial seed testing and analysis company is a high-resolution method called iso-electric focusing (IEF), which targets isozymes but is putatively faster and more flexible for tailoring the method to specific proteins. IEF enables individual samples to be distinguished from each other.
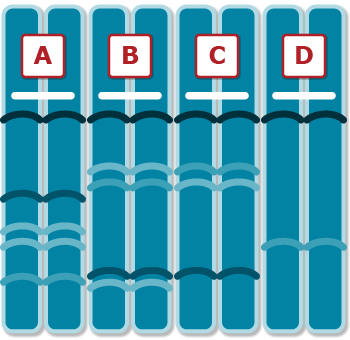
Figure 5 shows hybrids can be distinguished from their male and female parents. Figure 6 shows a gel with samples from a hypothetical set of 4 plant varieties—A, B, C, and D.
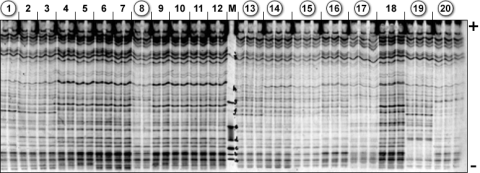
Non-DNA And DNA Markers With Potential For Use For Variety Identification Case Studies With Rice
For some crops, an IEF-based technique called ultrathin-layer isoelectric focusing (UTLIEF) used for detection of seed proteins has been shown to be “… a convenient, quick, cheap, and reliable laboratory method” that is recommended for variety verification in testing authorized by the International Seed Testing Association (Wang et al. 2001). Fig. 5 shows results from a study of 20 rice varieties from Egypt, China, the Philippines and Thailand (Wang et al. 2001). Out of 34-40 protein bands per rice variety, ten were found to be polymorphic and could be used to discriminate indica types (circled in Fig. 7) from japonica types; japonica varieties were separated into two subgroups on the basis of the UTLIEF isoelectric points.
Variety Identification Work
Wang et al. (2001) also compared the relative cost for two protein-based markers (UTLIEF and a standard isozyme method) versus SSR DNA-based markers used in maize variety purity tests (Table 17).
| Method | Cost (US$) |
|---|---|
| Ultrathin-layer isoelectric focusing (UTLIEF) of seed protein | $0.14 |
| Simple-sequence repeat (SSR) DNA markers | $0.49 |
| Isozymes of seed protein | $1.87 |
This kind of variety identification work has been extended from use of non-DNA markers to use of DNA markers, as illustrated below by studies involving rice. Sequence tagged microsatellite (STMS) markers were used by Nandakumar et al. (2004) for fingerprinting rice hybrids and parental lines (Fig. 8). A set of 4 markers differentiated 11 rice hybrids from each other and thus were suggested for use as “… referral markers for unambiguous identification and protection of these hybrids”. STMS markers were also suggested for use in maintaining genetic purity of parental lines (as discussed earlier in this lesson in the section above titled Genomic Tools to Use in Maintenance Breeding).

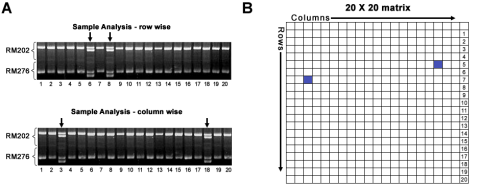
SSR Markers
This kind of work with SSR markers was extended again with rice using a 2-dimensional assay system that allowed for more accurate detection of impurities in seed lots of hybrid rice. The latter system (results for which are shown in Fig. 9) could be based on bulked samples rather than single seed assays (making the assay less expensive than the 1-dimensional assay) and identified a set of informative SSR markers that “… clearly distinguish the parental lines and amplify specific or unique allele combinations in the hybrids, not present in any other rice line” (Sundaram et al. 2008).
Biochemical and Molecular Techniques
UPOV Working Group On Biochemical And Molecular Techniques
The UPOV system—which is a very conservative system—for many years has not changed the way that the DUS trials are performed and the Plant Breeders’ Rights are granted. However during the last few years the UPOV system has encouraged the possibility of using molecular markers.
A UPOV working group serves as a focal point for this work within the UPOV system and is called the Working Group on Biochemical and Molecular Techniques. DNA-profiling is of particular interest. The BMT Working Group has focused attention on three main scenarios concerning the use of molecular markers within the UPOV system:
Option 1: Molecular characteristics as a predictor of traditional characteristics (functional markers)
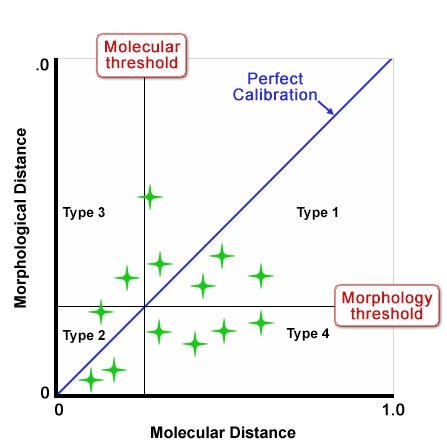
Option 2: Calibration of threshold levels for molecular characteristics against the minimum distance in traditional characteristics
Option 3: Development of a new system where a set of molecular characteristics would be used in the same way as existing non-molecular characteristics
Molecular Characteristics and Calibration
Option 1—Molecular Characteristics As Functional Markers
For Option 1, the most promising method would be to develop gene-specific markers or so-called functional markers that represent the phenotypic characters that are currently used in the DUS trials. At present, this method is not currently available for any crop on all characters, but ultimately this method would be optimal and would ensure a continuation of the current situation.
Option 2—Calibration Of Threshold Levels For Molecular Traits Against Minimum Phenotypic Distance In Traditional (Non-Molecular) Characteristics
Option 2 is concerned with the calibration of threshold levels for molecular characteristics against the minimum distances in the so-called traditional (mainly morphological) characteristics. The BMT group aims to determine which markers and how many of them should be used to get the same results as what is achieved with the DUS standard characters that are now being used.
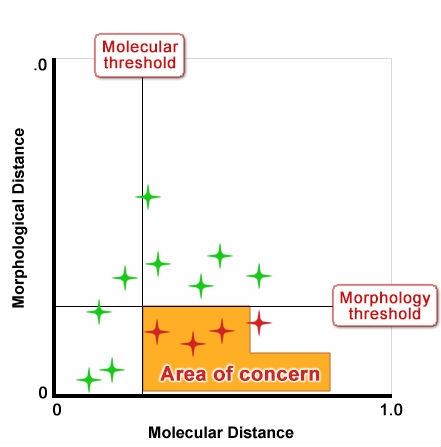
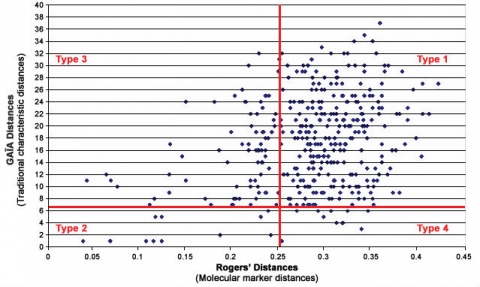
Figure 10 shows an idealized depiction of the relationship between morphological distance and molecular distance with thresholds defined for each. Type 1 and 2 outcomes have no impact on strength of protection because the result is the same for both methods; likewise Type 3 outcomes also do not impact the “distinctiveness” decision because variety differences would be discovered through assessment of traditional characteristics. But Type 4 outcomes could undermine established systems because they could result in varieties being considered more distinct using molecular techniques in cases where with non-molecular techniques, varieties were considered non-distinct. Figures 11 and 12 show a proposed way of addressing this issue by increasing the level of the molecular threshold.
Threshold Level Graphs
GAÏA Distance Method
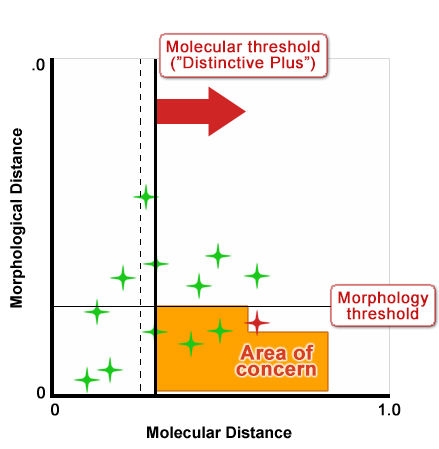
However, a study with winter oilseed rape (WOSR) reported in Button (2007) and shown in Fig. 10 found that there was poor correlation between traditional/morphological characteristics and molecular characteristics. In this study and others under discussion by the UPOV BMT Group, the distance method developed for comparing and analyzing the relative distinctiveness of varieties in DUS testing is one called the GAÏA distance method, which was developed for analyzing traditional/morphological characteristics. In contrast, in the WOSR study, the distance measure used for assessing relative distinctiveness in molecular characteristics between varieties is Rogers’ distance. However in the oilseed rape study, even if the “Distinctiveness Plus” molecular threshold level was to be increased, there were still quite a number of varieties for which the molecular characteristics revealed higher degrees of varietal distinctiveness than did the traditional DUS characteristics.
Anonymous Markers
An alternative—and probably a more realistic one—would be to use anonymous markers to manage the reference collections. This strategy was mentioned in the previous section: when a new variety is entered into a DUS trial, a predefined set of molecular markers are run on the candidate, and these data are then compared to a database that contain the reference varieties run with the same set of molecular markers. By comparison, the 25 or 50 varieties that are considered to be closest to the new variety are then picked and used to plant out in the traditional way in the field. This method would considerably reduce the workload of the DUS trial as well as ensuring a continuation of the DUS trial as the evaluation method.
Summarizing Outcomes
Option 3—Development Of New System Using Molecular Characteristics?
Option 3 focuses on the development of a completely new system where a set of molecular characteristics would be used in the same way as existing non-molecular characteristics. However, this proposal is meeting a lot of resistance within the UPOV system and will probably not be investigated further. So within the UPOV system, the first two methods—Options 1 and 2—are being currently investigated.
Summarizing Outcomes and Conclusions from Reviews Conducted to Date by the UPOV Biochemical and Molecular Techniques Working Group
Button (2007, 2011) highlights a number of issues of concern about the potential use of molecular techniques in UPOV plant variety protection, regarding legal and policy considerations as well as technical ones:
- Conformity with UPOV Convention
- Impact on strength of protection
- Reliability and robustness of techniques
- Accessibility and harmonization of methodologies (e.g., facilitation of cooperation and internationally recognized variety descriptions)
- Cost of testing
- Implications for breeders
Conclusions
The following are some of the other outcomes and conclusions that have resulted from reviews to date conducted by the UPOV BMT Working Group:
- No evidence of any statistical correlation between molecular distance and morphological distances has been found
- Approaches were developed for the construction of centralized databases of molecular marker information for “difficult” species such as winter oilseed rape, and allow these to be populated with data from different laboratories
- Option 2 as originally conceived is not applicable for the management of reference collections in winter oilseed rape
- Molecular markers could be useful as an additional characteristic, to be used in cases where distinctness is otherwise difficult to demonstrate based on non-molecular traits
- Molecular markers appear to be useful when used in combination with phenotypic characteristics, e.g, in approaches such as the GAÏA distance method, subject to agreements on suitable distance thresholds
Essentially Derived Varieties
The definition of essentially derived varieties set out in the UPOV Convention reads as follows:
By virtue of article 14 (5) (b) UPOV ‘a variety shall be deemed to be essentially derived from another variety (’the initial variety’) when
- it is predominantly derived from the initial variety, or from a variety that is itself predominantly derived from the initial variety, while retaining the expression of the essential characteristics that result from the genotype or combination of genotypes of the initial variety,(italics added by author)
- it is clearly distinguishable from the initial variety and
- except for the differences which result from the act of derivation, it conforms to the initial variety in the expression of the essential characteristics that result from the genotype or combination of genotypes of the initial variety.’
The definition as it appears in the Basic Regulation is drawn in essence from the UPOV definition, but it is not exactly the same.
A variety is classified as an EDV, when:
- it is predominantly derived from the initial variety, or from a variety that is itself predominantly derived from the initial variety;
- it is distinct in accordance with the provisions of Article 7 from the initial variety;
- and except for the differences which result from the act of derivation, it conforms essentially to the initial variety in the expression of the characteristics that results from the genotype or combination of genotypes of the initial variety.”
References
AOSCA (Association of Official Seed Certifying Agencies). 2012. AOSCA website. Available at http://www.aosca.org/.
Arcadia International. 2008. Evaluation of the Community Acquis on the Marketing of Seed and Plant Propagating Material (S&PM). Final Report for the European Commission Directorate General for Health and Consumers. Submitted by the Food Chain Evaluation Consortium (FCEC), Civic Consulting, and Arcadia International-Agra CEAS. DG SANCO: Brussels, Belgium.
Button, P. 2007. New developments in the International Union of the Protection of New Varieties of Plants (UPOV). Proceedings of 27th EUCARPIA Symposium on Improvement of Fodder Crops and Amenity Grasses. UPOV: August 19-23, 2007, Copenhagen, Denmark.
CEC (Commission of the European Communities). 2002. Commission Directive amending Council Directives 66/400/EEC, 66/401/EEC, 66/402/EEC, 66/403/EEC, 69/208/EEC, 70/458/EEC and Decision 95/232/EEC as regards additional conditions and requirements concerning the presence of genetically modified seed in seed lots of non-genetically modified varieties and the details of the information required for labeling in the case of seeds of genetically modified varieties. SANCO/1542/02July2002. Available online at http://www.gmo-safety.eu/pdf/aktuell/Seed_Directive030702.pdf.
CERA (Center for Environmental Risk Assessment). 2012. GM Crop Database. International Life Sciences Institute Research Foundation: Washington D.C. Available online at http://cera-gmc.org/index.php?action=gm_crop_database.
CropLife International. 2013. Co-existence: biotech, conventional, and organic. Available online at http://croplife.org/plant-biotechnology/stewardship-2/co-existence/.
Devos, Y., M. Demont, K. Dillen, D. Reheul, M. Kaiser, and O. Sanvido. 2009. Coexistence of genetically modified (GM) and non-GM crops in the European UnionA review. Agronomy for Sustainable Development 29(1): 11-30.
Fernandez-Cornejo, J. 2004. The seed industry in U.S. agriculture an exploration of data and information on crop seed markets, regulation, industry structure, and research and development. United States. Dept. of Agriculture. Economic Research Service: Washington, D.C.
Gilliland, T.J. 2010. Control of cultivar release and distribution. Chapter 8, pp. 175- in B. Boller, U.K. Posselt, and F. Veronesi (eds.). Fodder Crops and Amenity Grasses. Handbook of Plant Breeding, Volume 5. Springer-Verlag: New York.
Heckenberger, M., M. Bohn, M. Frisch, H.P. Maurer, and A.E. Melchinger. 2005. Identification of essentially derived varieties with molecular markers: an approach based on statistical test theory and computer simulations. Theor. Appl. Genet. 111: 598-608.
Helfer, L.R. 2004. Intellectual Property Rights in Plant Varieties International Legal Regimes and Policy Options for National Governments. FAO Legislative Study No. 85. Food and Agriculture Organization of the United Nations: Rome, Italy. 104 pp. Available at http://www.fao.org/docrep/007/y5714e/y5714e00.htm.
Howard, P.H. 2013. Seed industry structure 1996-2008. Available online at https://www.msu.edu/~howardp//seedindustry.html.
Howard, P.H. 2009. Visualizing consolidation in the global seed industry: 1996-2008. Sustainability 1: 1266-1287. Available online at http://www.mdpi.com/2071-1050/1/4/1266.
ISF (International Seed Federation). 2013a. ISF website. Available online at http://www.worldseed.org/isf/home.html.
ISF (International Seed Federation). 2013b. Rules and Usages for the Trade in Seeds for Sowing Purposes. ISF. Available online at http://cdnseed.org/wp-content/uploads/2013/01/ISF-Rules-and-Usages-for-Trade-in-Seeds-for-Sowing-Purposes-2013.pdf.
James, C. 2012. Global Status of Commercialized Biotech/GM Crops: 2012. ISAAA Brief No. 44. International Service for the Acquisition of Agri-Biotech Applications: Ithaca, NY.
Jones, H., C. Norris, J. Cockram, and D. Lee. Variety protection and Plant Breeders’ Rights in the ‘DNA era’. Chapter 18, pp. 369-402, in T. Lübberstedt and R.K. Varshney (eds.), Diagnostics in Plant Breeding. Springer: New York.
Kesan, J.P. 2007. The Statutory Toolbox: Plants. Chapter 4.4 in the online version of A. Krattiger, R.T. Mahoney, L. Nelsen, J.A. Thomson, A.B. Bennett, K. Satyanarayana, G.D. Graff, C. Fernandez, and S.P. Kowalski (eds.), Intellectual Property Management in Health and Agricultural Innovation: A Handbook of Best Practices. MIHR (Oxford, UK), PIPRA (Davis, CA, USA), Oswaldo Cruz Foundation (Brazil), and bioDevelopments-International Institute (Ithaca, NY, USA). Available online at http://www.iphandbook.org/.
Kloppenburg, J.R. 2005. First the Seed: The Political Economy of Plant Biotechnology, 2nd ed. University of Wisconsin Press: Madison WI, USA.
Lipp, M., R. Shillito, R. Giroux, F. Spiegelhalter, S. Charlton, D. Pinero, and P. Song. 2005. Polymerase chain reaction technology as analytical tool in agricultural biotechnology. Journal of AOAC International 88: 136-155.
Louwaars, N., P. Le Coent, and T. Osborn. 2011. Seed Systems and Plant Genetic Resources for Food and Agriculture. Food and Agriculture Organization of the United Nations (FAO): Rome, Italy.
Nandakumar N., A.K.Singh, R.K. Sharma, T. Mohapatra, K.V. Prabhu, and F.U. Zaman. 2004. Molecular fingerprinting of hybrids and assessment of genetic purity of hybrid seeds in rice using microsatellite markers. Euphytica 136: 257-264.
OECD (Organization for Economic Co-operation and Development) 2010. Consensus Document on Molecular Characterization of Plants Derived from Modern Biotechnology. OECD Working Group on the Harmonisation of Regulatory Oversight in Biotechnology and OECD Task Force for the Safety of Novel Foods and Feeds. ENV/JM/MONO(2010)41. OECD. Available at http://www.oecd.org/env/ehs/biotrack/46815346.pdf.
OECD (Organization for Economic Co-operation and Development) 2013. OECD Seed Schemes 2013: OECD Schemes for the Varietal Certification or the Control of Seed Moving in International Trade. OECD. Available at http://www.oecd.org/tad/code/seeds-rules-complete.pdf.
Pallotini, L., E. Garcia, J. Kami, G. Barcaccia, and P. Gepts. 2004. The genetic anatomy of a patented yellow bean. Crop. Sci. 44: 968-977.
Peng, S., J. Huange, K.G. Cassman, R.C. Laza, R.M. Visperas, and G.S. Khush. 2010. The importance of maintenance breeding: A case study of the first miracle rice variety-IR8. Field Crops Research 119: 342-347.
Querci, M., M. Van den Bulcke, J. Žel, G. Van den Eede, and H. Broll. 2010. New approaches in GMO detection. Anal Bioanal Chem 396: 1991-2002.
Sundaram, R.M., B. Naveenkumar, S.K. Biradar, S.M. Balachandran, B. Mishra, M. IlyasAhmed, B.C. Viraktamath, M. S. Ramesha, and N.P. Sarma. 2008. Identification of informative SSR markers capable of distinguishing hybrid rice parental lines and their utilization in seed purity assessment. Euphytica 163: 215-224.
Tolstrup, K., S.B. Andersen, B. Boelt, M. Buus, M. Gylling, P.B. Holm, G. Kjellsson, S. Pedersen, H. Østergård, and S.A. Mikkelsen. 2003. Report from the Danish Working Group on the co-existence of genetically modified crops with conventional and organic crops. Plant Production Report no. 94. Danish Institute of Agricultural Sciences (DIAS), Tjele, Denmark.
Tzotzos, G.T., G.P. Head, and R. Hull. 2009. Genetically Modified Plants: Assessing Safety and Managing Risk. Elsevier: New York.
UPOV (International Union for the Protection of New Varieties of Plants). 2013. UPOV website. Available at http://www.upov.int/portal/index.html.en.
UPOV (International Union for the Protection of New Varieties of Plants). 2010. Examining stability. Document TGP/11. UPOV: Geneva. Available at http://www.upov.int/edocs/mdocs/upov/en/twa/39/tgp_11_1_draft_8.pdf.
UPOV (International Union for the Protection of New Varieties of Plants). 2008. A Research Project Co-Financed by the Community Plant Variety Office of the European Community (CPVO): “Management of Winter Oilseed Rape Reference Collections”. Technical Working Party on Automation and Computer Programs. 26th session, Jeju, Korea. Document TWC/26/18. UPOV: Geneva. Available at http://www.upov.int/edocs/mdocs/upov/en/twc/26/twc_26_18.pdf.
UPOV (International Union for the Protection of New Varieties of Plants). 2002a. General Introduction to the Examination of Distinctiveness, Uniformity and Stability and the Development of Harmonized Descriptions of New Varieties of Plants. Document TGP/1/3. UPOV: Geneva. Available at http://www.upov.int/export/sites/upov/publications/en/tg_rom/pdf/tg_1_3.pdf.
UPOV (Internactional Union for the Protection of New Varieties of Plants). 2002b. Guidelines for the Conduct of Tests for Distinctiveness, Uniformity and Stability-Rape Seed (Brassica napus L. oleifera. Document TGP/36/6 Corrected (1996, 2002). UPOV: Geneva. Available at http://www.upov.int/edocs/tgdocs/en/tg036.pdf.
UPOV (Internactional Union for the Protection of New Varieties of Plants). 1991 International convention for the protection of new varieties of plants. Available at http://www.upov.int/upovlex/en/conventions/1991/act1991.html.
UPOV (International Union for the Protection of New Varieties of Plants). 1978. International convention for the protection of new varieties of plants. Available at http://www.upov.int/en/publications/conventions/1978/act1978.htm.
USDA (United States Department of Agriculture) Foreign Agricultural Service. 2013. Oilseeds: World Markets and Trade. Circular Series FOP 045-13. May 2013. Available at http://usda.mannlib.cornell.edu/usda/fas/oilseed-trade//2010s/2013/oilseed-trade-05-10-2013.pdf.
Wang, X.F., R. Knoblaunch, and N. Leist. 2001. Identification of varieties and testing of hybrid purity of rice by ultrathin-layer isoelectric focusing of seed protein. International Rice Research Notes (IRRN) 26 (1): 18-19.
Wyatt, J. 2008. Cereal and winter oilseed rape testing within the UK.
Xu, Yunbi. 2010. Intellectural property rights and plant variety protection. Chapter 13, pp. 512-549, in Molecular Plant Breeding. CAB International. Cambridge, MA.
Zeven, A.C. 2002. Traditional maintenance breeding of landraces. 2. Practical and theoretical considerations of maintenance of variation of landraces by farmers and gardeners. Euphytica 123: 147-158.
Zeven, A.C. 2000. Traditional maintenance breeding of landraces. 1. Data by crop. Euphytica 116: 6585.
