
Chapter 9: Marker Based Management of Plant Genetic Resources
Thomas Lübberstedt and Walter Suza
The state of the world’s plant genetic resources (PGR) for food and agriculture is continuously being monitored. PGR include the reproductively or vegetatively propagated material of (a) adapted and new cultivars, (b) outdated cultivars, (c) traditional cultivars and landraces, and (d) wild relatives of cultivated species. Advances in the field of molecular genetics have helped provide genetic information that can be used to increase the effectiveness of managing plant genetic resources (Karp et al., 1997).
- Understand the different processes involved in conservation and exploitation of plant genetic resources
- Understand the application of genomic tools, in particular DNA markers, for taxonomic classification, acquisition of genetic resources, their maintenance, characterization, and utilization
Marker Application
Molecular markers can be applied to various activities throughout the breeding process (Table 1). The focus of this lesson will be on the application of markers in the management of plant genetic resources.
| Basic steps in plant breeding | Tasks that can be addressed with molecular markers |
| Genetic resources | Biodiversity monitoring; Registration and maintenance |
| Phase I: Production of genetic variation | Selection of complementing parents; Targeted gene introgression; Controlled recurrent selections |
| Phase II: Development of variety parents | Evaluation of genetic potential; Pyramidization (stacking); Prediction of best hybrids |
| Phase III: Testing of experimental varieties | Reducing testing costs |
| Registration | Variety protection (UPOV); Parenting |
Conserving and Mining Plant Genetic Resources (PGR)
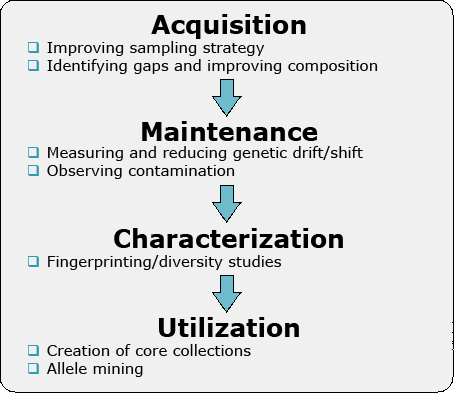
Figure 1 illustrates the key issues in PGR that can be addressed with molecular markers.
Acquisition
Markers are useful in addressing the distribution of genetic diversity among populations and help demarcate regions for sampling. The data could also be used to design a collection plan or protocols for exchange of genetic resources. Importantly, information about genetic variation within a region can help a breeder to decide, where and how to sample for useful agronomic traits.
Maintenance
For cross-pollinated species, pollen migration may result in contamination. Also, there may be duplication in an accession within the germplasm collection. Any genetic resources need to be renewed in certain intervals, due to decreasing seed viability over time. During this process, inadvertent selection or genetic drift might occur. Thus, markers can be used to monitor changes in genetic structure as materials are generated.
Characterization
Molecular markers are used to fingerprint genetic resources and can be used to complement phenotypic evaluations to provide more accurate information. Fingerprinting information, possibly based on next generation sequencing methods, is useful to identify genetic resources that most likely help broadening genetic variation in elite germplasm.
Utilization
Germplasm utilization depends on determination of value of a particular accession, gene or allele conferring a desirable trait. If a rare allele increases performance of a trait of interest, finding an accession with such a trait may be very difficult to achieve by phenotypic approaches. If, on the other hand, a marker closely linked to the target allele is available, the marker can be used as a diagnostic tool for rare allele selection and trait improvement.
Taxonomic Classification
DNA Barcoding
DNA barcoding is a technique for characterizing species using short DNA sequence from a standardized and agreed-upon region within a genome. The barcode of life data system (BOLD) supports the generation and application of DNA barcode data for many unicellular and multicellular organisms, including plants, fungi, and animals. Also, numerous publications on barcoding research are also available the database. Barcoding in animals has depended largely on a standardized sequence of a gene called CO1 (cytochrome oxidase 1) that is encoded by the mitochondrial genome. The underlying idea is, to use a minimum of sequence information that is necessary to discriminate animal species. CO1 evolution turned out to reflect well animal speciation.
Botanical Barcoding
Use of CO1 as a barcode did not work well for plants. Thus, alternative sequences in the plastid genome were used in this context. The search for a new plant barcode resulted in a standard two-locus plant barcode that allows most species to be distinguished (Hollingworth et al., 2009). However many challenges remain with application of DNA barcoding in plants. One of these challenges is lack of plastid sequence divergence in certain species. Another is hybridization and polyploidization in plants. In the vast majority of flowering plants the plastid genome is maternally-inherited, but in some gymnosperms, the plastid comes from the male parent. Once a hybrid is produced, successive backcrossing can result in enriched purity of the recurrent parent nuclear genome, but also enrichment of the donor plastid genome. With respect to polyploids, differences in the plastid genome may amplify early following polyploidization, thus, barcoding may fail to distinguish between diploid and polyploid lineages.
Acquisition and Collection of Materials
Phylogenetic Analysis
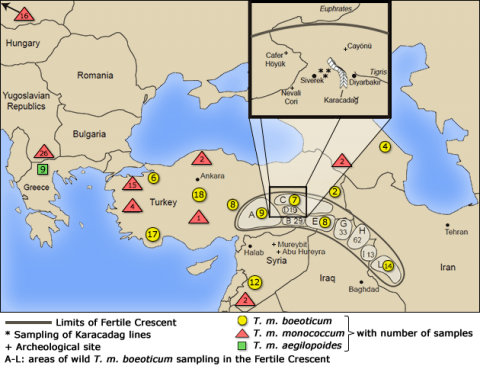
Phylogenetic analysis using DNA markers in combination with archeological excavations allowed the discovery of a wheat domestication site (Fig. 2).
Relationship Graph
Maintenance of Genetic Integrity of Genetic Resources
Core Collections
Download the “Major germplasm collections by crop and institute” to access a list of germplasm accessions of major crops stored in different institutes around the globe.
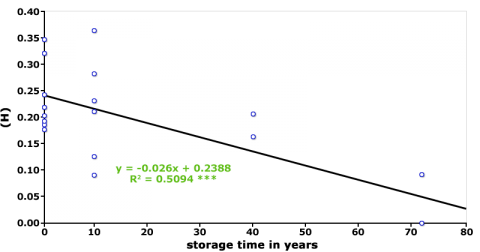
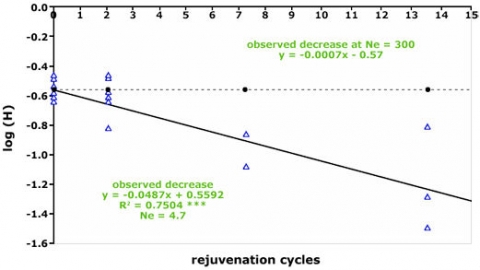
Maintenance of these collections involves frequent rejuvenation cycles to ensure the viability of the seeds. However, sample multiplication can result in loss of genetic diversity (Fig. 3 and 4), and changes in the frequency of desirable alleles (Parzies et al., 2000). One explanation for loss of genetic diversity is that genetic drift occurs during rejuvenation of the accessions (Parzies et al., 2000).
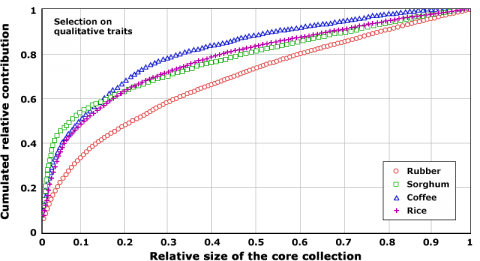
Size of Core Collection
One of the main challenges that a PGR curator faces is the need to optimize availability of their collection, while dealing with very large numbers of accessions. For example, the collection of maize genetic resources at the Plant Introduction station in Ames, Iowa, houses ca. 21,000 accessions. Use of markers can help establish sampling methodologies that are optimized to enhance utilization of genetic resources. Such methodologies have revealed that useful traits can be discovered with fewer accessions (Fig. 5), thus, providing guidelines for cost-effective management of PGR. The underlying idea is that there is substantial redundancy among accessions with regard to haplotypes or alleles. Thus, it should be possible to capture the majority of this allelic variation within a species in fewer accessions. Both qualitative traits, but given decreasing costs, increasingly markers can help to identify a subset or “core collection” of accessions, which contain a specified set of genetic variation within a species. For example, 20% of the accessions in a rice gene bank contributed to 60% of qualitative trait variation (Fig. 5).
Resynthesis of Allopolyploids
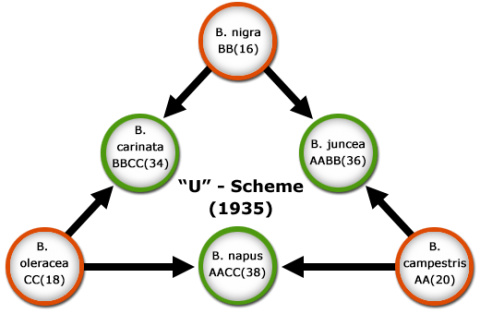
Ploidy refers to the number of chromosome sets in a cell. Polyploidy is a general term indicating multiple sets of chromosomes. Allopolyploids are individuals having two or more genomes from different parental species (Fig 6). The process of creating three cultivated Brassica species by hybridization and allopolyploidization (Fig 6) is referred to as the “U-scheme”, a term derived after its developer, Nahagaru U. The scheme can be confirmed by molecular markers, for example, the composition of the enzyme RUBISCO (Robbins and Vaughn, 1983) and the structure of the gene from which the enzyme is encoded (Palmer et al., 1983). As spontaneous allopolyploidization is usually a rare event, the genetic diversity in alloploid species can be limited. Knowledge about the origin of genomes in allopolyploids can be used, to recreate (resynthesize) allopolyploids artificially, by combining diploid species, e.g., by protoplast fusion. Resynthesis can thus be a valuable approach to broaden genetic variability in cultivated allopolyploid species.
Exploitation of Secondary and Tertiary Gene Pools
Exploitation of Biodiversity
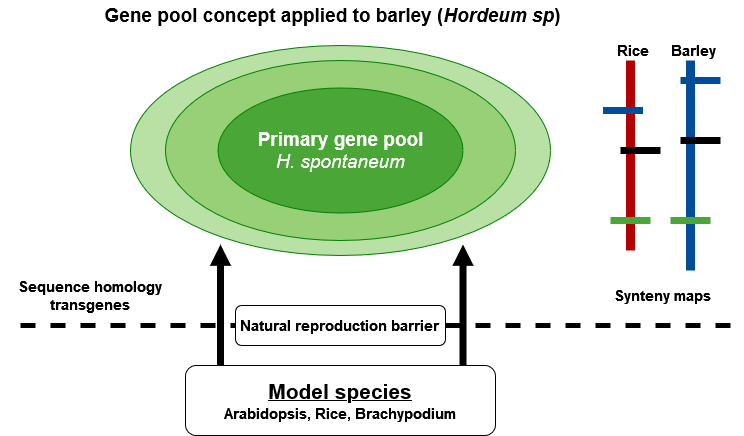
Barley (Hordeum vulgare) is an example of a multi-purpose agronomic crop with several applications including malting, food, and feed. Based on molecular and cytogenetic analyses, and ease of interspecific hybridization, Zhang et al., (2001) proposed three gene pools for the genus Hordeum (Fig. 7). The primary gene pool contains H. vulgare ssp vulgare and H. vulgare spp. spontaneum. The secondary gene pool is made up of H. bulbosum, and the tertiary gene pool includes mostly the wild relatives of barley. Each gene pool may be a source of useful agronomic and quality traits due to compatibility and full interfertility among species in the genus Hordeum. Modern varieties of barley are potentially lacking genes of interest, e.g., providing resistance to particular forms of disease and environmental stress. Thus, genetic diversity studies in barley and its wild relatives are essential for barley breeding and the conservation of the Hordeum gene pools as potential sources of valuable genes lacking in elite germplasm. Such diversity studies have found molecular markers useful in generating information about the amount of genetic variation and relationships in barley germplasm (Struss and Plieske, 1998).
Exploitation of Secondary and Tertiary Genetic Resources
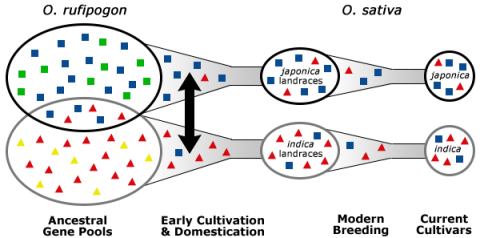
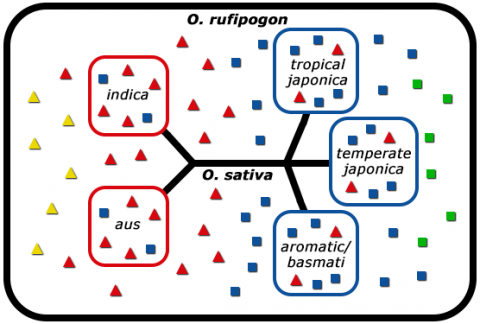
In the process of domestication, humans selected for key traits, for example, reduced grain shattering, and reduced grain dormancy in rice (Kovach and McCouch, 2008). As a consequence of domestication, genetic bottlenecks were created. A genetic bottleneck is created when many undesirable and potentially desirable alleles from the primary gene pool are left out due to preferential propagation of individuals possessing a particular trait, such as reduced shattering. The consequence of genetic bottlenecks is the narrowing of gene pools (Fig. 8).
Molecular Analysis
Molecular analysis using DNA and isozyme markers allowed differentiation of indica and japonica rice into five distinct subpopulations (Fig. 9).
To make use of the vast natural diversity left out during early domestication of rice, rice breeders make crosses between high-yielding elite cultivars and low-yielding wild accessions to obtain superior offspring (Kovach and McCouch, 2008).
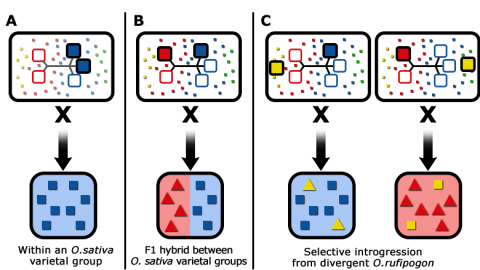
Rice Breeding Options
Various rice breeding options are presented in Fig. 10.
Identification of Novel Genes and Alleles
Molecular Characterization
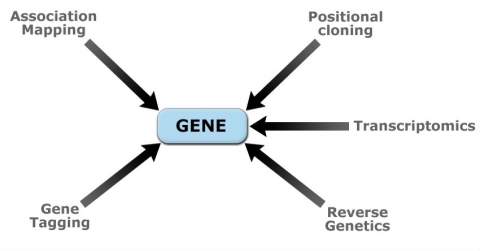
Recent developments in molecular genetics and biotechnology have allowed molecular characterization of quantitative loci (QTL) controlling important crop traits. Molecular dissection of QTL is done using various genomics approaches (Fig. 11). Table 2 contains examples of genes that were identified from cloned plant QTL.
Utilization of Genetic Resources
Resistance to potato late blight
Potato late blight is a destructive disease of potato, causing billion-dollar losses annually. The disease was responsible for the infamous “Irish potato famine” in the mid-19th century. Potato late blight is caused by a fungus (Phytophthora infestans) that has become resistant to fungicides. For a long time, breeders focused on introduction of single resistance genes from wild relatives of potato into adaptable potato cultivars. However, such resistance was easily broken by P. infestans in the field, making it imperative to identify additional novel resistance genes to provide durable resistance. Although a major QTL conferring field resistance to late blight exists, it is difficult to move into adapted cultivars by conventional breeding. Several resistance genes reside on this major QTL for resistance, including a gene called R1. In 2002, Ballvora and co-workers isolated the R1 gene (Ballvora et al., 2002), and introduced it into a susceptible cultivar by a transgenic approach resulting in resistance to late blight.
Late blight also causes loss of production in tomato. Intriguingly, the transfer of the potato R1 gene to tomato also resulted in resistance to P. infestans (Faino et al. 2010). This underscores the importance of molecular tools in searching for novel genes and alleles that can be used to improve important traits within and across species.
| Species | Trait | QTL | Gene |
| Arabidopsis | Flowering time Gluc. structrue Root morphology |
ED1 FLW GS-elong BRX |
CRY2 FLM MAM BRX |
| Maize | Plant architecture | Tb1 | Tb1 |
| Rice | Heading time Heading time Heading time Heading time |
Hd1 Hd3a Hd6 Ehd1 |
Se1 Hd3a aCK2 Ehd1 |
| Tomato | Fruit sugar content Fruit shape Fruit weight |
Brix9-2-5 Ovate fw2.2 |
Lin5 Ovate ORFX |
Testing Identity of Conal Species During Multiplication Process
Grapevine
Grapevine (Vitis vinifera) is cultivated in various parts of the world, and to ensure quality, proper identity of clones is required. Use of molecular markers helped identify genetic diversity among ‘Cabernet Sauvignon’ clones originating from either France or Chile (Fig. 12).

Oil Palm
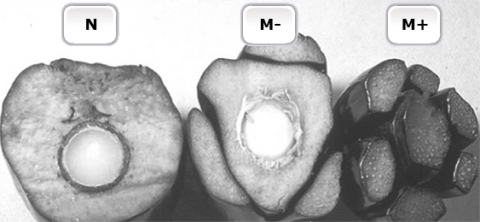
Oil palm (Elaeis guineensis Jacq.) is an important oil crop. But, the selection process to identify superior individuals from conventional hybrid breeding may take more than 10 years. To shorten the time to produce uniform planting materials, clonal plants are produced by micropropagation. However, the production of oil palm clones by tissue culture is negated by the occurrence of somaclonal mutants (Fig. 13) that display floral abnormalities (Jaligot et al., 2000).
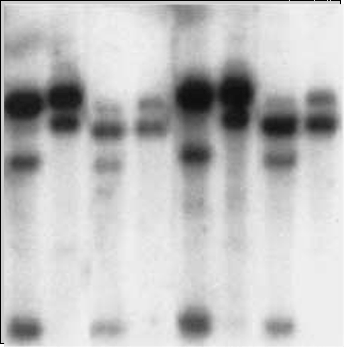
Somaclonal Mutations
Somaclonal mutations are associated with epigenetic changes involving abnormal distribution of DNA methylation. Therefore, methylation-sensitive restriction fragment length polymorphism (RFLP) markers can be used to monitor the methylation status of clones (Fig. 14) to help screen somaclones immediately after the tissue culture stage. Southern blot analysis of RFLP products from MspI and HpaII restriction enzymes revealed differences in banding pattern for products from MspI digestions (Fig. 14). Recall that, MspI can digest methylated DNA, and HpaII only cleaves unmethylated DNA. Thus, results in Fig. 14 suggest that DNA from fast-growing calli is hypomethylated, which contributes to aberrant tissue development.
Miscanthus
Miscanthus is an important biomass crop that is clonally propagated. To prevent inaccurate cultivar naming of clones, molecular analysis is used to cluster identical cultivars together (Fig. 15). Also, molecular data can help assign new identity to clones that have been improperly labeled (Table 3).
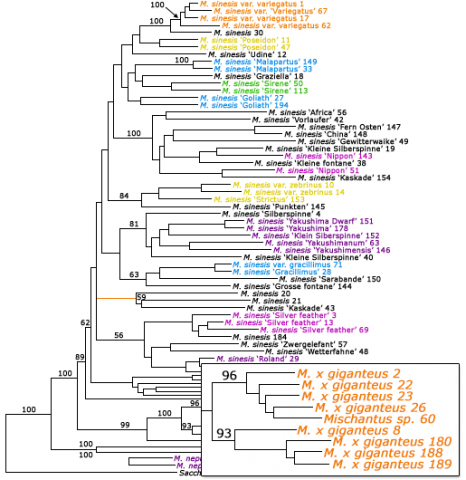
Assigning Identity
| ID | Previous identity | New identity based on AFLP data |
| 8 | M. sacchariflorus | M. x giganteus |
| 20 | Miscanthus sp. | M. sinensis |
| 23 | M. sacchariflorus | M. x giganteus |
| 26 | M. sinensis ‘Giganteus’ | M. x giganteus |
| 60 | Miscanthus sp. | M. x giganteus |
| 61 | M. pururascens | M. sacchariflorus |
| 64 | M. chinensis | M. sinensis |
| 148 | Miscanthus sp. ‘China’ | M. sinensis ‘China’ |
| 150 | Miscanthus sp. ‘Sarabande’ | M. sinensis ‘Sarabande’ |
| 161 | M. tinctorius ‘Nanus Variegatus’ | M. oligotachyus ‘Nanus Variegatus’ |
| 180 | M. sinensis ‘Giganteus’ | M. x giganteus |
| 194 | M. x giganteus ‘Goliath’ | M. sinensis ‘Goliath’ |
References
Ballvora, A., M. R. Ercolano, J. Weiß, et al. 2002. The R1 gene for potato resistance to late blight (Phytophthora infestans) belongs to the leucine zipper/NBS/LRR class of plant resistance genes. Plant J. 30: 361-371.
CBOL Plant Working Group. 2009. A DNA barcode for land plants. Proc. Natl. Acad. Sci. USA 106: 12794-12797.
Cowan, R. S., and M. F. Fay. Challenges in the DNA barcoding of plant material. In N. J. Sucher et al. (eds.), Plant DNA fingerprinting and barcoding: Methods and protocols, methods in molecular biology, vol. 862, Springer.
Faino, L., P. Carli., A. Testa, et al. 2010. Potato R1 resistance gene confers resistance against Phytophthoral infestans in transgenic tomato plants. Eur. J. Plant Pathol. 128: 233-241.
Gepts, P. 2006. Plant genetic resources conservation and utilization: the accomplishments and the future of a societal insurance policy. Crop Sci. 46: 2278-2292.
Hamon, S., S. Dussert, M. Deu, et al. 1998. Effects of quantitative and qualitative principal component score strategies on the structure of coffee, rubber tree, rice and sorghum core collections. Genet. Sel. Evol. 30: S237-S258.
Heun, M., R. Schäfer-Pregl, D. Klawan, et al. 1997. Site of Einkorn wheat domestication identified by DNA fingerprinting. Science 278: 1312-1314.
Hodgkinson, T. R., M. W. Chase, and S. A. Renvoize. 2002. Characterization of a genetic resource collection for Miscanthus (Saccharinae, Andropogoneae, Poaceae) using AFLP and ISSR PCR. Ann. Bot. 89: 627-635.
Jaligot, E., A. Rival, T. Beulé, et al. 2000. Somaclonal variation in oil palm (Elaeis guineensis Jacq.): the DNA methylation hypothesis. Theor. Appl. Genet. 19: 684-690.
Jaligot, E., T. Beulé, and A. Rival. 2002. Methylation-sensitive RFLPs: characterisation of two oil palm markers showing somaclonal variation-associated polymorphism. Theor. Appl. Genet. 104: 1263-1269.
Karp, A., S. Kresovich, K. V. Bhat, W. G. Ayad, and T. Hodgkin. 1997. Molecular Tools in plant genetic resources conservation: a guide to the technologies. IPGRI Technical Bulletin No. 2. International Plant Genetic Resources Institute, Rome, Italy.
Kovach, M. J., and S. R. McCouch. 2008. Leveraging natural diversity: back through the bottleneck. Curr. Opin. Plant Biol. 11: 193-200.
Moncada, X., F. Pelsy, D. Merdinoglu, and P. Hinrichsen. 2006. Genetic diversity and geographical dispersal in grapevine clones revealed by microsatellite markers. Genome 49: 1459-1472.
Mutert, E., and T. H. Fairhurst. 1999. Oil palm clones: Productivity enhancement for the future. Better Crops International 13: 45-47.
Palmer, J. D., C. R. Shields, D. B. Cohen, et al. 1983. Chloroplast DNA evolution and the origin of amphidiploid Brassica. Theor. Appl. Genet. 65: 181-189.
Parzies, H.K., W. Spoor, and R.A. Ennos. 2000. Genetic diversity of barley landrace accessions (Hordeum vulgare ssp. vulgare) conserved for different lengths of time in ex situ gene banks. Heredity 84:476-486.
Robbins, M. P., and J. G. Vaughn. 1983. Rubisco in the Brassicaceae, In U. Jensen, D. E., Fairbrothers, eds, proteins and nucleic acids in plant systematics. Springer-Verlag, Berlin, pp 191-204.
Salvi, S., and R. Tuberosa. 2005. To clone or not to clone plant QTLs: present and future challenges. Trend Plant Sci. 10: 297-304.
Struss, D., and J. Plieske. 1998. The use of microsatellite markers for detection of genetic diversity in barley populations. Theor. Appl. Genet. 97: 308-315.
