
Chapter 11: Modern Tools for Line Development and Predicting Hybrid Performance
Thomas Lübberstedt and Walter Suza
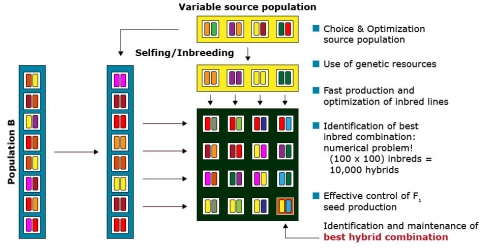
Several steps are involved in hybrid seed production, including the creation of genetic variability, the production of inbred lines by continuous selfing for several generations, testing lines for their combining ability, and crossing the best inbred lines to create hybrids. There are two drawbacks facing the selection of the promising line combinations. Selecting the best breeding population is similar to the above-mentioned usefulness problem in line breeding programs. The majority of the base populations are usually discarded after preliminary evaluation for per se and performance in an “early testing” program. As inbred lines are typically produced in two opposite heterotic groups, the main challenge in hybrid breeding ultimately is, to identify the best inbred line combination among those two heterotic groups. The presence of 100 inbred lines in each of two heterotic groups would potentially enable the production of 10,000 hybrids. Thus, the prediction of hybrid performance and heterosis without having to assess thousands of single-cross hybrids in field trials would reduce the time and efforts required to identify promising inbred combinations substantially.
Learning Objectives
- Understand breeding schemes for line development
- Familiarize with the doubled haploid technology
- Understand marker applications for heterotic pool formation and assignment
- Familiarize with application of genomic tools to understand the nature of heterosis
- Familiarizes with genomic tools for predicting hybrid performance
Breeding Schemes for Line Development
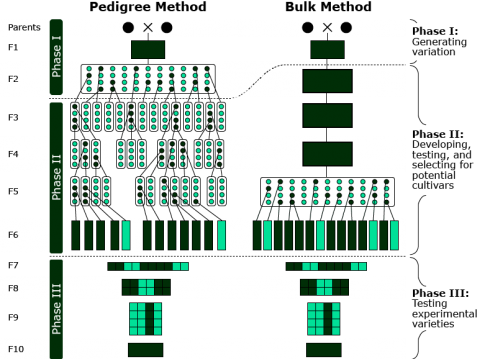
There are two main methods by which lines are developed: pedigree method and bulk method. Both methods start with the generation of genetic variation by the hybridization of two parents (Phase I).
Doubled Haploids
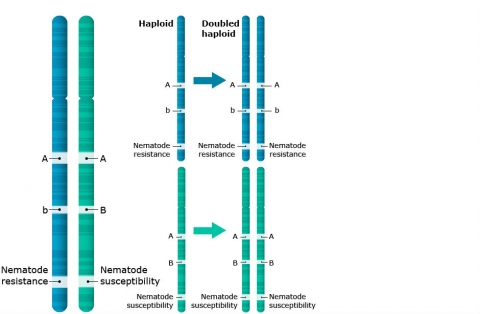
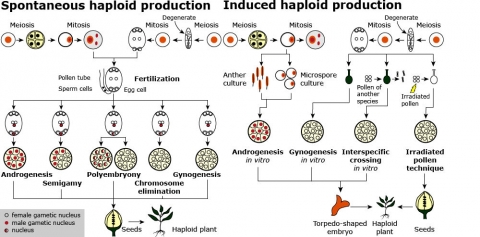
Definition: A doubled haploid (DH) cell contains the doubled chromosome number of the haploid and two identical gene sets (Fig. 4). As illustrated in Fig. 5, haploids can be induced either spontaneously or by various in vitro methods using female or male gametes. The methods of haploid induction are described below.
Methods of Producing Haploid Plants
An extensive discussion of the development of haploids and doubled haploids in plant breeding was recently published (Murovec and Bohanec, 2012), and Fig. 5 illustrates various methods for plant haploid production.
Androgenesis is defined as male parthenogenesis in which the embryo contains only paternal chromosomes owing to the failure of the egg nucleus to participate in fertilization or the regeneration of whole plants from sexual male cell culture: anthers or isolated immature pollen, at extremely low frequencies. Gynogenesis refers to spontaneous or induced female parthenogenesis in which the embryo contains only maternal chromosomes owing to the failure of the sperm cell to fuse with the egg nucleus.
Interspecific crossing is used to develop a haploid embryo by fertilizing an ovule with pollen of another species and the subsequent elimination of the chromosomes of the pollen.
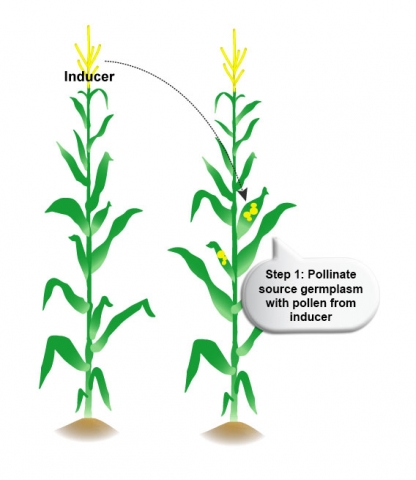
Use of Inducers (Step 1)
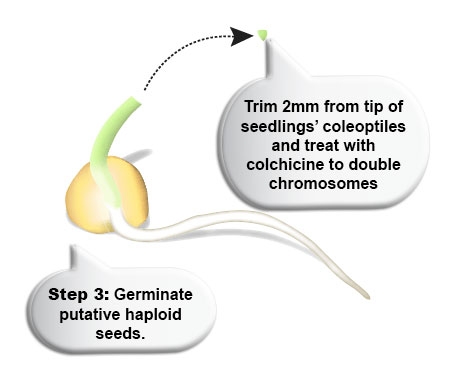
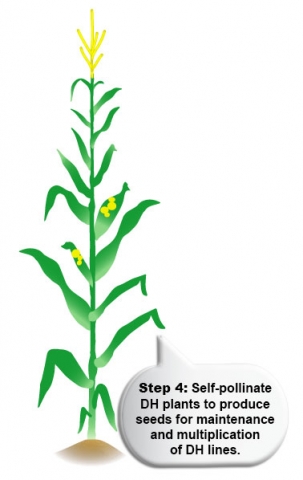
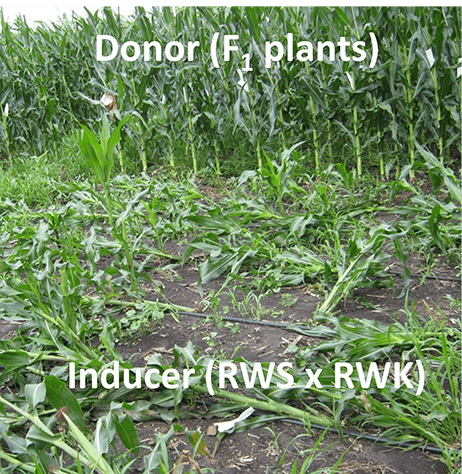
The in vivo haploid induction can result in either paternal or maternal haploidy. For maternal haploid induction, the target germplasm is pollinated with pollen from a haploid inducer genotype. For paternal haploidy, specific inducer genotypes are used as the female parent. An example of haploid induction in maize is illustrated in Fig. 6.
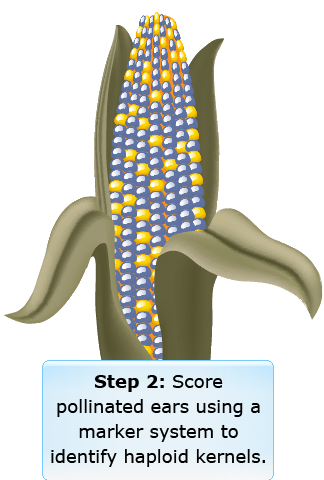
Use of Inducers (Step 2)
Use of Inducers (Steps 3 and 4)
Inducer Effects
Use of inducers
- Pollination with irradiated pollen may be used to develop a haploid embryo by fertilizing an ovule with irradiated (inactive) pollen that nevertheless is capable of introducing cellular divisions in the ovule and in the development of the embryo.
- Semigamy refers to an abnormal type of fertilization whereby either reduced or unreduced male and female gametes participate in embryo formation but fertilization does not occur.
- Polyembryony is the production of two or more embryos in one seed, owing either to the existence and fertilization of more than one embryonic sac or to the origination of embryos outside of the embryonic sac.
Application of DH Technology
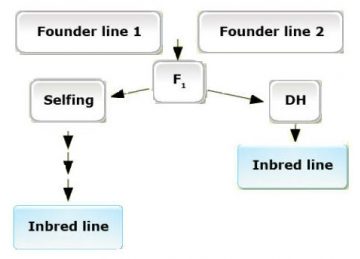
DH lines are usually produced from F1 or F2 plants. DH lines are comparable to lines obtained by the bulk method (Fig. 3), only in shorter time. DH technology allows development of completely homozygous plants, from which breeding lines or cultivars are derived, within two generations.
To identify best genotypes, breeders perform a multi-stage selection by first testing many genotypes with low precision/efforts and subsequently testing fewer and fewer genotypes with high precision and effort (with respect to locations, replications, etc.).
The advantages of DH technology are:
- Rapid generation of homozygous genotypes (Fig. 8)
- No masking of undesirable genes in the heterozygotes
- Maximum genetic variance from the first generation
- Perfect compliance with DUS criteria
- Short time to market
- Simplified logistics
- Reduced expenses for selfing and maintenance breeding
Phenotypic Markers
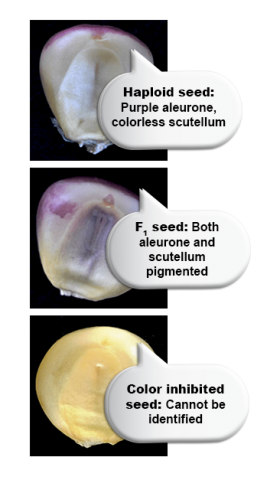
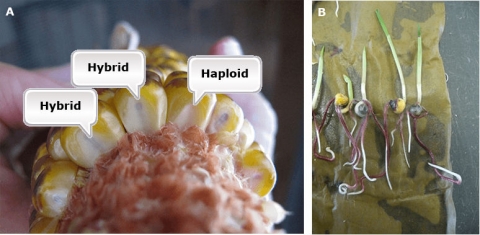
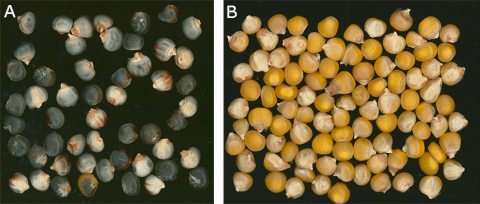
The key is to have an early expressed marker, which enables discrimination of seed with a haploid versus diploid embryos. Only kernels with a haploid embryo are useful for DH line production. The R1-nj marker provides easy and fast visual assessment of DH and hybrid grain (Fig. 8A). Also, other dominant color marker genes expressed in other organs can be used, for example, the PI1 gene that is expressed in primary roots (Fig. 8B).
Metabolite Markers
Near infrared reflectance spectroscopy (NIRS) enables both early and automated discrimination of kernels with haploid versus diploid embryos. Thus, 10,000s of kernels can be sorted with minimal human interference.
Doubled Haploids and Gene Pyramiding
DNA-Based Markers
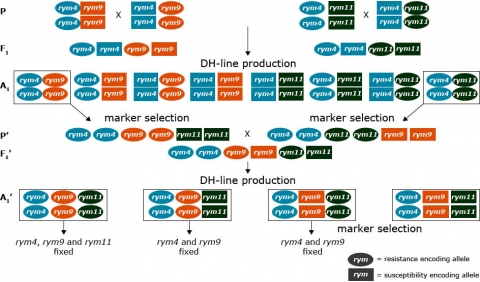
DNA markers are useful in gene pyramiding schemes for resistance when phenotypic selection cannot be achieved due to lack of differentiating pathogen strains, for example, Barley Yellow Mosaic Virus (Werner et al., 2005). In such gene pyramiding schemes, DH techniques are valuable because the frequency of homozygous recessive genotypes is higher in DH populations than in segregating F2 populations.
Application Example
Challenges in Application
Like any other technology, the DH technology has its own strengths and weaknesses. The strengths and weaknesses of DH technology as applied to maize breeding are summarized in Table 1 below.
| Approach | Strengths | Weaknesses |
|---|---|---|
| In vitro |
|
|
| In vivo — paternal |
|
|
| In vivo — maternal |
|
|
Other Concerns: Adapted Inducers
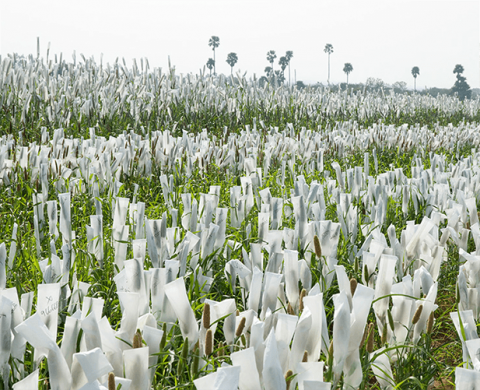
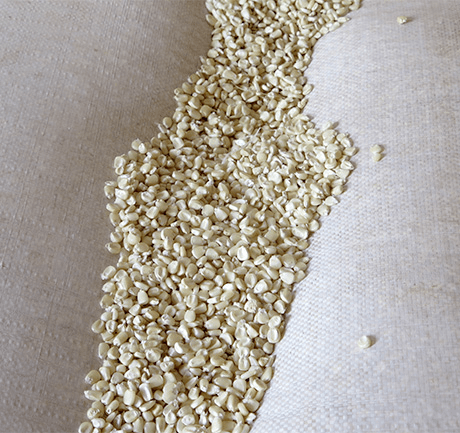
Need for developing adapted inducers: For large-scale haploid seed production, it is important to use inducer genotypes that are adapted to the haploid seed production environment (Fig. 12).
Other Concerns: Alternative Markers
Need to apply alternative markers: The R1-nj marker works in a in a wide range of donor genotypes since the majority of commercial corn is unpigmented. However, the marker may be suppressed by inhibitor genes (e.g. C1-I), that are carried by the female parent (Fig. 13B).
Other Concerns: Toxicity
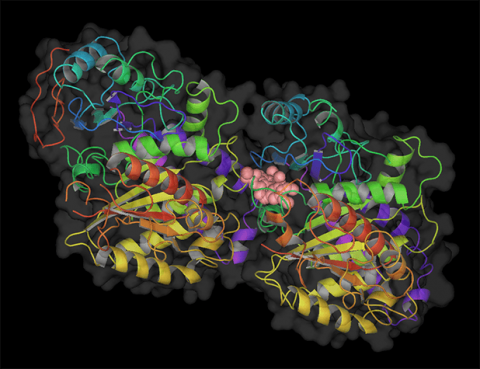
Toxicity of chemical inducers: Colchicine inhibits microtubule polymerization during meiosis by binding to tubulin, one of the main constituents of microtubules. However, colchicine is also very toxic. Less toxic inhibitors of mitosis than colchicine are presently under evaluation or already in use for large-scale chromosome doubling programs. These include (a) herbicides, e.g., Pronamid, Trifluralin, and Oryzalin; (b) caffeine; and (c) nitrous oxide.
Genomic Tools for Hybrid Breeding
Description
The seed of a hybrid variety used for a commercial planting is produced by crossing two inbred parent lines from different heterotic groups. Individuals within a F1 hybrid variety are genetically heterozygous and homogeneous.
The two main goals of hybrid breeding are to maximize the agronomic performance (hybrid performance) and to identify the best performing genotype, while being able to reproduce this one genotype from its homozygous parents.
Part of the superiority of hybrids compared to inbred lines comes from heterosis. Parental lines have to perform sufficiently well, in particular the “seed parent”, on which hybrid seed will be produced. More important for selecting inbred lines in the breeding process is their general and specific combining ability.
Per se performance of inbred lines is a poor predictor for their combining ability, i.e., the yield potential of respective hybrids produced with those inbred lines. Thus testcrosses to determine general and later specific combining ability are crucial to identify best inbred line combinations.
Breeding Scheme
As only 100 inbred lines in each of two heterotic groups result in 100 x 100 = 10,000 potential hybrids (Fig. 16), any procedures that identify the most promising combinations contribute substantially to the efficiency of hybrid breeding programs. Molecular and biotechnological tools contribute to more efficient hybrid breeding schemes (see bullets in Fig. 16).
Associations
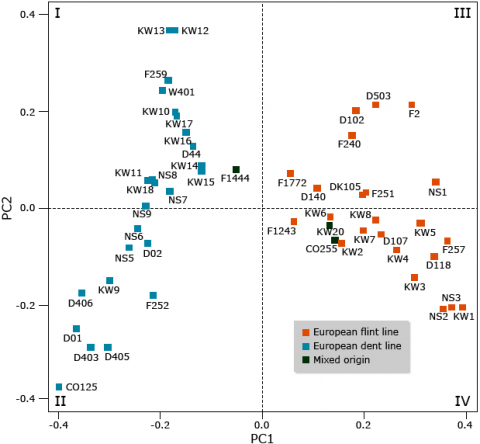
Molecular markers are useful to assign inbred lines to heterotic groups based on their genetic similarity, e.g., by a principle coordinate analysis (Fig. 17).
Molecular Basis of Heterosis
Three traditional hypotheses try to explain heterosis: dominance, overdominance, and epistasis:
- In the dominance hypothesis, superiority of hybrids is caused by total or partial dominance, due to masking of undesirable recessive alleles from one inbred parent by dominant alleles from the other inbred parent.
- The overdominance hypothesis posits that hybrid vigor is caused by superior performance of heterozygotes due to over-dominance at loci contributing to the trait of interest.
- The interaction of favorable alleles at different loci (i.e., epistasis) is another classical explanation of hybrid vigor.
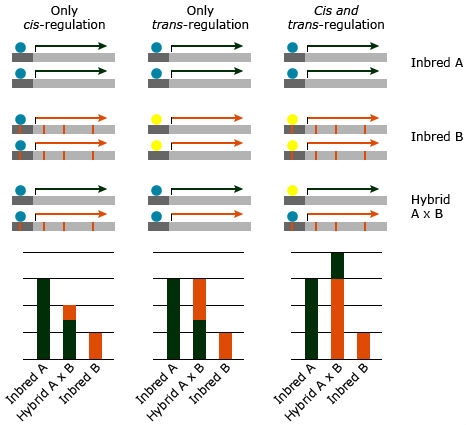
Changes in Gene Expression
Another important factor leading to superiority of hybrids over inbred parents are changes in gene expression (Figs. 19 and 20). Gene expression describes regulation of gene activity according to the physiological demands of a particular cell type, developmental stage, or environmental condition. In the context of gene expression, DNA sequence motifs in the vicinity of the structural portion of the gene that are necessary for gene expression are referred to as cis-elements. Transcription factors that bind to cis-elements are referred to as trans-acting factors. The combination of cis- and trans- regulation in allele specific gene expression might lead to significant increase in the hybrid performance over the parental lines. However, a gene that is exclusively subjected to trans-regulation is expected to provide an equal expression of both alleles in the hybrid, whereas genes exposed to cis-regulation will exhibit unequal expression of the two alleles in the hybrid (Figure 22; Hochholdinger and Hoecker, 2007).
Gene Expression Studies
These studies (Table 2 ) analyzed heterosis-associated gene expression in various species by comparing expression patterns of selected genes in inbred lines and hybrids.
| Plant organ | Developmental stage | Approach | Genetic background | Global expression trend |
|---|---|---|---|---|
| Maize | ||||
| Embryo | 6 DAP | 12K cDNA microarrays SSH | UH005 UH301 |
Additivity |
| Endosperm | 10, 14, 21 DAP | GeneCalling | 7 Pioneer® inbred lines | Nonadditivity |
| Endosperm | 18 DAP | RT-PCR | B73 BSSS53 |
Nonadditivity |
| Embryo | 19 DAP | 13.5 microarrays | Mo17 | Additivity |
| Seedling | 11 DAG | B73 | ||
| Immature ear | ||||
| Seedling | 14 DAG | 14K cDNA microarrays qRT-PCR |
Mo17 B73 |
Additivity |
| Shoot apical meristem | 21-23 DAP | 12K cDNA microarrays qRT-PCR |
UH002 UH005 Uh350 UH31 |
Nonadditivity |
| Adult leaves of di- and triploids | Quantitative Northern blotting | Mo17 B73 |
Nonadditivity | |
| Arabidopsis | ||||
| First Leaves | 21, 24 DAG | 6KcDNA | Col Ler Cvi |
Nonadditivity |
| Rice | ||||
| Panicle | Stage III, IV, V | 9K cDNA microarrays | Zhenshan97 Minghui63 |
Additivity |
Molecular Insight
The molecular basis of heterosis is not well understood. However, continuing efforts to understand heterosis at the molecular level are providing new insights. In comparative genomics, colinearity describes the conservation of the gene order within a chromosomal segment between different species, resulting in linear arrangement of DNA, mRNA, and the resulting protein sequence. However, when two different cultivars of the same species are mated, chromosome pairing during meiosis allows crossover between colinear genes resulting in meiotic products that could differ in gene content and colinearity (noncolinearity). Some studies have identified several hundreds of genes that display presence/absence variation among investigated lines indicating a very high level of noncolinearity.
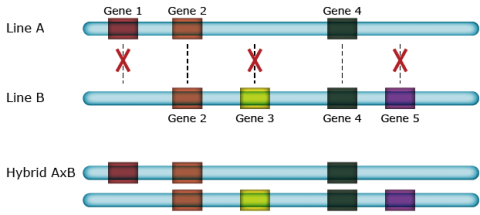
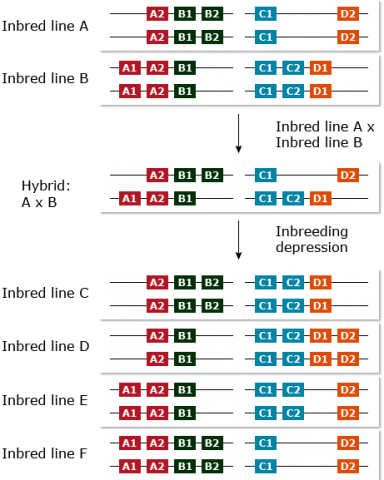
Hemizygous Complementation
Hemizygous complementation of many genes with minor quantitative effects in hybrids might lead to superior performance of F1 hybrid plants over their parental inbred lines (Fig. 22). Moreover, given that genes are present in one but absent in other inbreds, any hybrid will have a larger number of different genes (albeit only in one copy), than each of the two inbred parents. The presence of hemizygous genes with minor effect could also explain the inbreeding depression after many generations of selfing due to the loss of hemizygous genes (Fu and Dooner 2002), and /or the lower number of different genes, compared to heterozygous genotypes.
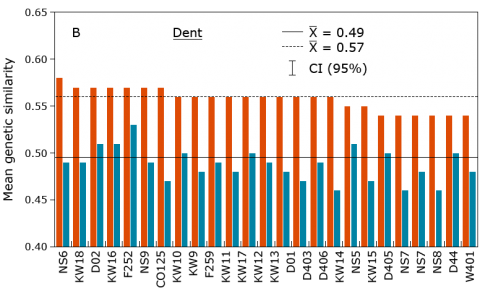
Genetic Similarity Analysis
Marker Applications for Heterotic Pool Formation and Assignment
DNA markers have been found to be useful for the description or establishment of heterotic groups in various crops and to assign inbred lines to those groups, including maize (Fig. 24), rice, sunflower, sorghum, wheat, triticale, and oat. Subsequently, crosses can be restricted to combinations among divergent groups to maximize hybrid performance.
Genomic Tools to Understand Heterosis
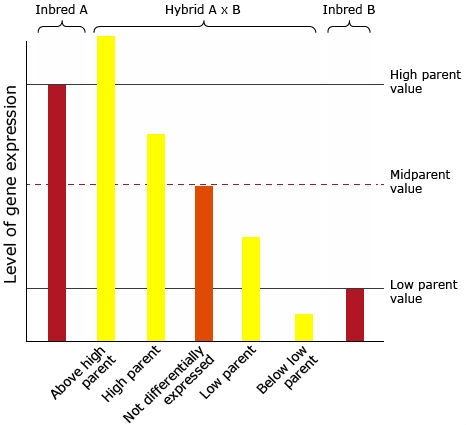
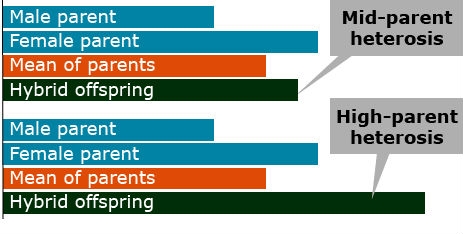
Heterosis, commonly referred to as hybrid vigor, can be expressed in two ways.
- Mid-parent heterosis is when the performance of the hybrid exceeds the mean performance of its parents.
- High-parent heterosis is when the hybrid performs better than either parent.
Both types of heterosis are not of commercial interest because they measure the relative performance of hybrids to their inbred parents. If parents are poor performing, heterosis may be high, but the hybrids with the highest heterosis might not be the most superior genotypes. From an agronomic perspective, hybrid performance is most critical, which is the hybrid grain yield (or any other target trait) irrespective of the parental performance.
Maize is an example of a species in which heterotic groups are important for maximizing the performance of hybrid cultivars. One heterotic group in the Midwestern U.S. is referred to as the Iowa Stiff Stalk Synthetic, which was developed by corn breeders of the USDA-ARS and Iowa State University. The other heterotic groups are referred to as non-Stiff Stalk. They include the maize populations Lancaster and Reid Yellow Dent. The best hybrid performance has generally been obtained by crossing inbreds from the Stiff Stalk Synthetic with those from one of the other heterotic groups.
Predicting Hybrid Performance
Genomic Approaches for Predicting Hybrid Performance
Field trials to assess hybrid performance are laborious, time-consuming, and expensive. Testing all possible combinations for a large number of inbred lines to select the best inbred combinations is not feasible in a breeding program. Thus, prediction of hybrid performance and heterosis based on inbred line information is of great interest for plant breeders to evaluate only a small fraction of available inbred lines in the field.
DNA-Based Markers
Genomic Approaches For Predicting Hybrid Performance
Example 1: DNA-Based Markers
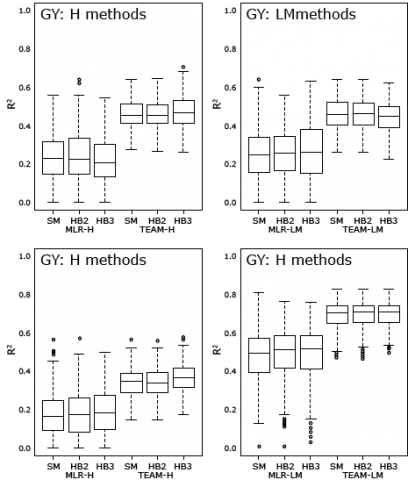
Molecular marker-based prediction of hybrid performance in maize using unbalanced data from multiple experiments with factorial crosses (Schrag et al., 2009)
In contrast to the work by Frisch et al. (2010) below that used non-DNA markers (mRNA), Schrag et al. (2009) utilized DNA-based markers (AFLP) to estimate hybrid performance in maize.
The following marker-based methods were used:
- MLR-H: The prediction of hybrid performance is regarded as a multiple linear regression (MLR) problem and the hybrid performance effects (“-H”) of the genotypic classes are computed at each AFLP marker locus
- MLR-LM: Is a hybrid performance prediction approach that uses DNA-based markers and combines line per se performance with mid-parent heterosis (“-LM”).
- TEAM-H: Total effect of associated markers (TEAM) is the sum of marker class effects across AFLP markers that show significant association with a trait of interest. Hybrid performance values (“-H”) are regressed on the TEAM values across all hybrids in the experiment.
- TEAM-LM: Analogous to MLR-LM and used to predict hybrid performance by adding mid-parent heterosis predicted by TEAM and the mid-parent performance estimated from mean of linear regression models of the corresponding parental lines per se performance.
From their analyses, Schrag et al. (2009) concluded that DNA-based markers can be used to efficiently predict hybrid performance (Fig. 26).
Non-DNA Markers
Genomic Approaches For Predicting Hybrid Performance
Example 2: Non-DNA Markers
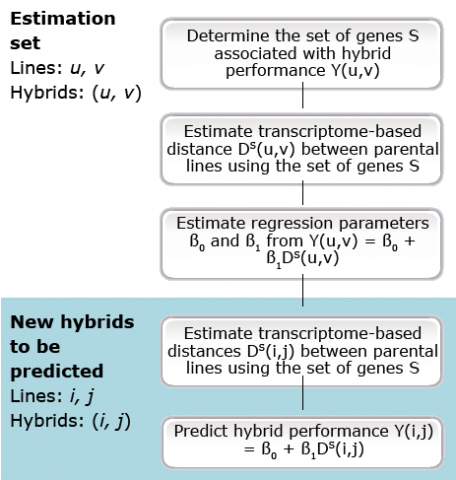
Transcriptome-based distance measures for grouping of germplasm and prediction of hybrid performance in maize (Frisch et al., 2010). Frisch et al. (2010) conducted a gene expression study to determine hybrid performance in maize (Fig. 28). In this study, transcription profiles from seedlings of 21 day old parental maize lines of a 7 × 14 factorial with a 46-k oligonucleotide array were analyzed to predict the performance 98 hybrid combinations based on the transcriptome-based distances. Five seedlings per entry were pooled for RNA extraction. The maize 46-k array from the maize oligonucleotide array project (http://www.maizearray.org, University of Arizona, USA) that contain 43381 oligonucleotides (in total 46,128 features) printed on a glass-slide was used for hybridization analyses.
Genetic Distance Formula
Genomic Approaches For Predicting Hybrid Performance
Example 2: Non-DNA Markers
DA = Genetic distance between inbred lines i and j as depicted in Equation 1; DA is used with molecular marker data; in Frisch et al. (2010), AFLP analyses resulted in 1,835 markers.
[latex]\begin{align*} D_A(i,j) &= \sqrt{\frac{1}{n_m} \sum_{m=1}^{n_m} [b_m (i) - b_m (j)]^2} \\ &=\sqrt{1 - SM (i,j)} \end{align*}[/latex]
Equation 1
where:
bm (i) = indicator variable for inbred line i; value = 0 or 1
bm (j) = indicator variable for inbred line j; = 0 or 1
nm = number of AFLP bands
SM (i,j) = single matching coefficient
In Equation 1 for genetic distance or DA, bm(i) and bm(j) are indicator variables taking the value one (1), if AFLP band m is observed in inbred line i or inbred line j, respectively, and zero (0) otherwise. SM(i,j) is the single matching coefficient.
Euclidean Distance
Genomic Approaches For Predicting Hybrid Performance
Example 2: Non-DNA Markers
DE = Euclidean distance between inbred lines i and j as depicted in the equation; DB is used with gene expression data.
[latex]D_E (i,j) = \sqrt{\sum_{g-1}^{n_g} [l_g(i) - l_g (i)]^2}[/latex]
Equation 2
where:
lg (i) = base – two logarithm of transcript abundance
lg (j) = base – two logarithm of transcript abundance of gene g inbred line j
ng = number of genes
Binary Distance
Genomic Approaches For Predicting Hybrid Performance
Example 2: Non-DNA Markers
DB = Binary distance between inbred lines i and j as depicted in the equation; DB is used with gene expression data
[latex]D_B (i,j) = \sqrt{\frac{1}{n_g}\sum_{g=1}^{n_g}[x_g (i) - x_g (j)]^2}[/latex]
Equation 3
where:
xg (i) = indicator variable or inbred line i; value = 0 or 1
xg (j) = indicator variable for inbred line j; value = 0 or 1
ng = number of genes
In the equation for binary distance or DB (Equation 2), xm(i) and xm(j) are indicator variables taking the value 1 or 0, depending on differential gene expression of gene g in inbred lines i and j.
If gene g is differentially expressed in lines i and j,
then xg(i) = 1 and xg(i) = 0 for lg(i) > lg(j),
and xg(i) = 0 and xg(i) = 1 for lg(i) ≤ lg(j)
If gene g is not differentially expressed,
then xg(i) = xg(i) = 0
In the latter case, then Equation 3 simplifies to
[latex]D_u(i,j) = \sqrt{\dfrac{n_s(i,j)}{n_g}}[/latex]
where ns(i,j) is the number of genes differentially expressed in line i and j.
Correlation
Genomic Approaches For Predicting Hybrid Performance
Example 2: Non-DNA Markers
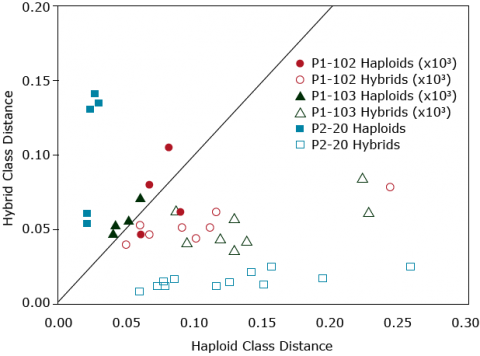
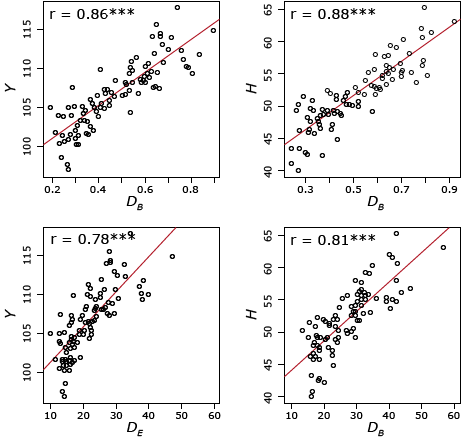
The distances DB and DE were determined from the subset of genes SP, comprising 10,810 differentially expressed genes. SP is the subset of genes that were differentially expressed in at least one pair of parental lines. For the r value in Fig. 28, ns = P>0.05 and *** = P≤0.001. The performance of the 98 hybrids was assessed in the field. Multivariate analyses for germplasm grouping was used and showed that the transcriptome-based distances were powerful as other DNA based markers to separate flint from dent inbred lines (Fig. 28). Note that the differentially expressed genes associated with hybrid performance and/or heterosis were identified in an estimation set, and then used to predict new hybrids. The correlations presented in Fig. 28 are for hybrids, which have not been used to pick the yield associated genes.
Frisch et al. (2010) suggested that the close positive significant correlations between the transcriptome-based distances with hybrid performance and heterosis (Fig. 28) may be explained by: (i) the high density of transcriptome loci, which was as a consequence of a high number of differentially expressed genes, indicating good coverage of the genes underlying grain yield, (ii) RNA expression profiling investigates directly the genes, and does not rely on LD between marker alleles and trait of interest, therefore, it is not affected by different linkage phases in different heterotic pools and directly quantifies functional genes between two lines, and (iii) the contribution of additive–additive interactions, which may increase the proportion of phenotypic variance explained by the transcriptome-based distances (Frisch et al., 2010).
According to Frisch et al. (2010), transcriptome-based selection is a promising procedure to predict hybrid peformance in the future. Two main advantages could be attained from RNA expression profiling: (i) enhancing the efficiency of the hybrid breeding program by selecting seedlings directly after inbred line production rather than testing inbred line combinations for many seasons and/or analyzing specific tissues, and (ii) with the reduction in the transcriptome analysis cost in the future, pre-selection at the seedling stage can improve the cost efficiency of hybrid plant breeding programs. It view of high correlations between transcriptome-based distances and hybrid performance (r≈ 0.80), it could be concluded that indirect selection based on transcriptome-based distances has the same efficiency as that of direct selection under field conditions (Frisch et al., 2010).
For the prediction of hybrid performance and heterosis, transcriptome data have two advantages over DNA marker data: (i) they do not rely on linkage disequilibrium between marker alleles and QTL alleles, and (ii) they quantify directly the expression of genes, since this analysis not only determines if specific genes are present, but also the degree to which the genes are up or down-regulated. Consequently, transcriptome-based approaches may be superior to DNA marker-based approaches in some situations.
Characterization of Heterosis
Genomic Approaches For Predicting Hybrid Performance
Example 3
Correlation between parental transcriptome and field data for the characterization of heterosis in maize (Thiemann et al., 2010)
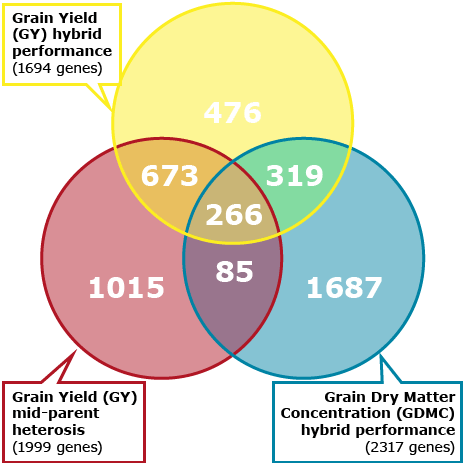
The study by Thiemann et al. (2010) compared parental inbreds in a mixed pool crosses using microarray analysis. The study also examined correlation of gene transcript abundance to mid-parent heterosis and hybrid performance for grain yield and grain dry matter concentration. The third objective of the study was to perform gene ontology (GO) analyses for functional comparison of gene groups correlated in their parental expression level for hybrid performance for grain yield and grain dry matter concentration. Lastly, Thiemann et al. (2010) characterized the function of gene groups correlated with mid-parent heterosis for grain yield.
Interwoven Loop Design
Genomic Approaches For Predicting Hybrid Performance
Example 3
Correlation between parental transcriptome and field data for the characterization of heterosis in maize (Thiemann et al., 2010)
The objective of the study by Thiemann et al. (2010) was to compare parental inbreds in a mixed pool crosses using microarray analysis. The study also examined correlation of gene transcript abundance to mid-parent heterosis and hybrid performance for grain yield and grain dry matter concentration. The third objective of the study was to perform gene ontology (GO) analyses for functional comparison of gene groups correlated in their parental expression level for hybrid performance for grain yield and grain dry matter concentration. Lastly, Thiemann et al. (2010) characterized the function of gene groups correlated with mid-parent heterosis for grain yield.
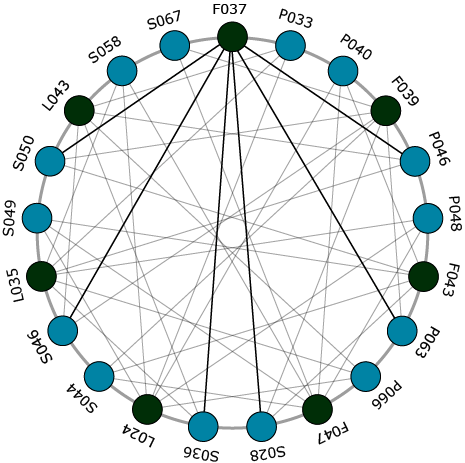
Trait-Correlated Genes
Genomic Approaches For Predicting Hybrid Performance
Example 3
Correlation between parental transcriptome and field data for the characterization of heterosis in maize (Thiemann et al., 2010)
The objective of the study by Thiemann et al. (2010) was to compare parental inbreds in a mixed pool crosses using microarray analysis. The study also examined correlation of gene transcript abundance to mid-parent heterosis and hybrid performance for grain yield and grain dry matter concentration. The third objective of the study was to perform gene ontology (GO) analyses for functional comparison of gene groups correlated in their parental expression level for hybrid performance for grain yield and grain dry matter concentration. Lastly, Thiemann et al. (2010) characterized the function of gene groups correlated with mid-parent heterosis for grain yield.
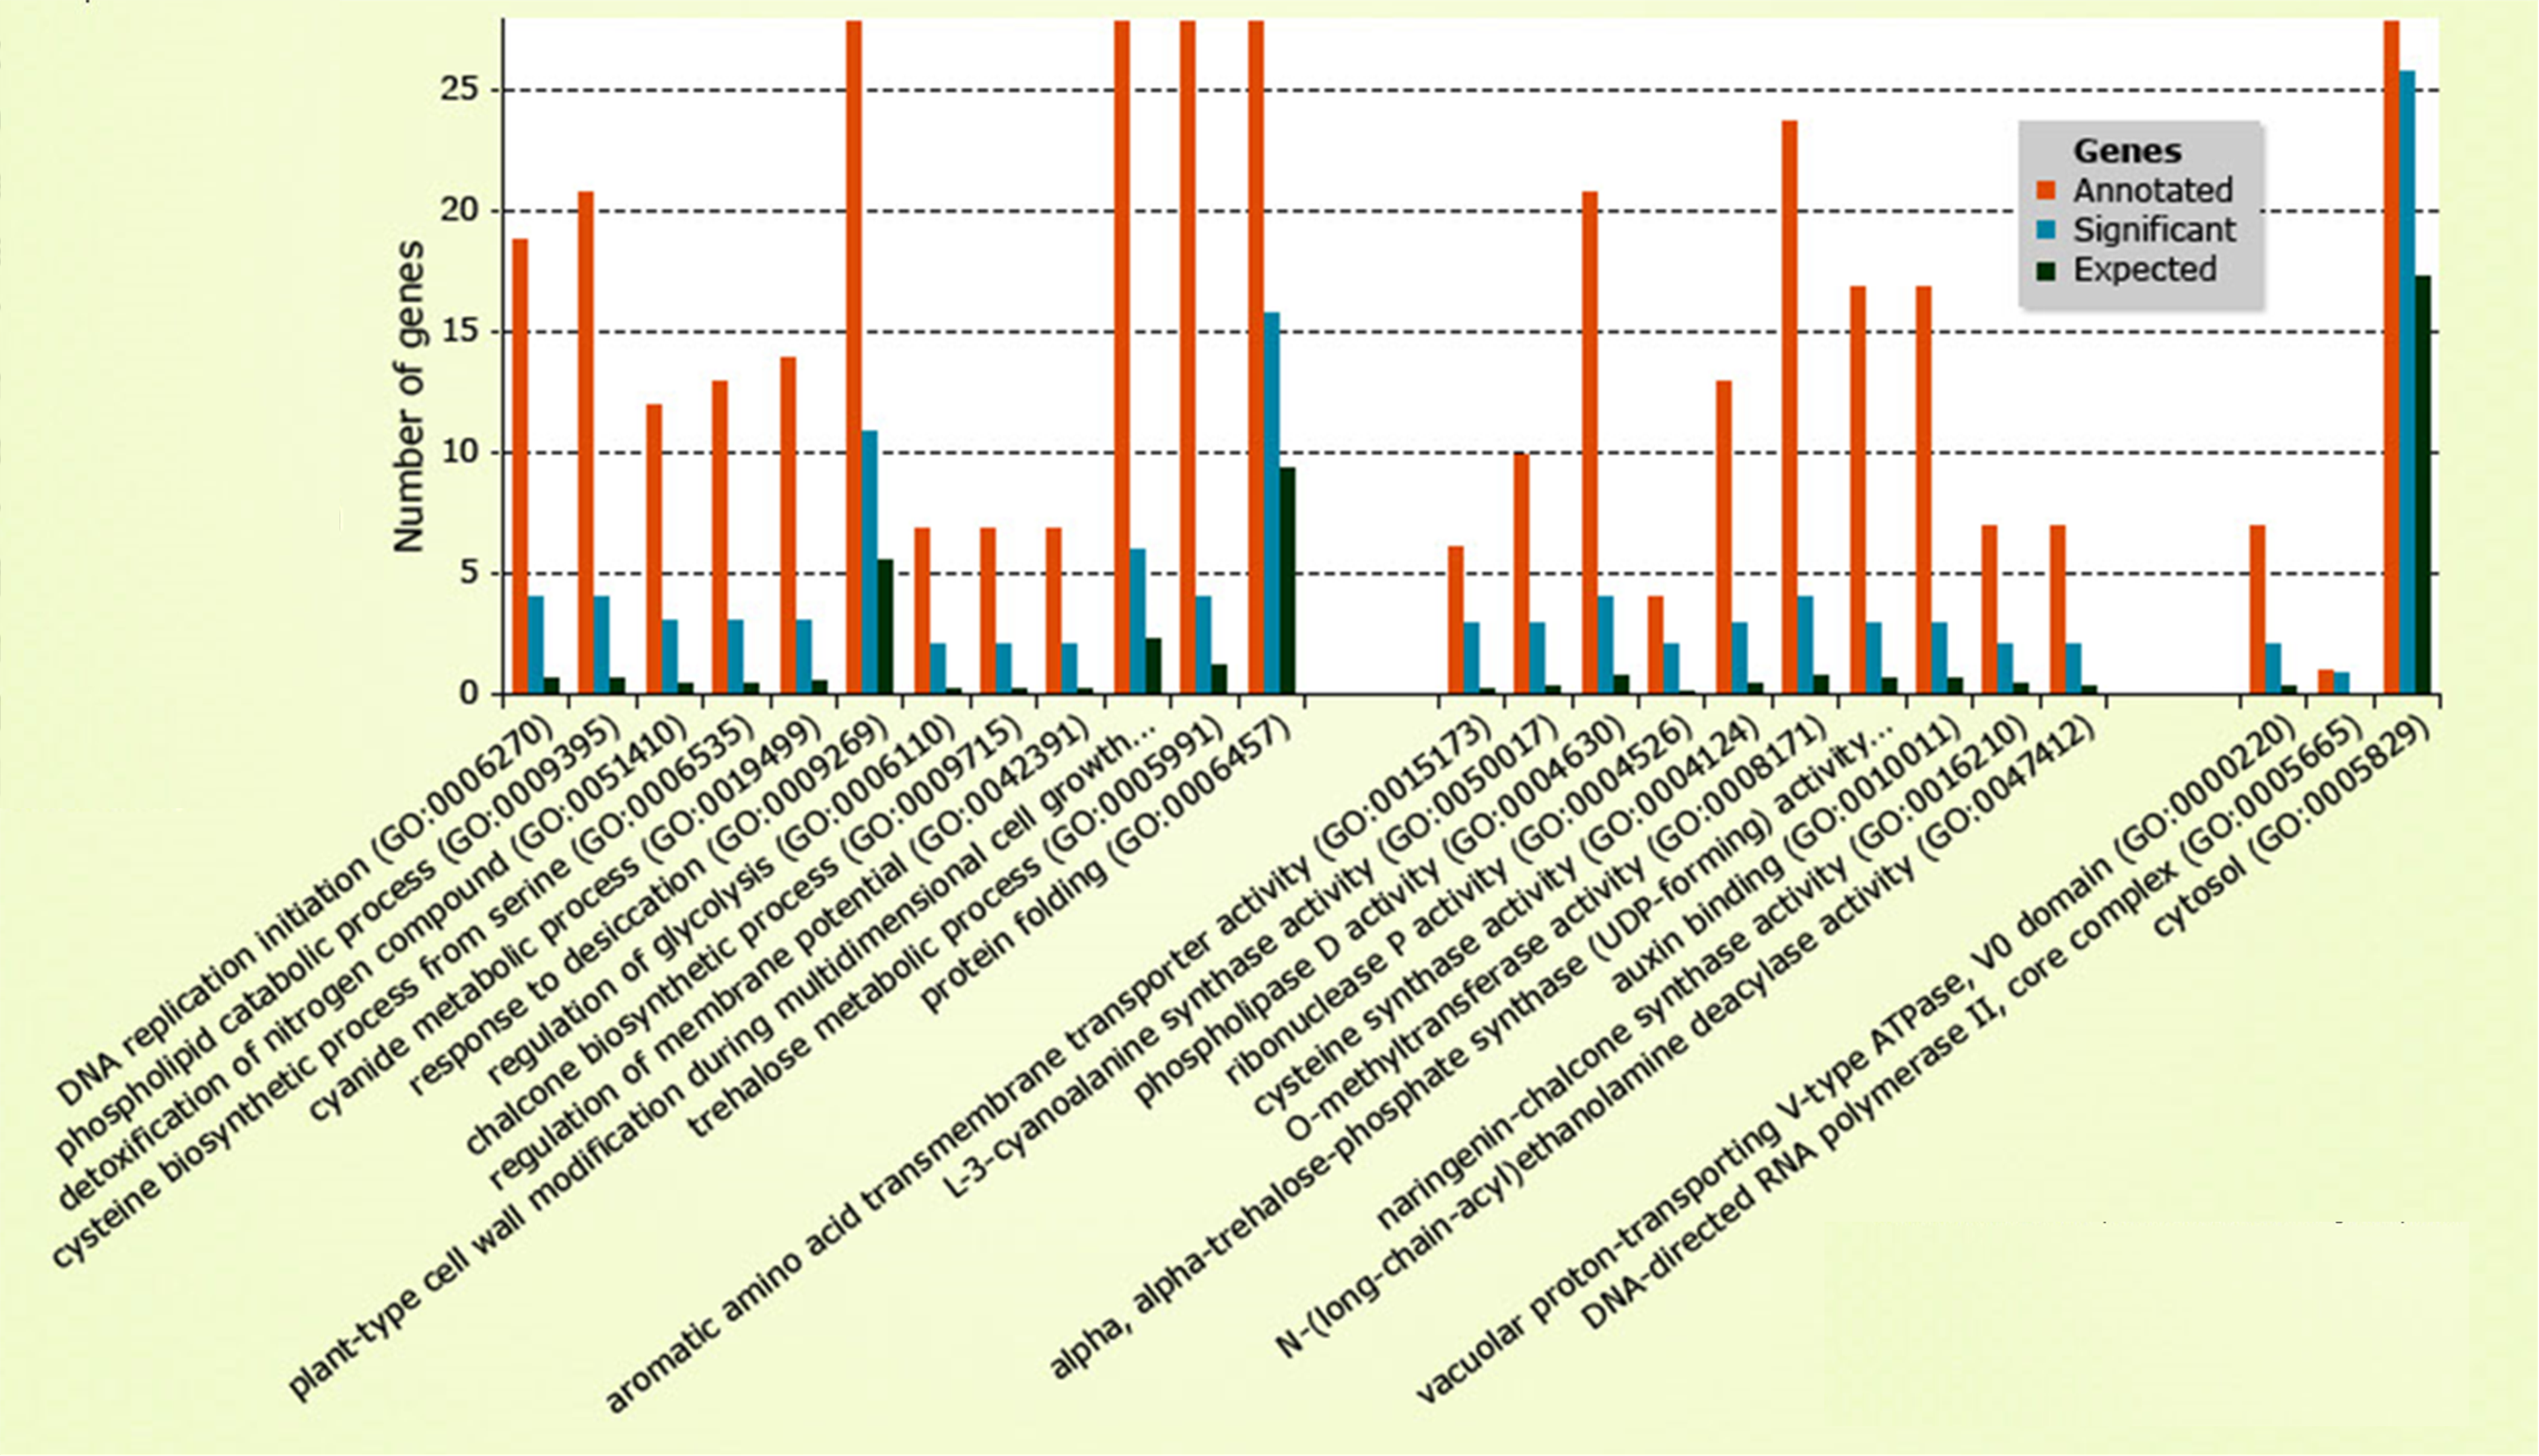
Overrepresented GO Terms
Genomic Approaches For Predicting Hybrid Performance
Example 3
Correlation between parental transcriptome and field data for the characterization of heterosis in maize (Thiemann et al., 2010)
Non-DNA vs. DNA-Based Markers
Recall in the advantage of DNA markers is that they are not affected by environmental factors. However, the presence of a particular DNA sequence may not always lead to the expected expression for a trait of interest. This is because the expression of a particular allele depends on environmental conditions, and also interaction with other genes. Thus, even though an allele with a known effect on a particular trait is present, it might not result in the expected phenotype.
Therefore, DNA markers are considered to be a measure of the genetic potential of an individual. The equivalent in human genetics is the risk concept. Based on DNA information, it is possible to predict the risk of a patient for showing a particular condition (e.g., 30% to get pancreatic cancer at a certain age). However, whether this condition is expressed, depends on other circumstances. In contrast, if RNA- or metabolite-based biomarkers for this cancer type are available, onset of this condition can be predicted with high accuracy. Thus, non-DNA markers are indicative of the realized potential of an individual.
Since variation in gene expression is the main basis for phenotypic variation, and changes in level of gene expression is observed in hybrids compared to their parents (Hochholdinger and Hoeker, 2007), analysis of gene expression may be a better approach to determine hybrid performance. Recent studies have assessed transcriptome (mRNA expression) data to determine hybrid performance (Frisch et al., 2010; Thiemann et al., 2010). The advantage of transcriptome-based approaches is that transctriptome-based distances directly quantify the expression of genes, which may control the phenotype and do not depend on the linkage between markers and genes, which show weak correlation with heterosis.
References
Abdel-Ghani, A. H., and T. Lübberstedt. 2013. Parent selection – usefulness and prediction of hybrid performance. p. 349-368. In Lübberstedt, T., and R. K. Varshney. (eds.) Diagnostics in plant breeding. Springer, Verlag.
Brunner, S., K. Fengler, M. Morgante, et al. 2005. Evolution of DNA sequence nonhomologies among maize inbreds. Plant Cell 17: 343-360.
Falke, K. C., and S. Mahone. 2013. Non-DNA biomarkers. p. 11-37. In Lübberstedt, T., and R. K. Varshney. (eds.) Diagnostics in plant breeding. Springer, Verlag.
Forster, B. P., E. Herbele-Bors, K. J. Kasha, and A. Touraev. 2007. The resurgence of haploids in higher plants. Trends Plant Sci. 12: 268-375.
Frisch, M., A. Thiemann, J. Fu, et al. 2010. Transcriptome-based distance measures for grouping of germplasm and prediction of hybrid performance in maize. Theor. Appl. Genet. 120: 441-450.
Fu, H., and H. K. Dooner. 2002. Intraspecific violation of genetic colinearity and its implication in maize. Proc. Natl. Acad. Sci. USA 99: 9573-9578.
Hochholdinger, F., and N. Hoecker. 2007. Towards the molecular basis of heterosis. Trends Plant Sci. 12: 427-432.
Jones, R. W., T. Reinot, U. K. Frei, et al. 2012. Selection of haploid maize kernels from hybrid kernels for plant breeding using near-infrared spectroscopy and SIMCA analysis. Appl. Spectrosc. 66: 447-450.
Kibite, Solomon. An Isozyme Marker Linked to the N-1 Gene Governing Nakedness in Oat. Lacombe Research Centre, Lacombe, Alberta. Referenced in USDA Oat Newsletter, October 2002.
Lübberstedt, T. L., A. E. Melchinger, C. Duble, et al. 2000. Relationships among early European maize inbreds: IV. Genetic diversity revealed with AFLP markers and comparison with RFLP, RAPD, and pedigree data. Crop Sci. 40: 783-791.
Murovec, J., and B. Bohanec. 2012. Haploids and Doubled Haploids in Plant Breeding. p. 87-106. In I. Abdurakhmonov (ed.). Plant Breeding.
Prigge, V., and A. E. Melchinger. 2012. Production of haploids and doubled haploids in maize. Methods Mol. Biol. 877: 161-172.
Sanamyan, Marina, Petlyakova, Julia, Rakhmatullina, Emma, and Sharipova, Elnora. 2014. Cytogenetic Collection of Uzbekistan, World Cotton Germplasm Resources, Dr. Ibrokhim Abdurakhmonov (Ed.), ISBN: 978-953-51-1622-6, InTech, DOI: 10.5772/58589.
Scholten, S., and A. Thiemann. 2013. Transcriptome-based prediction of heterosis and hybrid performance. p. 265-279. In Lübberstedt, T., and R. K. Varshney. (eds.) Diagnostics in plant breeding. Springer, Verlag.
Schrag, T.A., J. Mohring, H.P Maurer, et al. 2009. Molecular marker-based prediction of hybrid performance in maize using unbalanced data from multiple experiments with factorial crosses. Theor. Appl. Genet. 11: 741-751.
Thiemann, A., J. Fu, T.A. Schrag, A.E. Melchinger, M. Frisch, and S. Scholten. 2010. Correlation between parental transcriptome and field data for the characterization of heterosis in Zea mays L. Theor. Appl. Genet. 120(2): 401-413.
Tuvesson, S., C. Dayteg, P. Hagberg, et al. 2007. Molecular markers and doubled haploids in European plant breeding programmes. Euphytica 158: 305-312.
Werner, K., W. Friedt, and F. Ordon. 2005. Strategies for pyramiding resistance genes against the Barley Yellow Mosaic Virus complex (BaMMV, BaYMV, BaYMV-2). Mol. Breeding 16: 45-55.
microtubule — a microscopic tubular structure present in numbers in the cytoplasm of cells, sometimes aggregating to form more complex structures.
