
Part One. Image Search/ Diagramming/ Data Visualization
Chapter 3. Illustrator – Diagram
Upon completing this session, students will be able to:
- (CO 1) Understand a working process to create a spatial, sequential process diagram
 Session Highlights
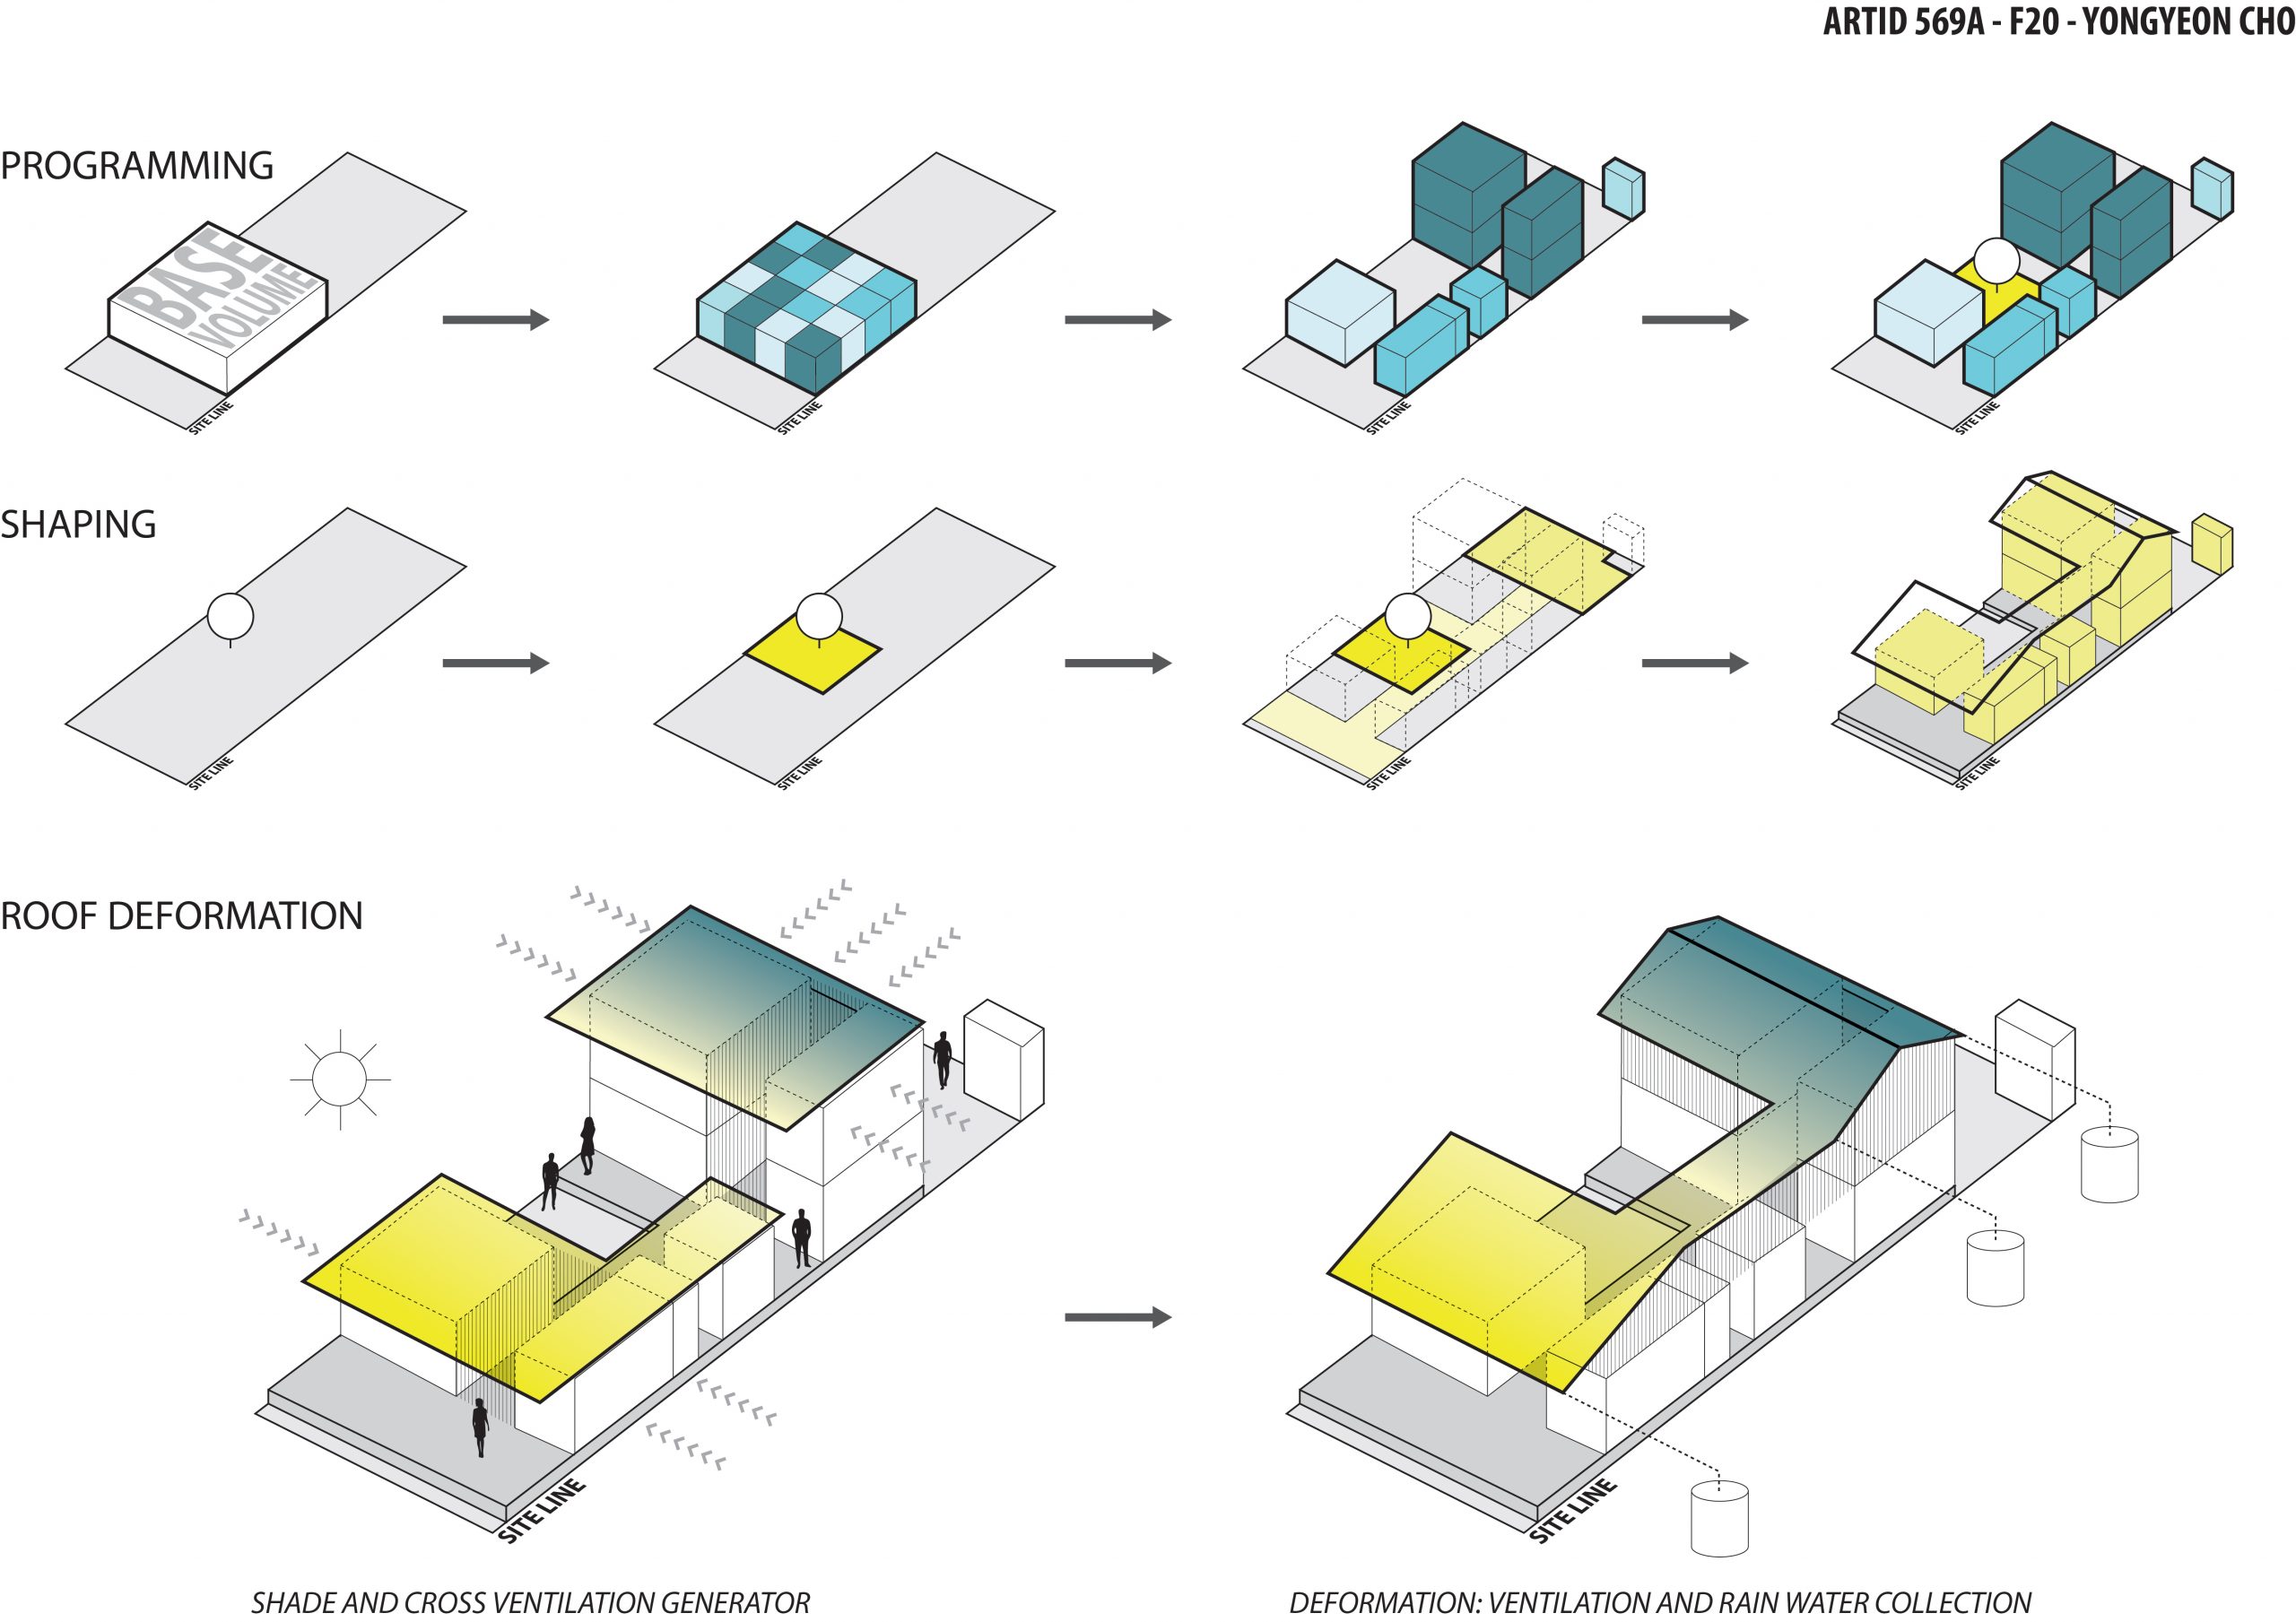
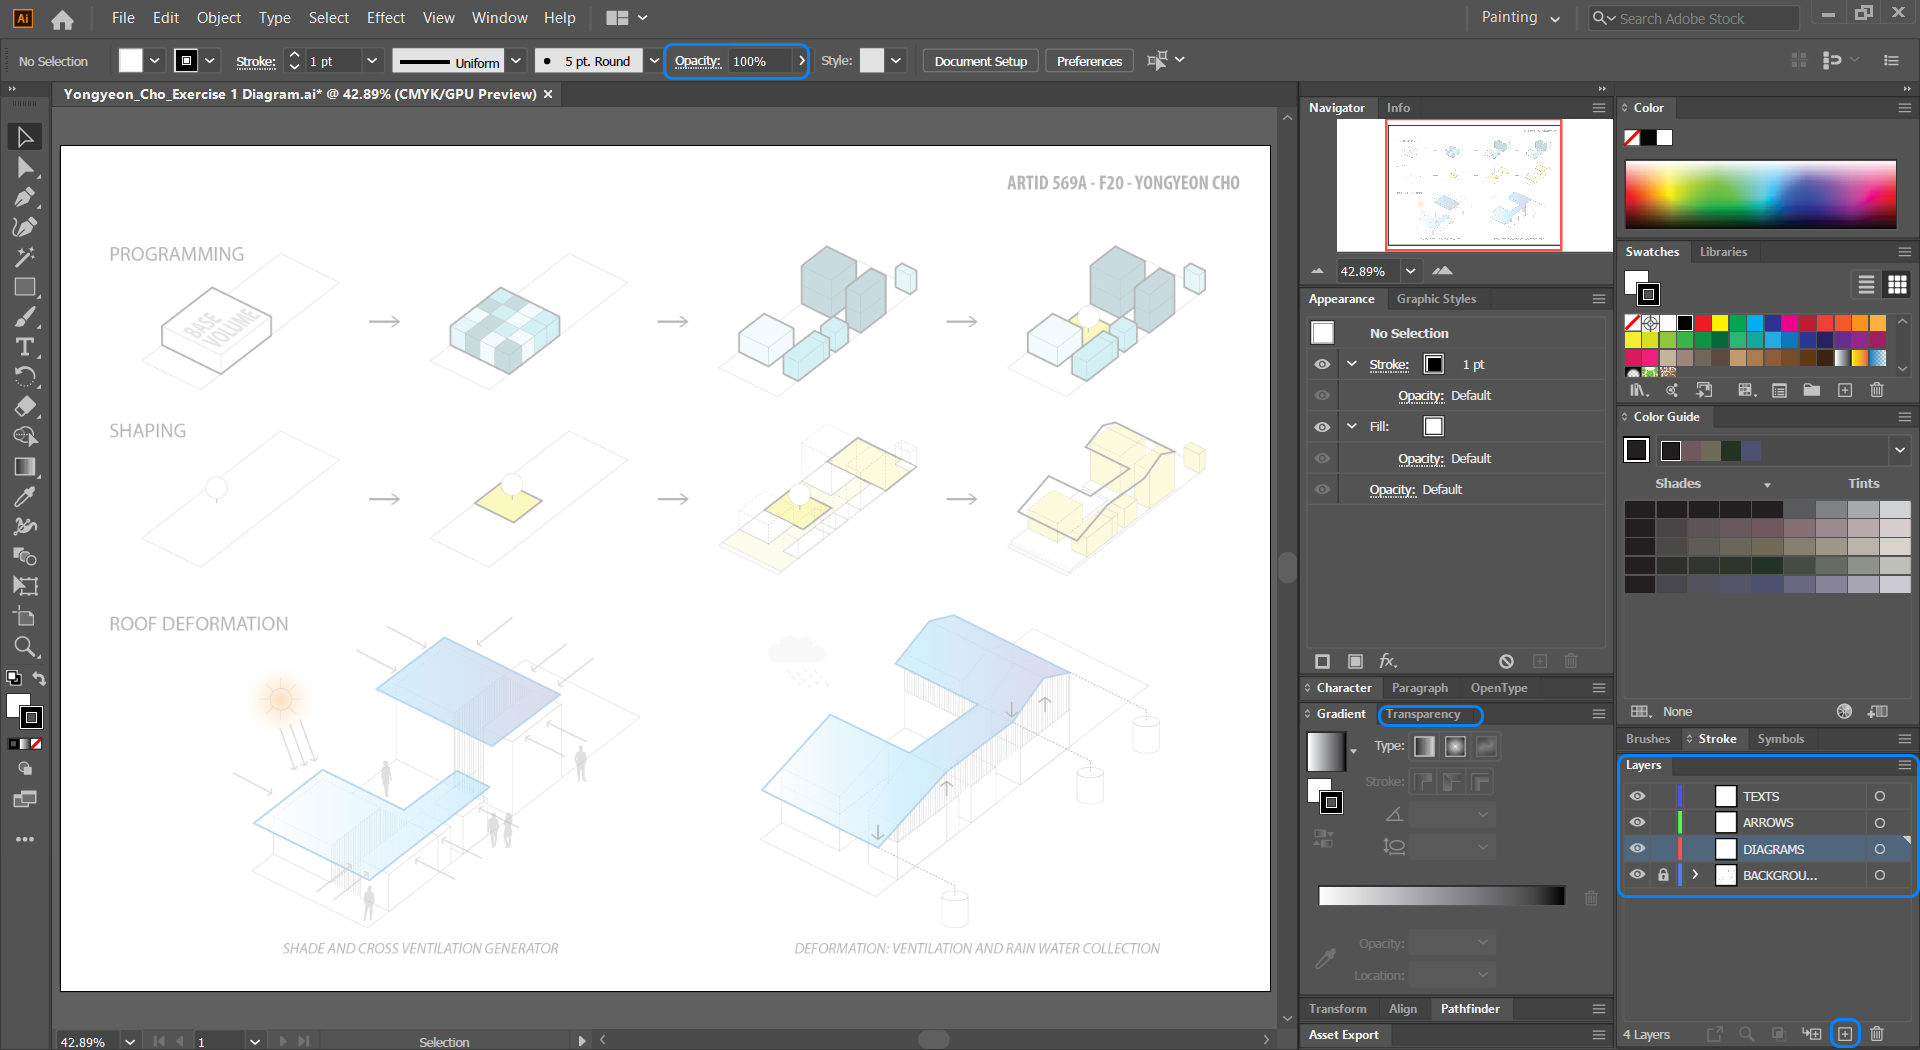
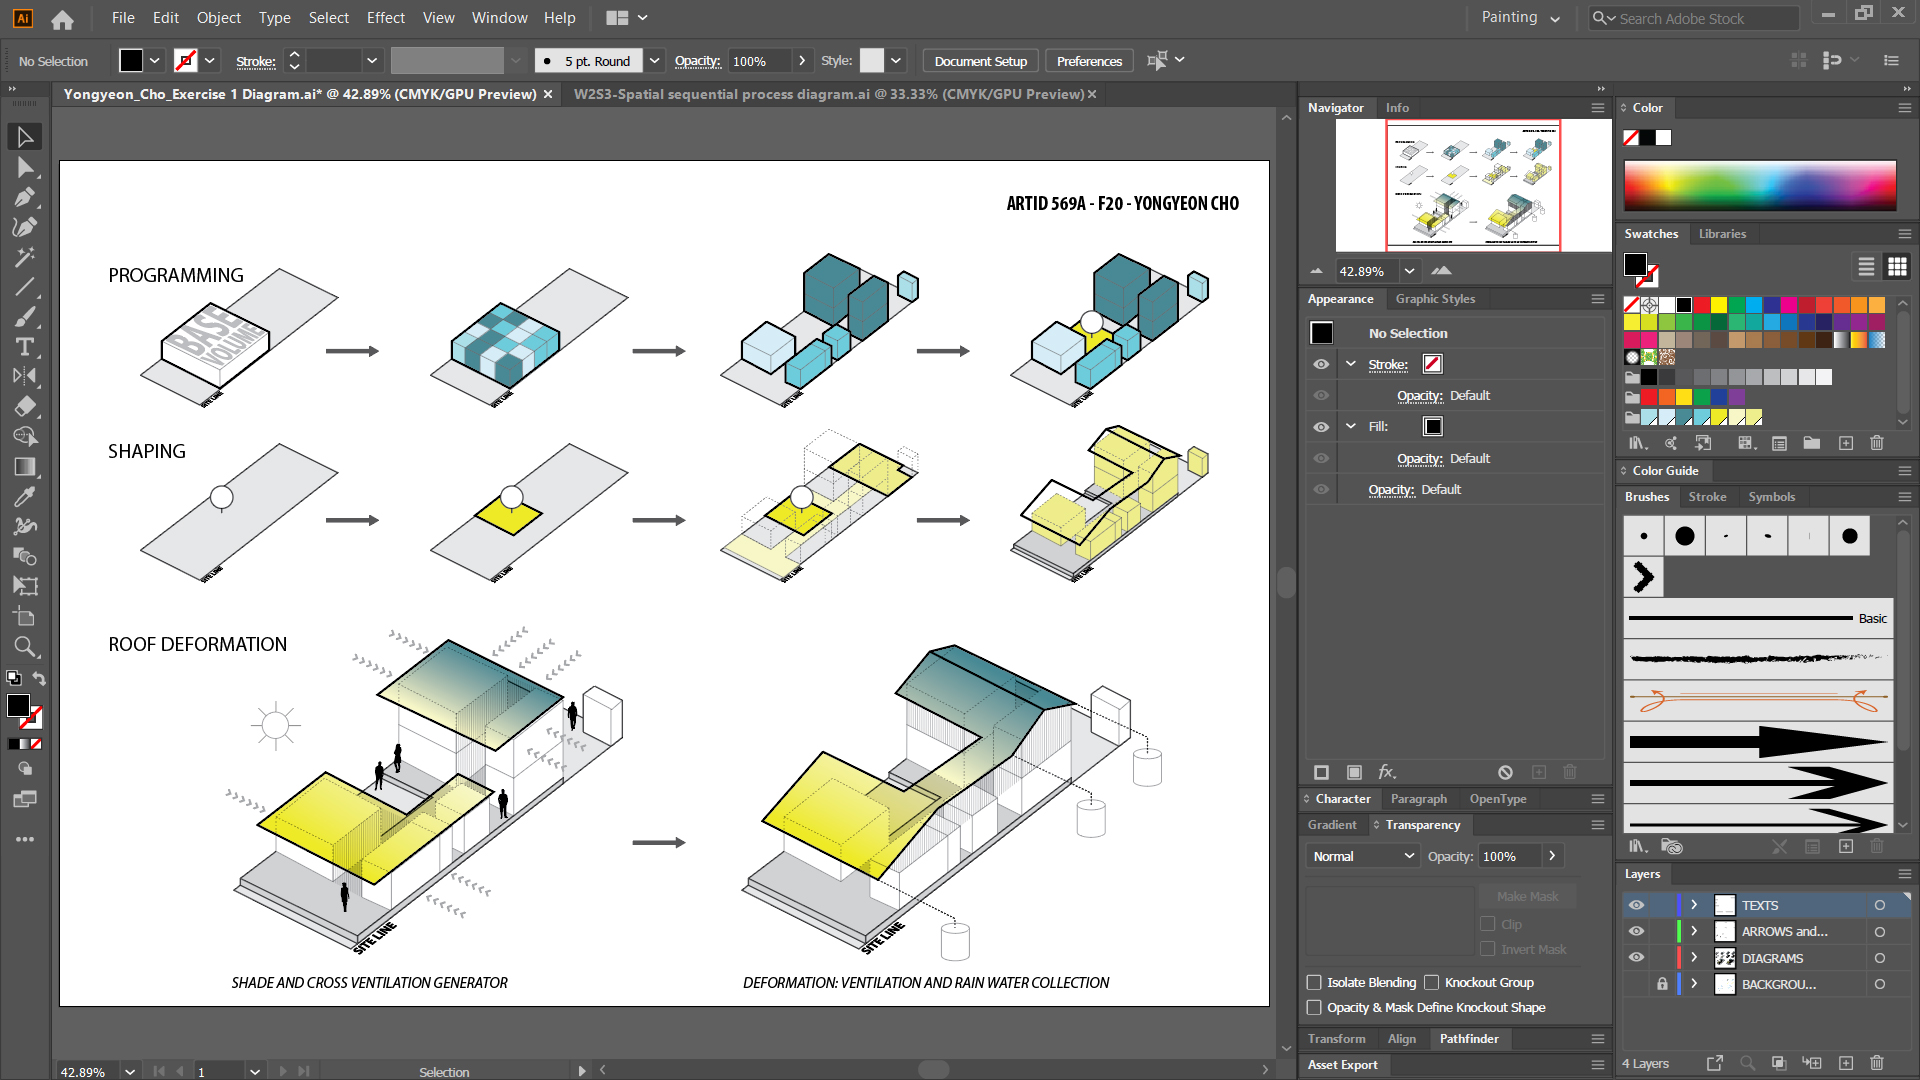
At the end of the session, students will be able to create the graphics below.
 Lecture Contents
(CO1) Understand a working process to create a spatial, sequential process diagram
In this tutorial, you will see a working process to create a spatial, sequential process diagram. Through the process, students will learn how to use the tools and commend in Illustrator.
Create a new file
- [STEP 01] Open Adobe illustrator. (in this tutorial, I used the illustrator 2021 version)
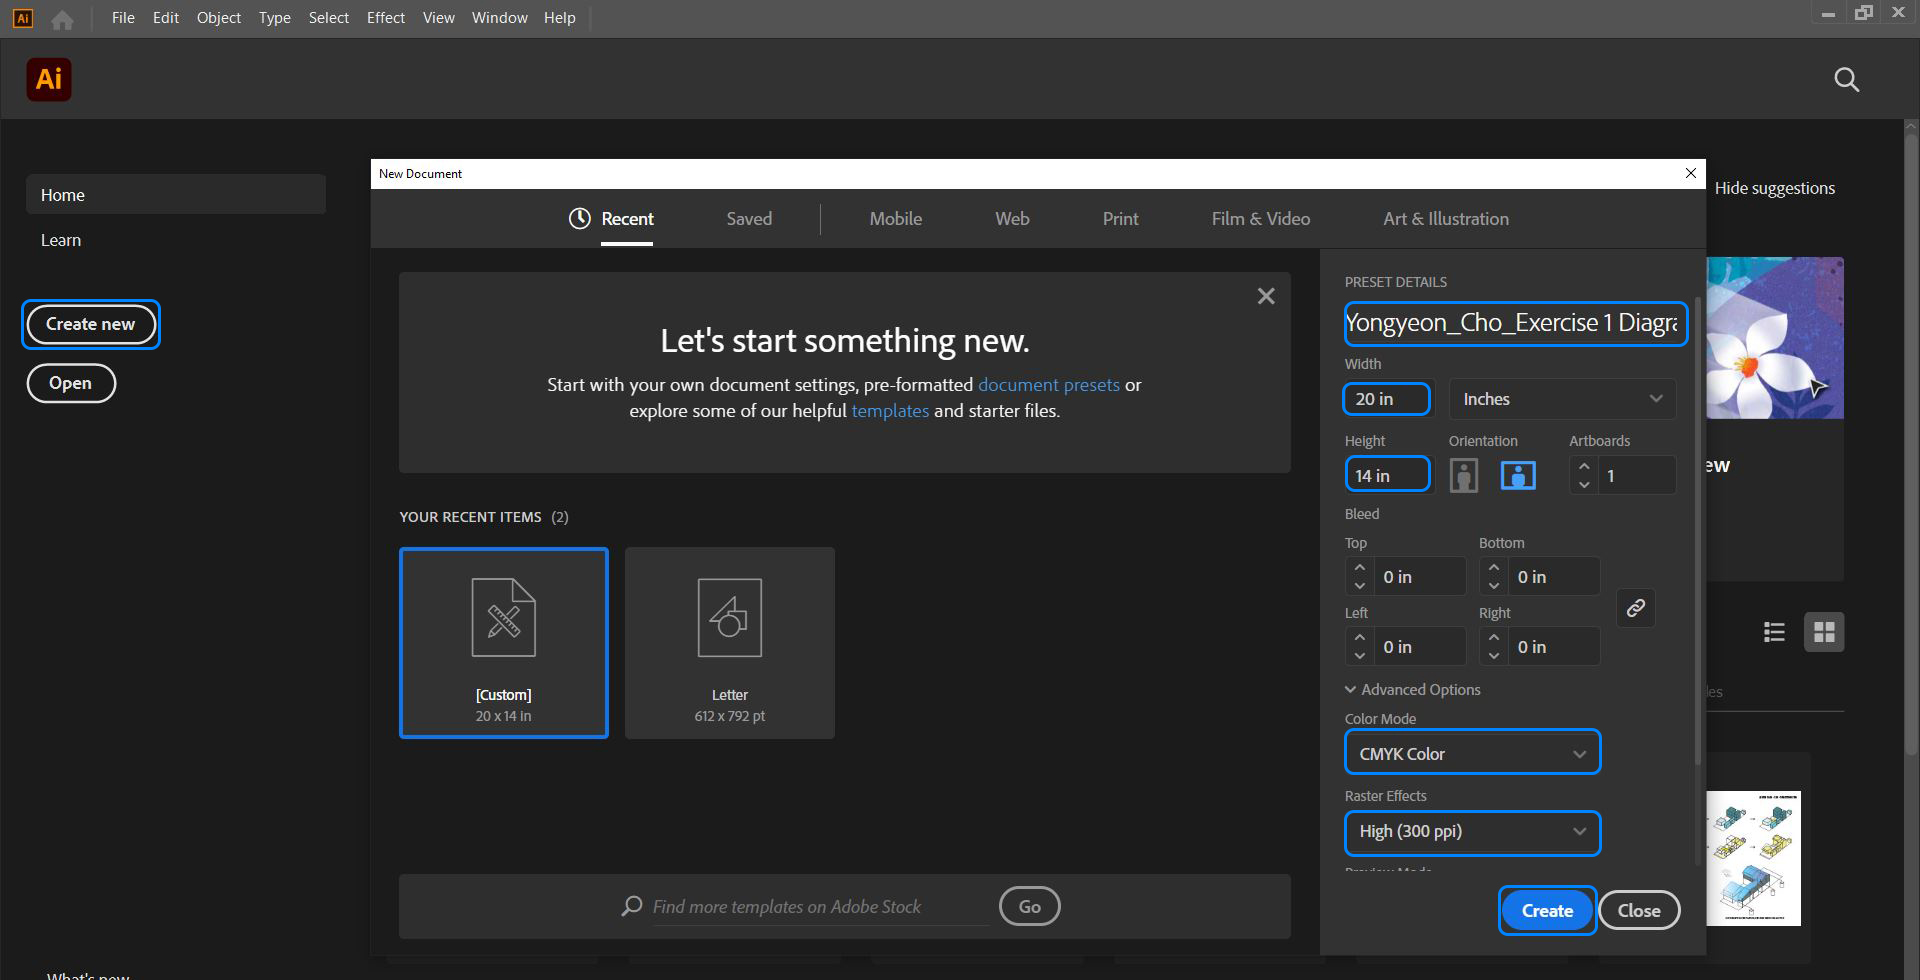
- [STEP 02] Create a new file by clicking [CREATE NEW].
- [STEP 03] Enter the file name [Firstname_Lastname_Exercise 1 Diagram].
- [STEP 04] Enter artboard size [20in x 14in].
- [STEP 05] Confirm Color mode [CMYK].
- [STEP 06] Raster effect [300 dpi].
Save the new file
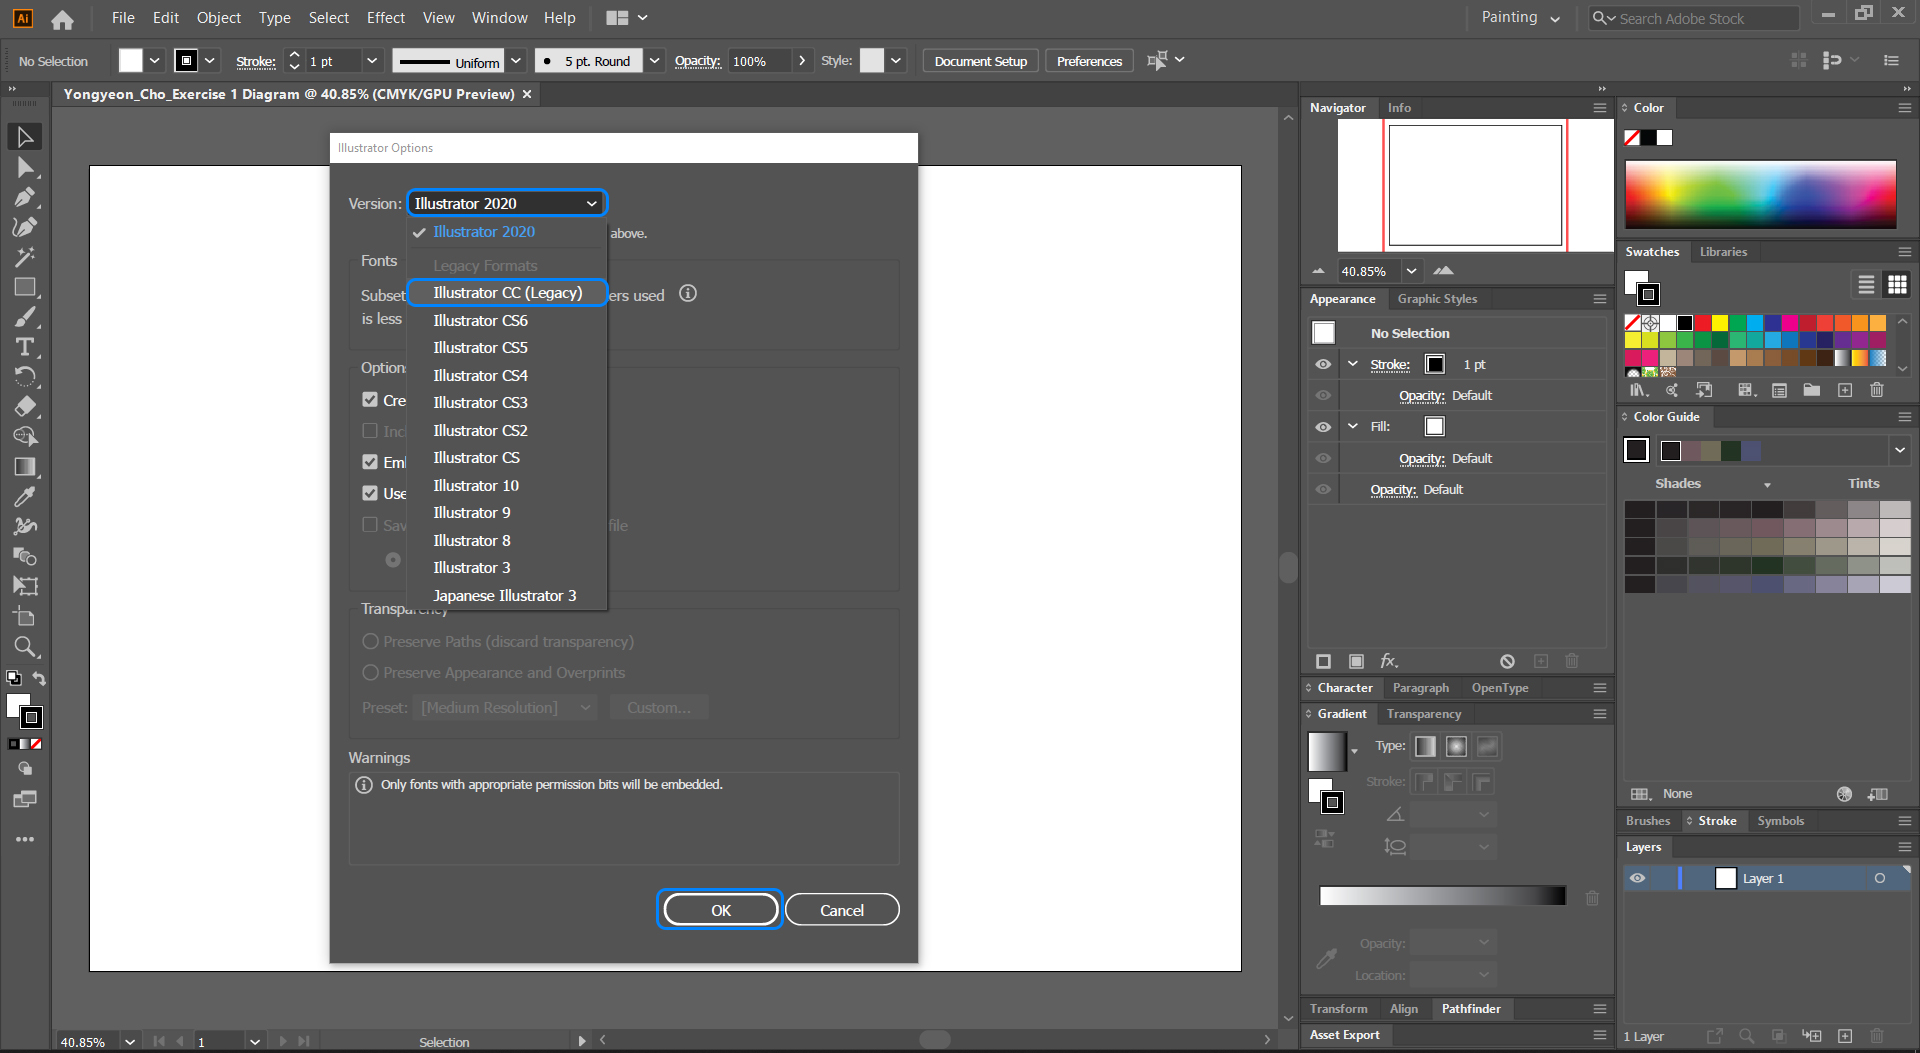
- [STEP 01] by clicking [FILE] > [SAVE] or, press [CTRL+S].
- [STEP 02] Find/create a project folder.
- [STEP 03] Click [SAVE].
- [STEP 04] Change the version to Illustrator CC by clicking the version.
- [STEP 05] Click [OK].
- [STEP 06] Click [OK] on the warning message.
Place a background image
- [STEP 01] For the exercise, you must download the image file and use it.
- [STEP 02] For your project, you can use a sketch file as a background image.
- [STEP 03] Click [FILE] > Click [PLACE] or, Press [SHIFT+CTRL+P].
- [STEP 04] Select an image file that you use as a guide for a diagram.
- [STEP 05] Click a place on the artboard.
- [STEP 06] Confirm you are using [SELECTION TOOL].
- [STEP 07] Adjust the scale by dragging and dropping the edge of the image. You may hold the [SHIFT] key to keep the image ratio. Or you can use [TRANSFORM PANEL] to adjust the size of the image. Or adjust the size on [CONTROL PANEL].
Image credit: Modified diagram based on a diagram from Pyo, M., & Kim, S. 2012 by Cho.
Adjust background image transparency and add new layers
- [STEP 01] Click the background image.
- [STEP 02] Adjust the value of Opacity to 30 from [CONTROL PANEL]. Or Click [TRANSPARENCY PANEL] to open the panel, and adjust the opacity value to 30%.
- [STEP 03] Double click the [LAYER 1] layer from [LAYERS PANEL]to update layer name [BACKGROUNDS].
Tip. Use a name that you can recognize better for the layer number. - [STEP 04] Click the [+] icon three times from [LAYERS PANEL] to add three new layers.
- [STEP 05] Adjust names for each new layers [DIAGRAMS], [ARROWS and ICONS], and [TEXTS].
- [STEP 06] Lock the [BACKGROUNDS] layer.
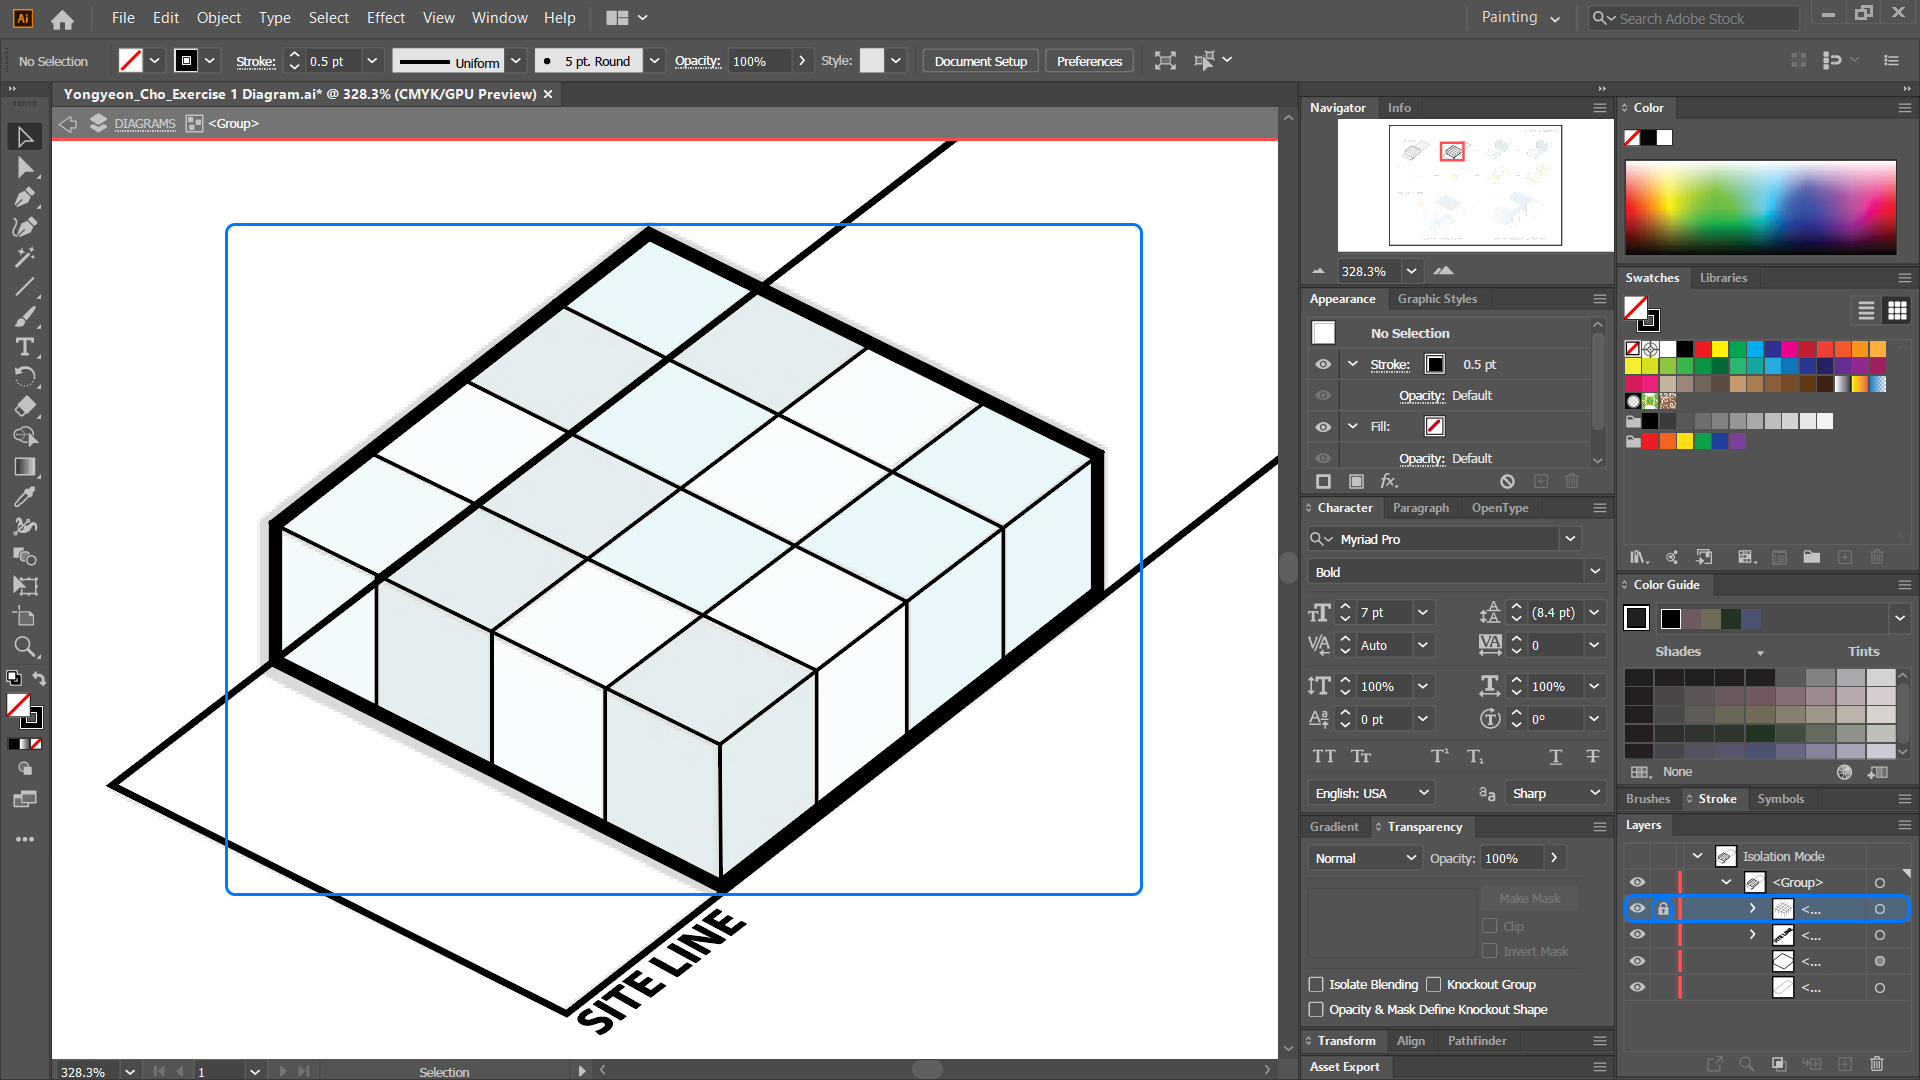
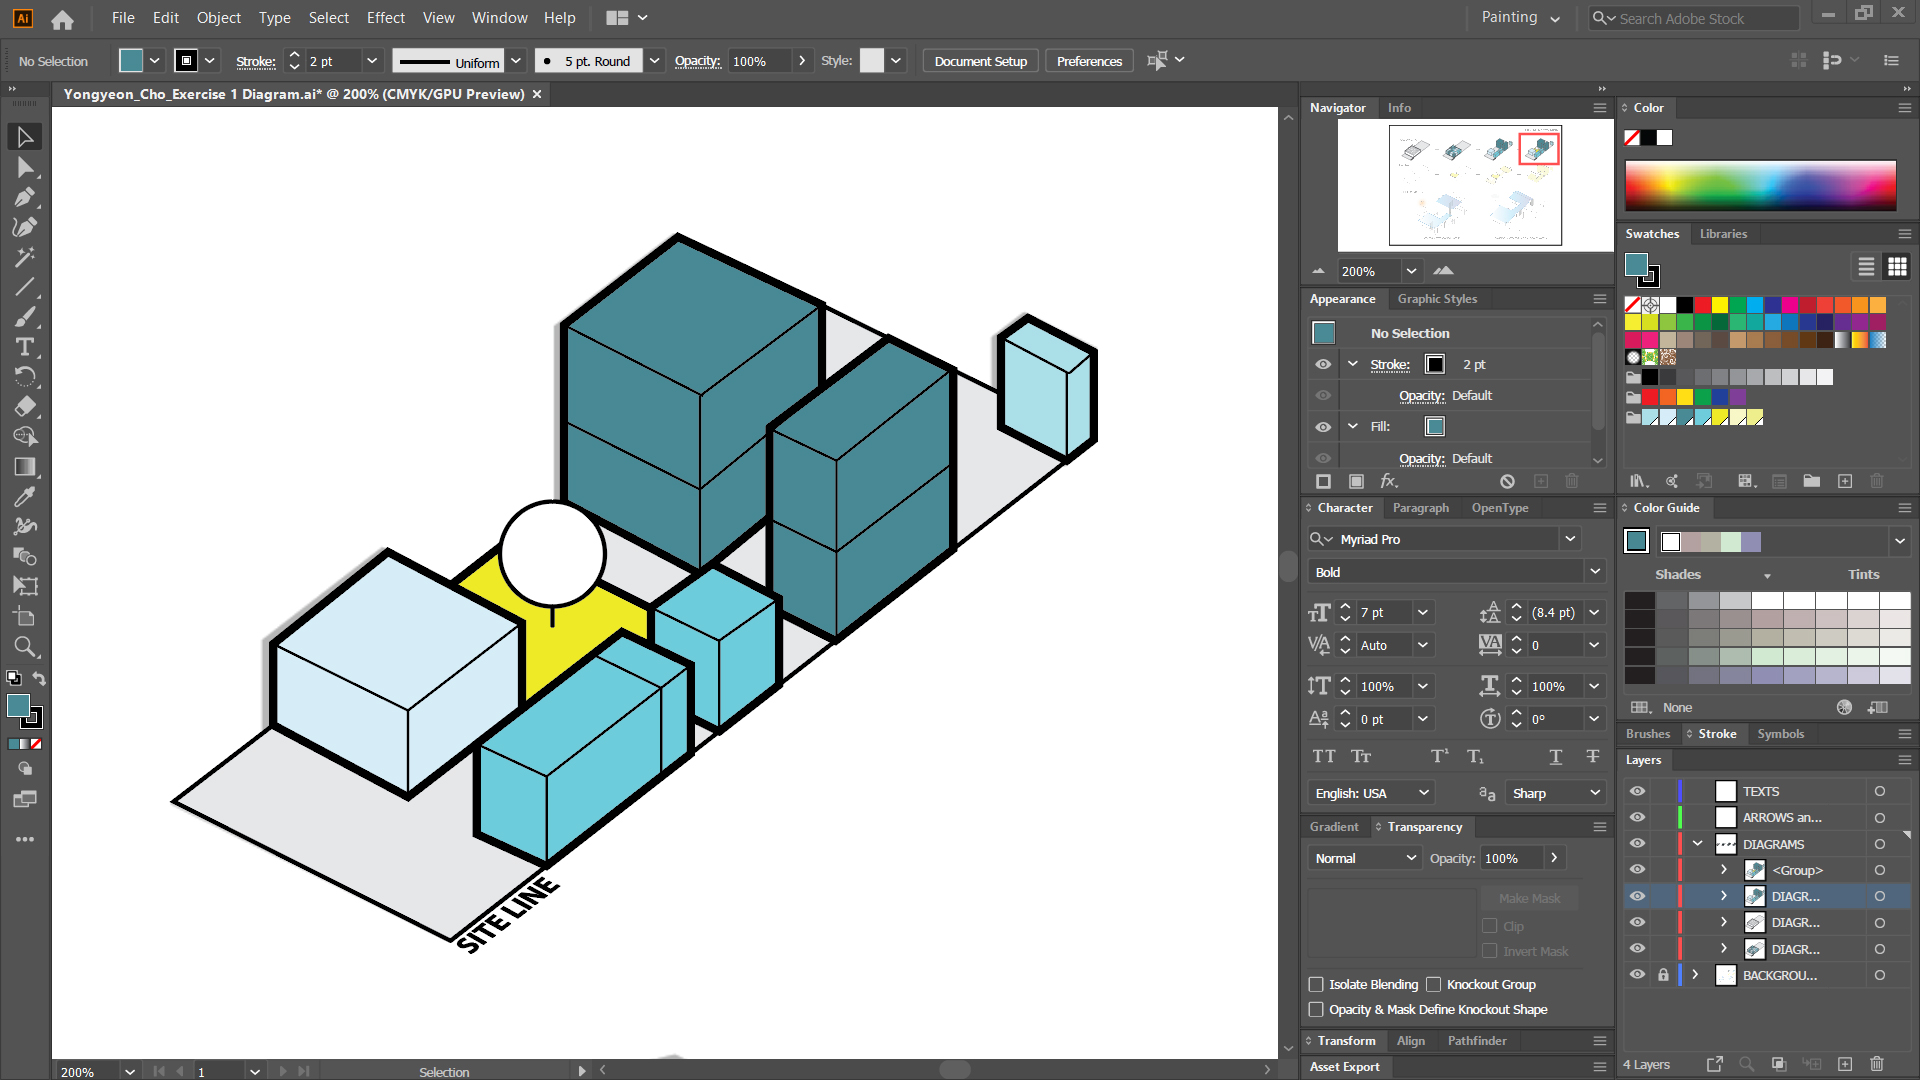
Draw the top-left corner diagram to start
- [STEP 01] Press [Z] to zoom in and out. Or you can press [CTRL+ +] to zoom in, press [CTRL + -] to zoom out.
- [STEP 02] Press [SPACE] key to handing the artboard.
- [STEP 03] Press [P] to use the [PEN] tool.
- [STEP 04] Confirm you selected the [DIAGRAMS] layer.
- [STEP 05] Start to draw the site line. If you want to use only lines without fill color, you must click the [FILL] and change the color to [NONE].
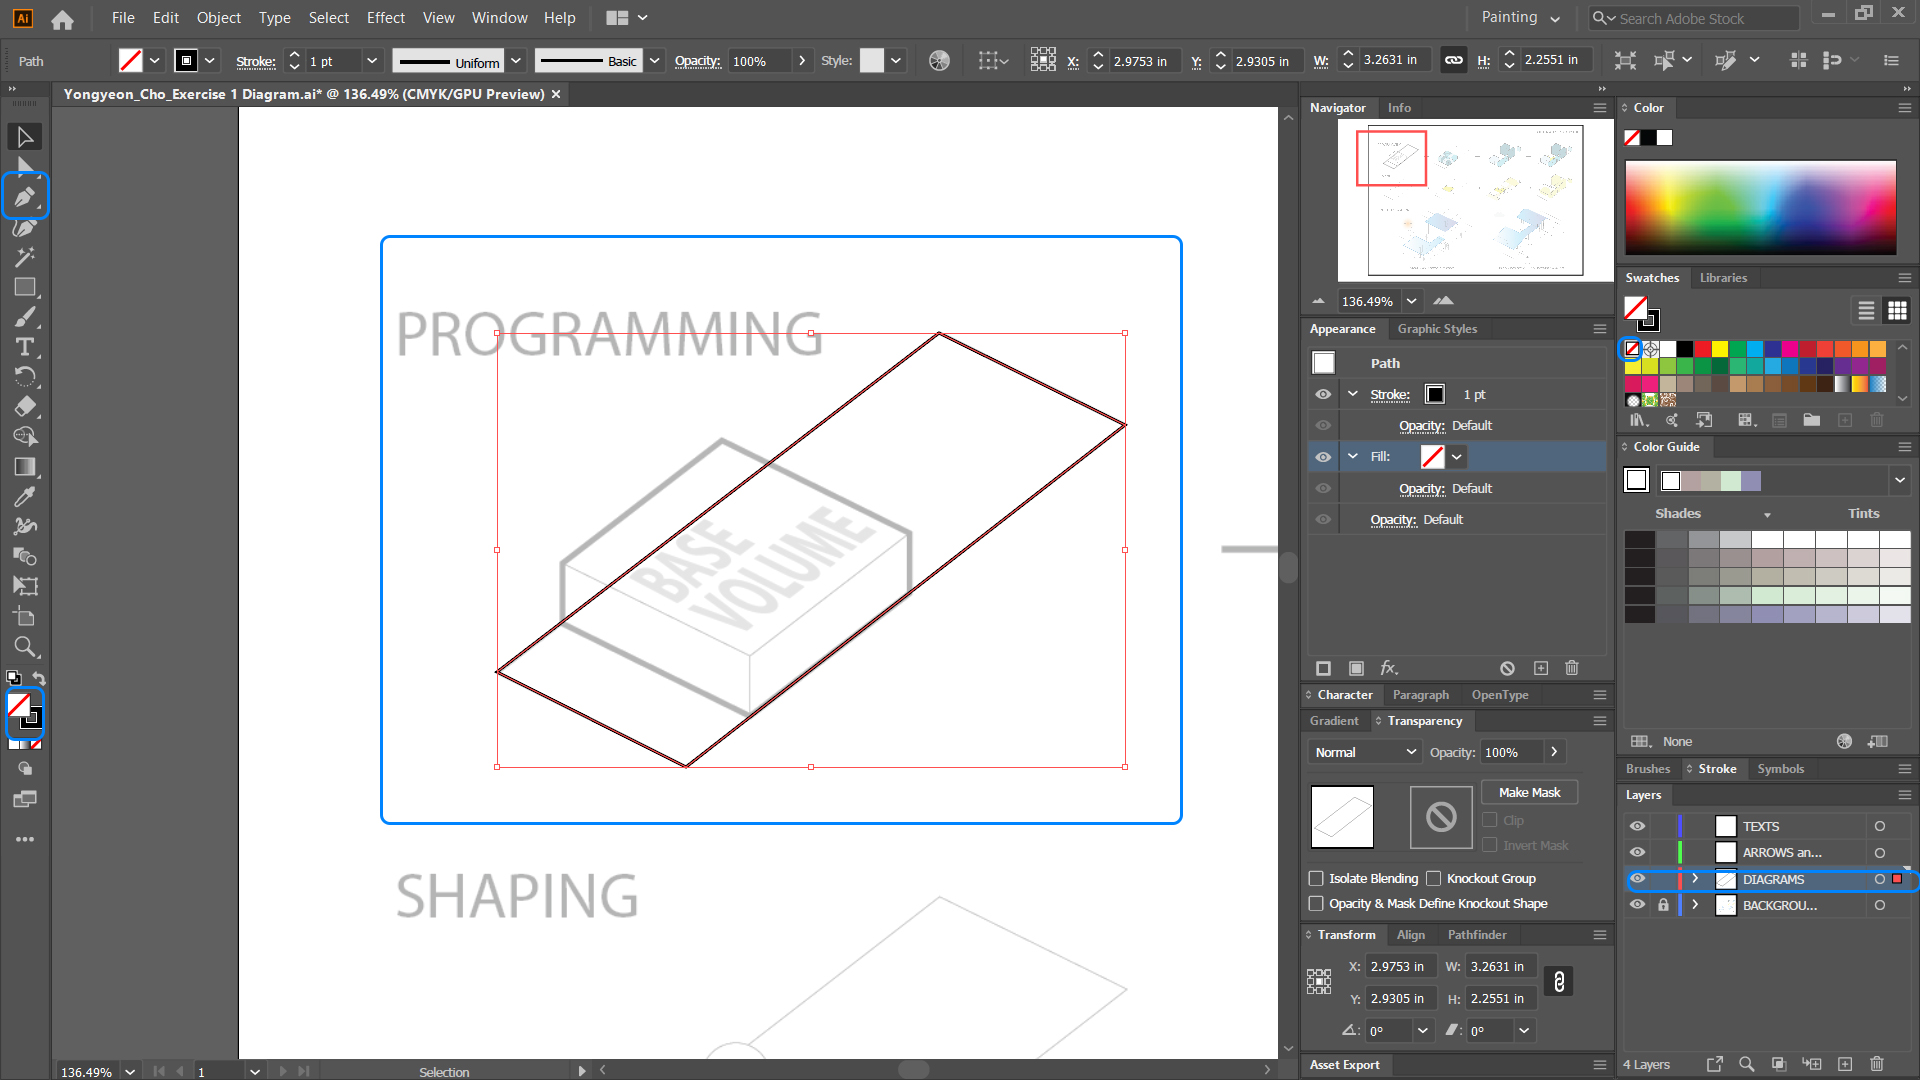
- [STEP 06] Draw the building base volume using the [PEN] tool.
Tip 1. Smart Guides [CTRL+U] is on by default. You will see the snaps while you draw, use the snap. Hold [SHIFT] key to draw 0, 45, 90-degree lines.
Tip 2. Illustrator is a drawing tool; this is not AutoCAD. That means they don’t need to be 100 % precise. Some artistic expression is allowable.
Suppose you want to draw with the isometric grid line. Please follow this step in the link. - [STEP 07] Click the object and click [STROKE] from the [CONTROL PANEL] to open [STROKE PANEL] to adjust the stroke thickness and align stroke.
Tip. You can open the [STROKE PANEL] from [APPEARANCE PANEL] or [STROKE PANEL] directly. - [STEP 08] Adjust the [WEIGHT] and [ALINE STROKE].
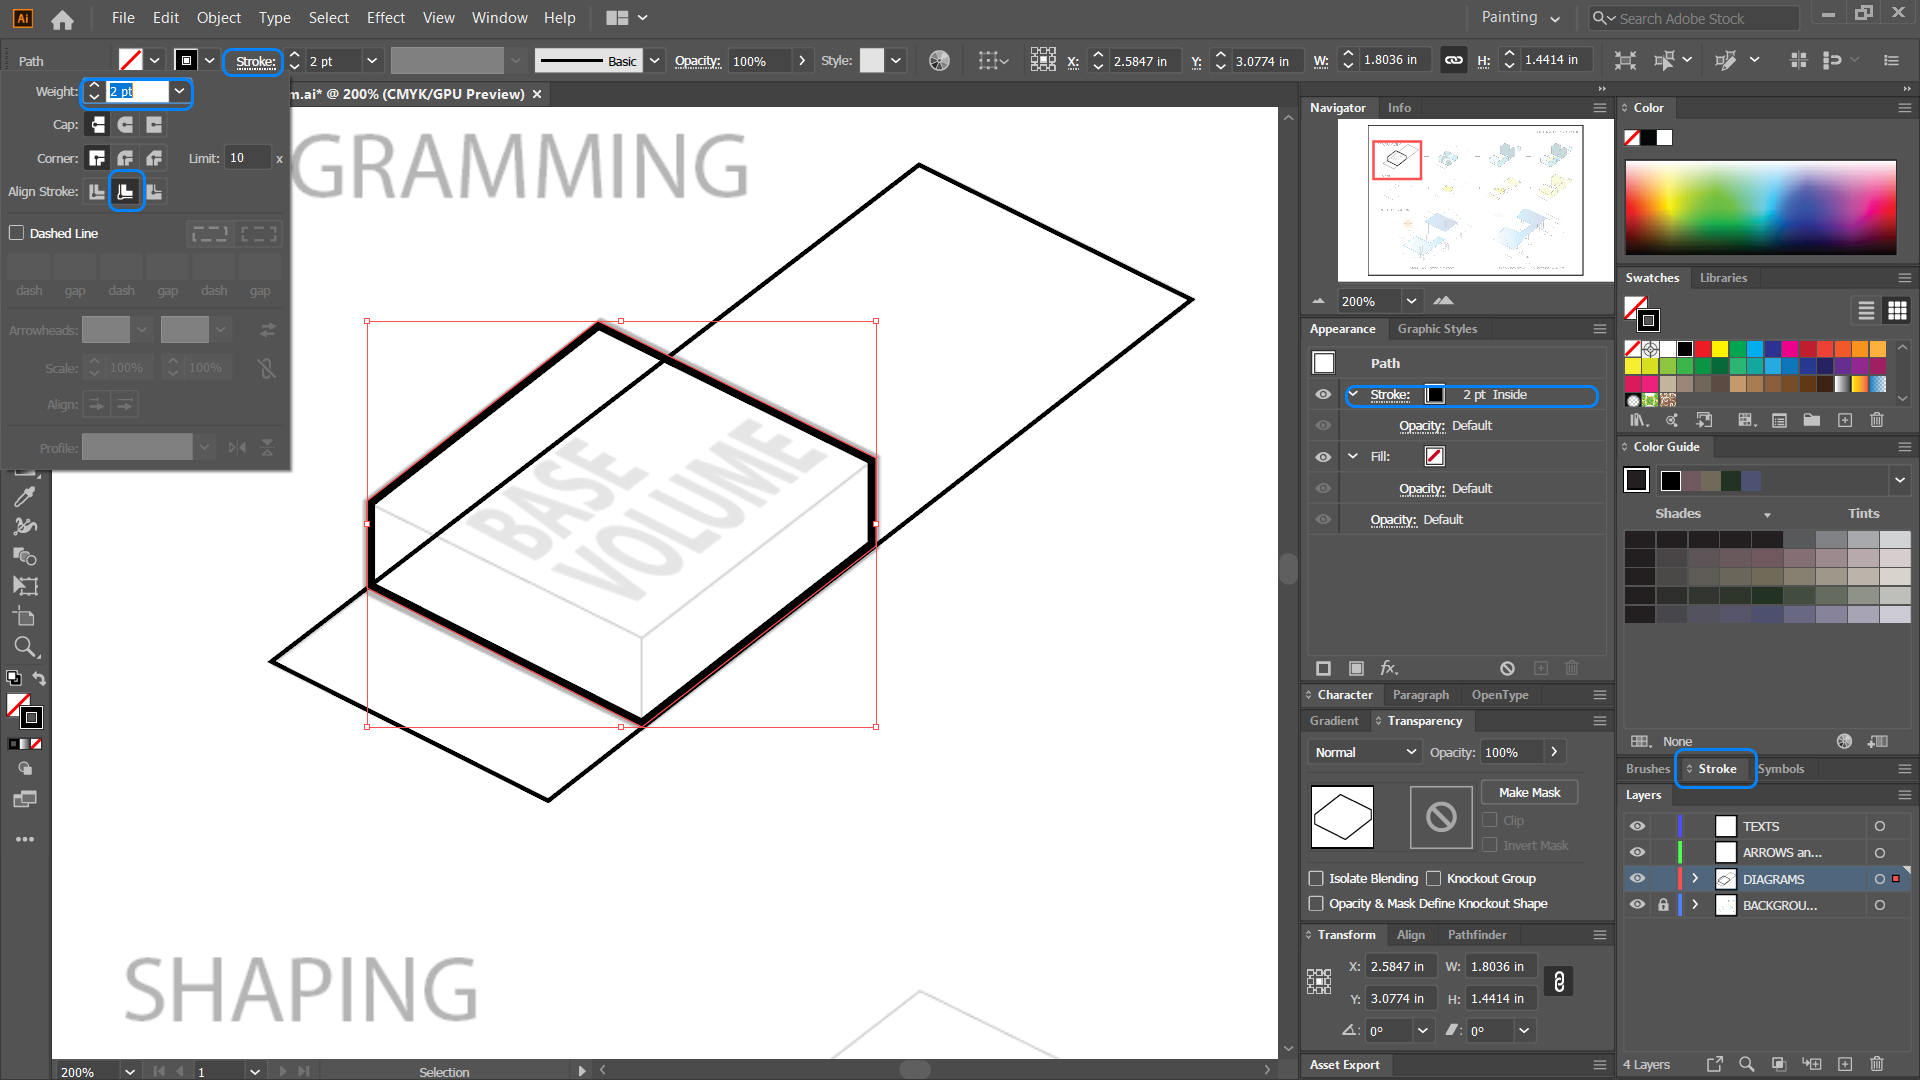
- [STEP 09] Draw the edge of the box using the [PEN TOOL]. You may also adjust [STROKE] as well.
Add angled texts
- [STEP 01] Click [TYPE TOOL] or press [T].
- [STEP 02] Draw and drop to add a text box.
Tip. When you create a text box, be careful with the cursor icon changes. If you want to draw a path/object as a text box, you need to click the path/object. Otherwise, you need to draw and drop in an empty area. - [STEP 03] In the text box, some placeholder will automatically fill. You need to delete the placeholders and add your text.
- [STEP 04] Edit the font, size, leadings, and more.
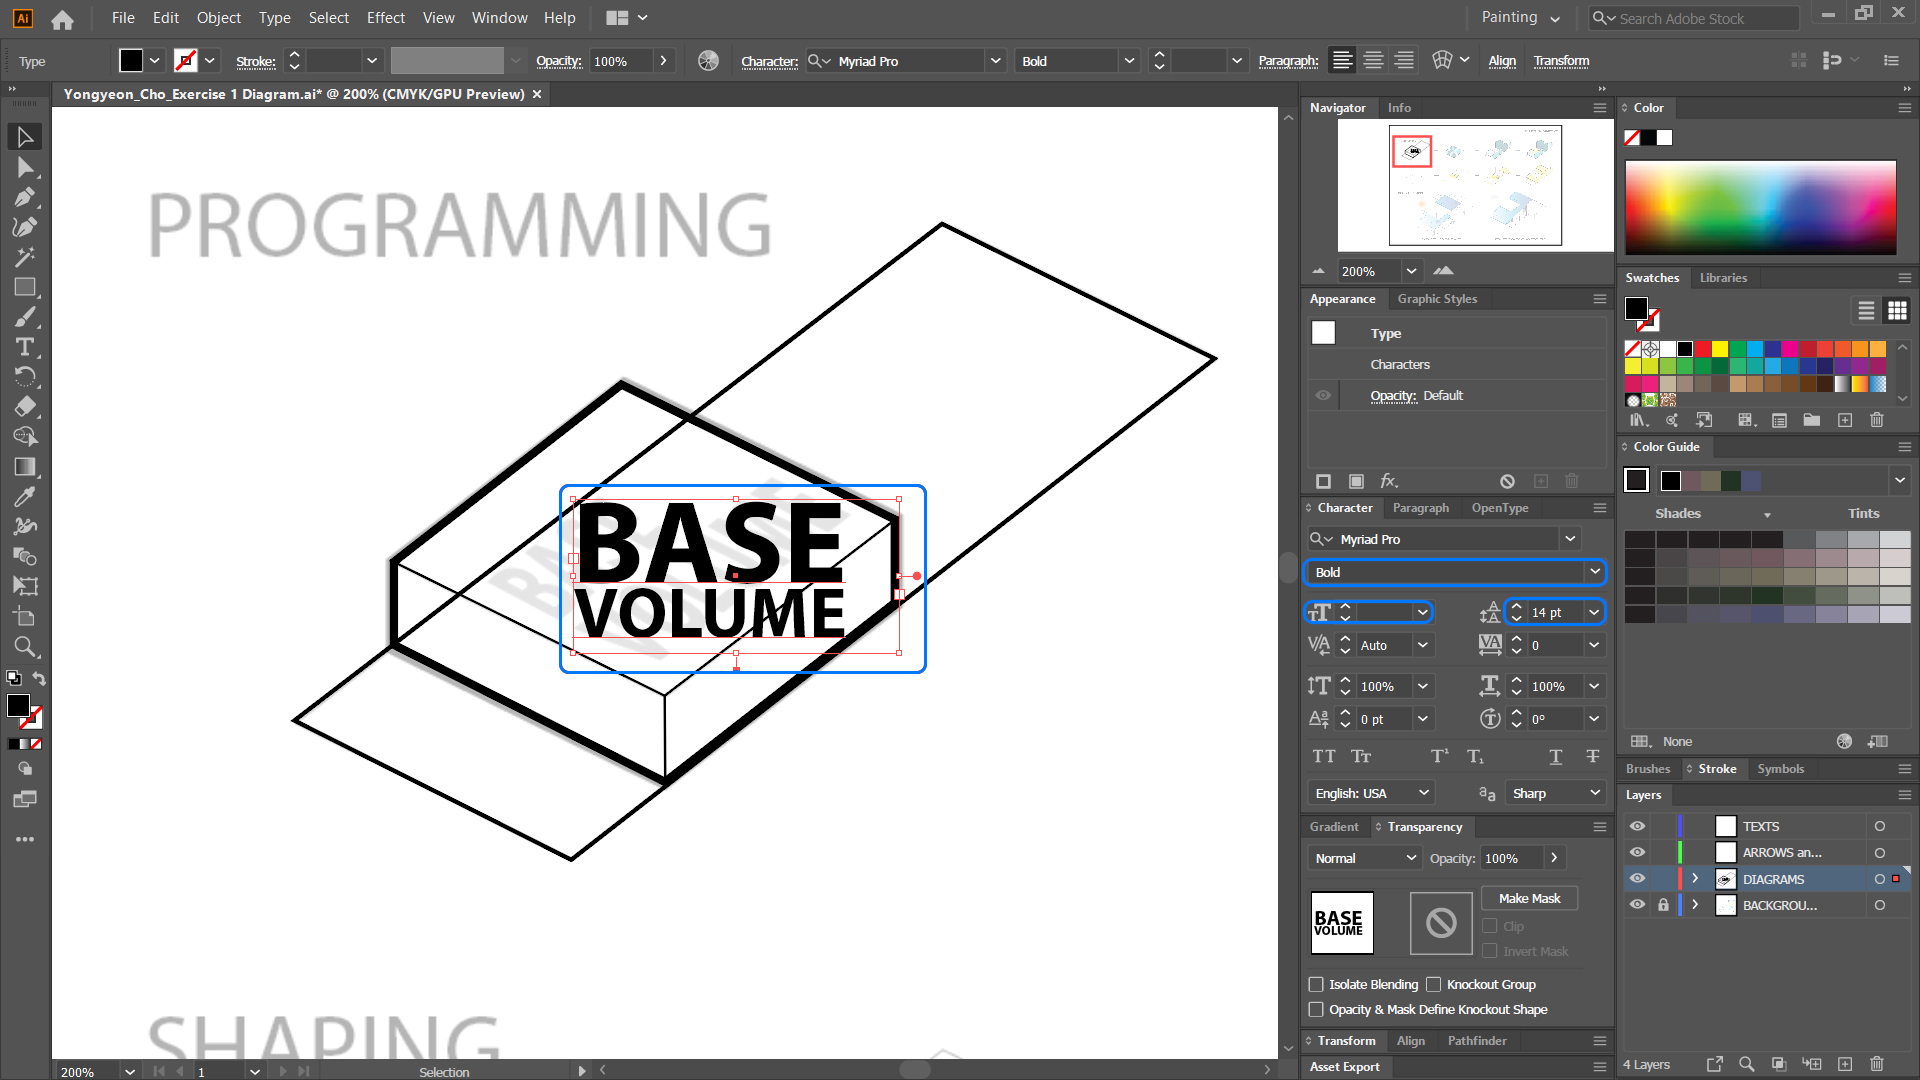
- [STEP 05] Mouse right-click on the text box.
- [STEP 06] Click [CREATE OUTLINES] to break the texts.
Tip. If you skip this [CREATE OUTLINE] process, [FREE DISTORT] will not be applied. - [STEP 07] Click [FREE TRANSFORM TOOL] and click [FREE DISTORT].
- [STEP 08] Drag and drop the corner of the selected text box to create angled text.
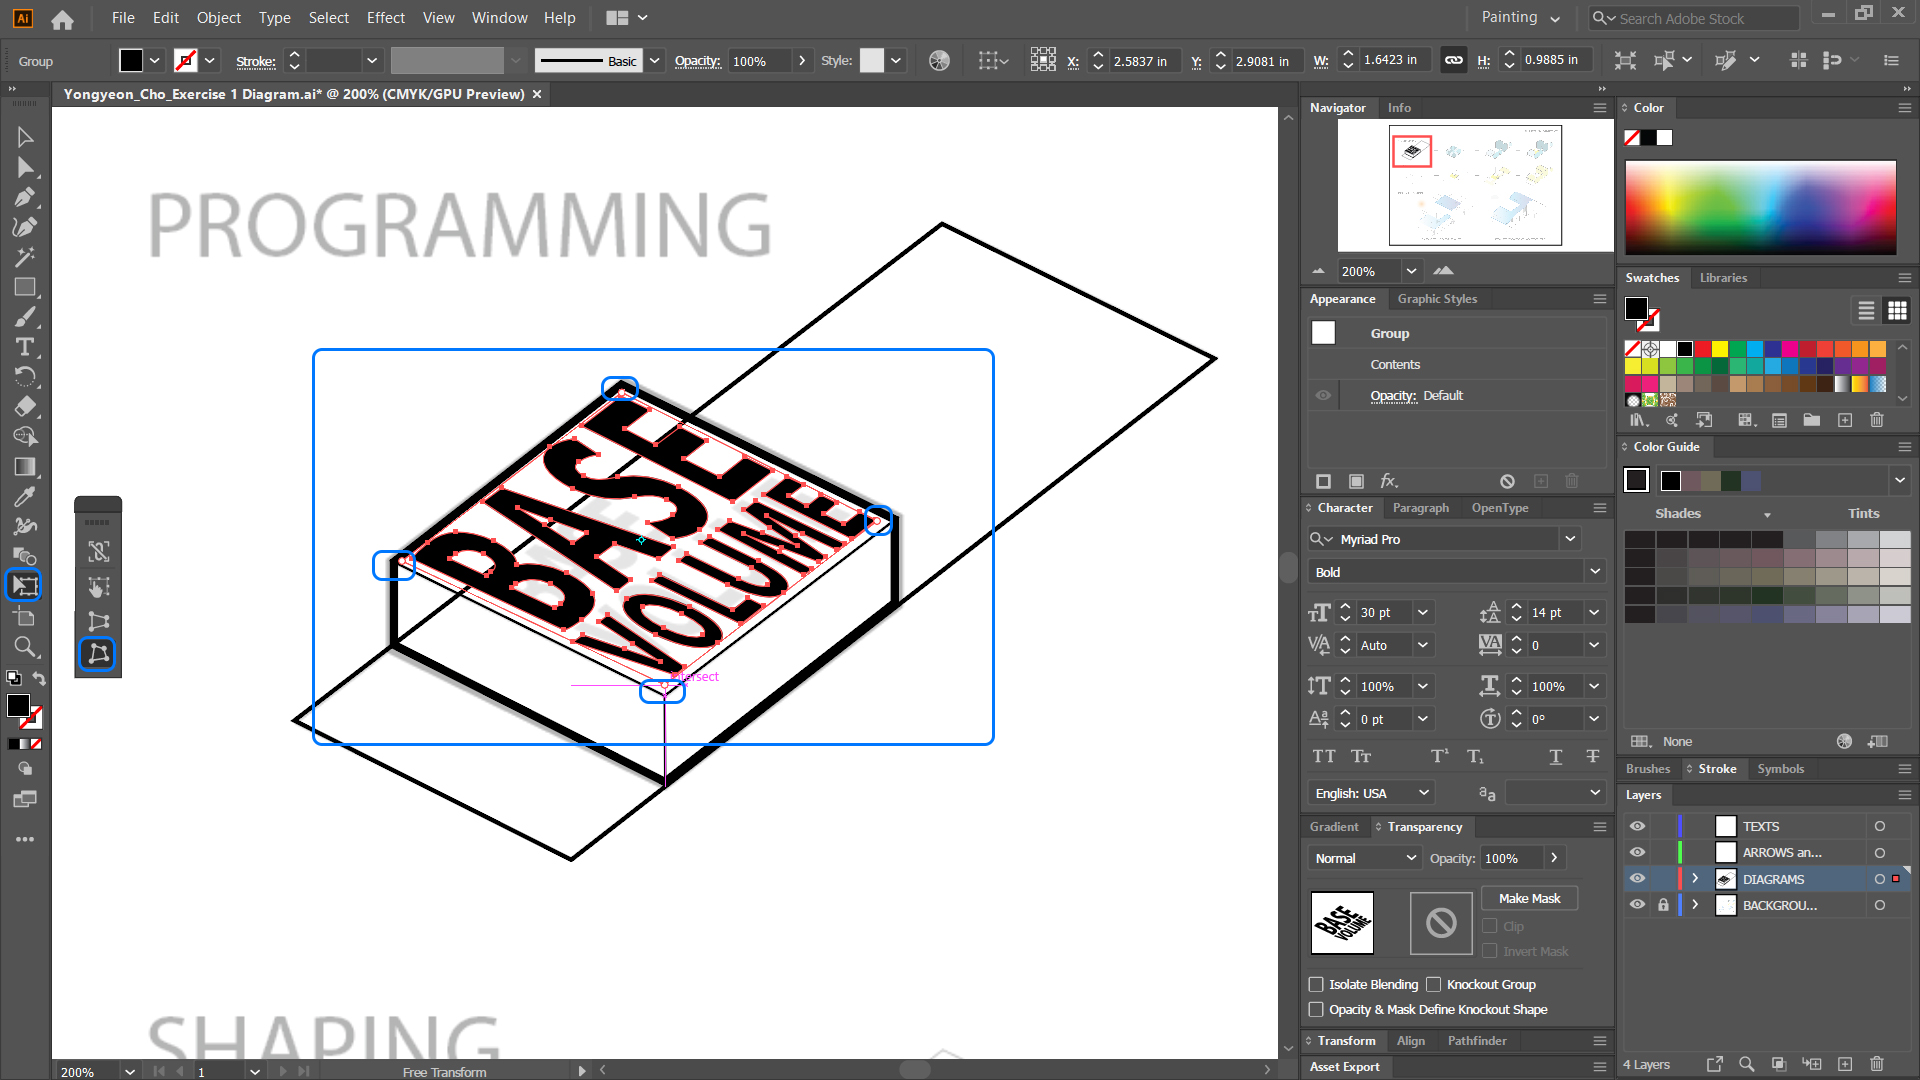
- [STEP 09] Adjust the text color/transparency/effect.
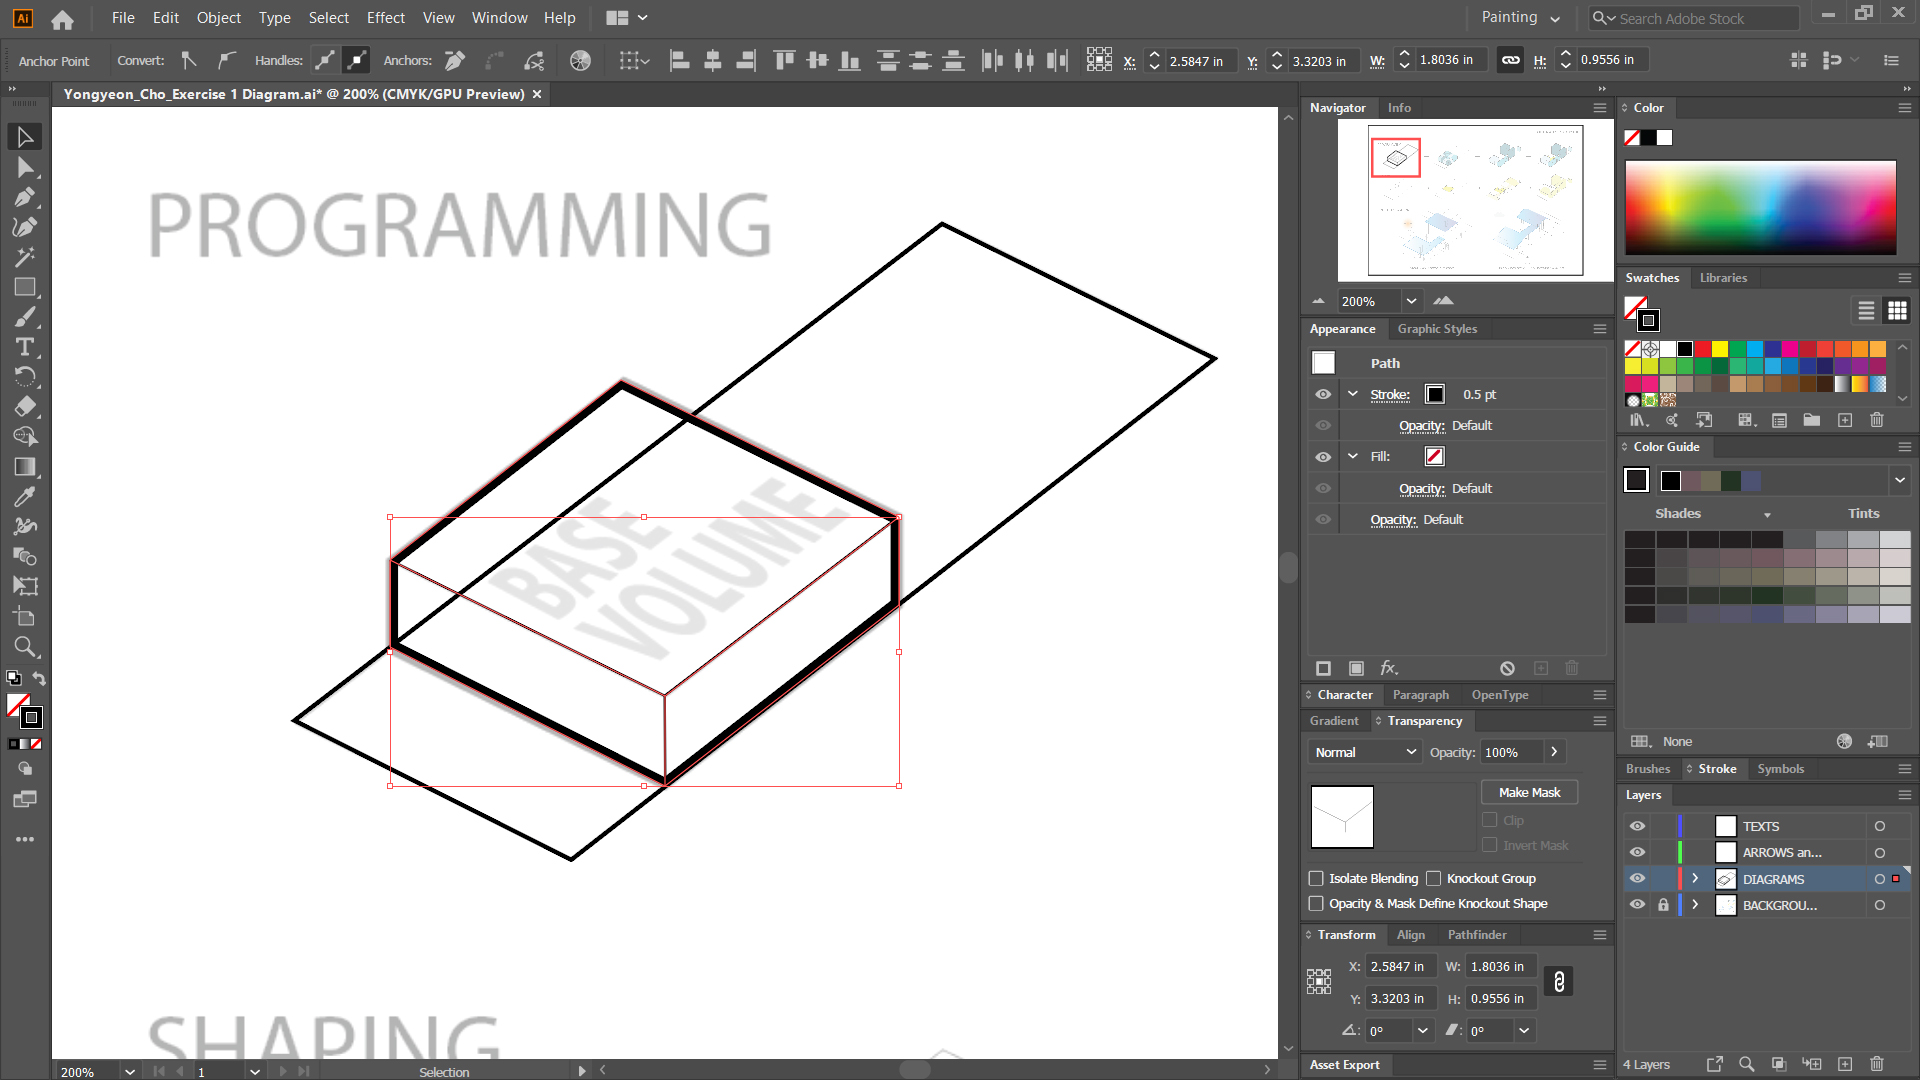
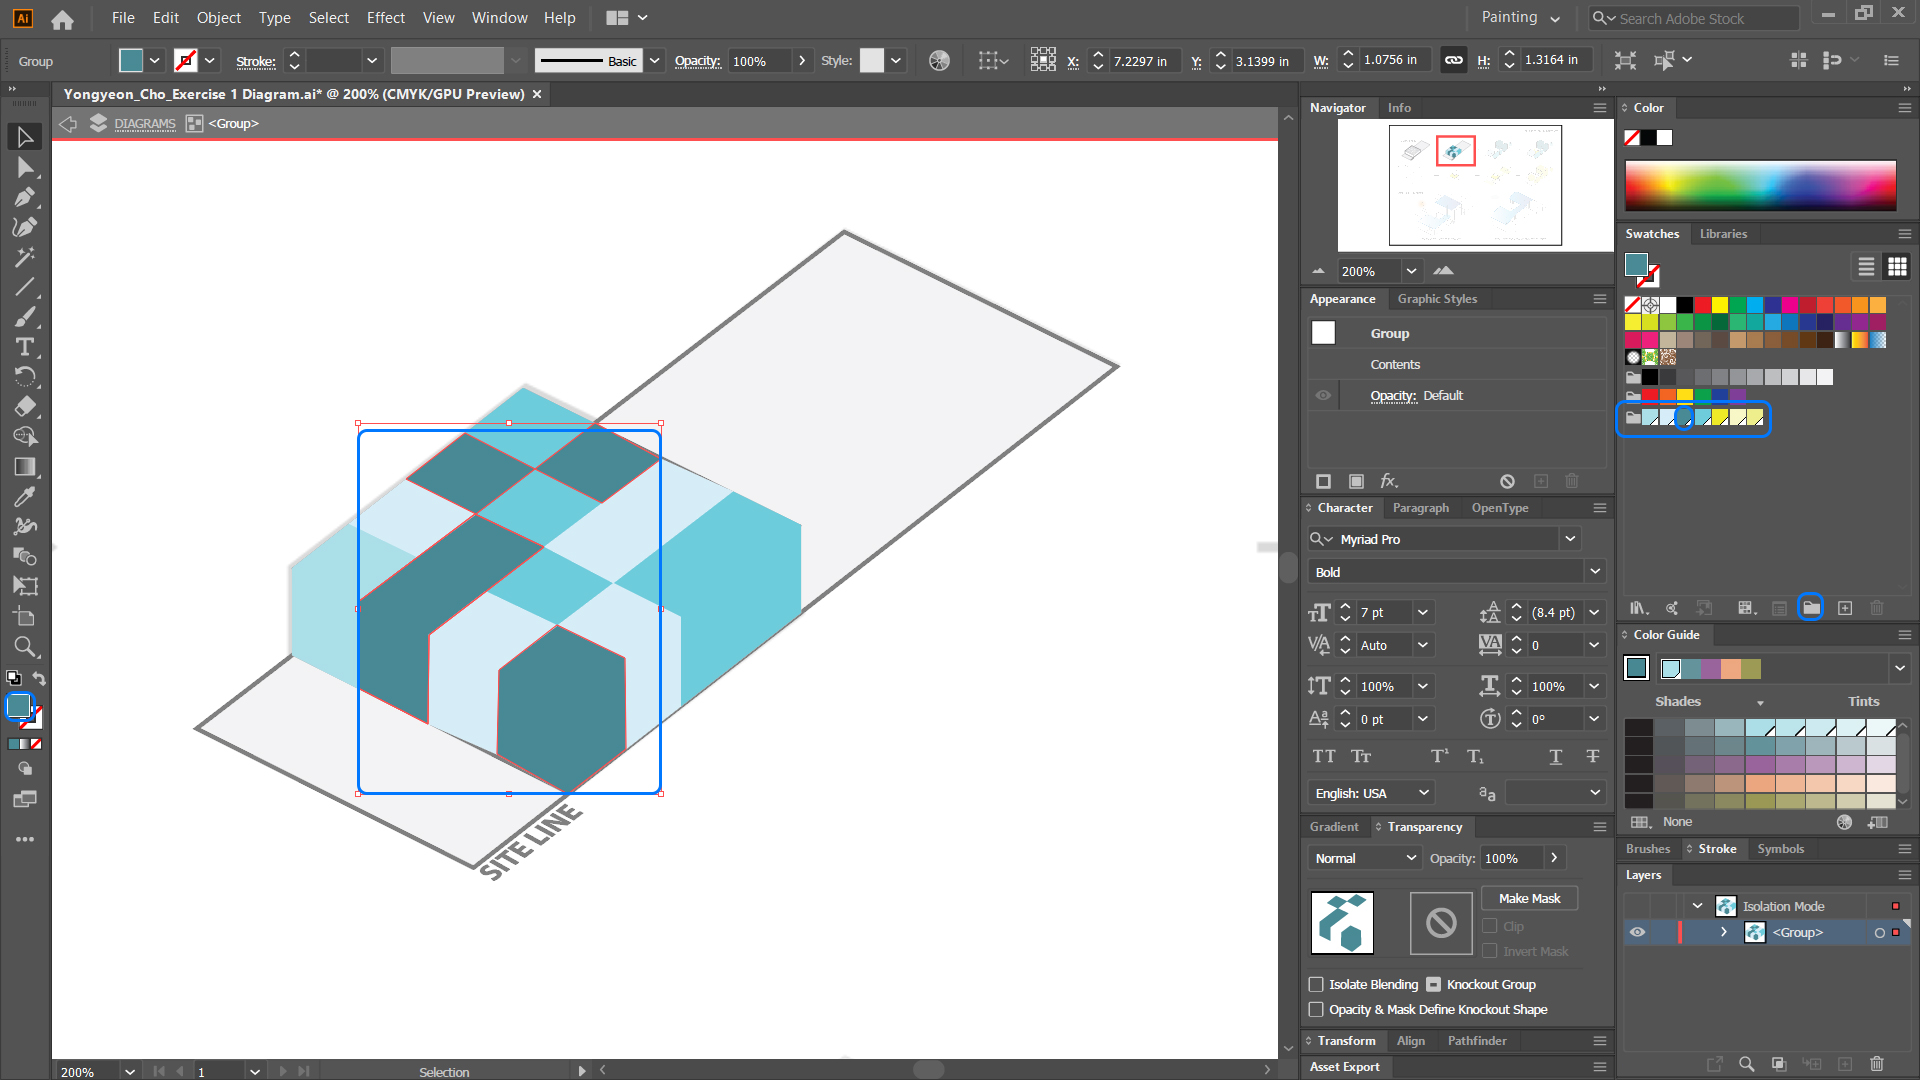
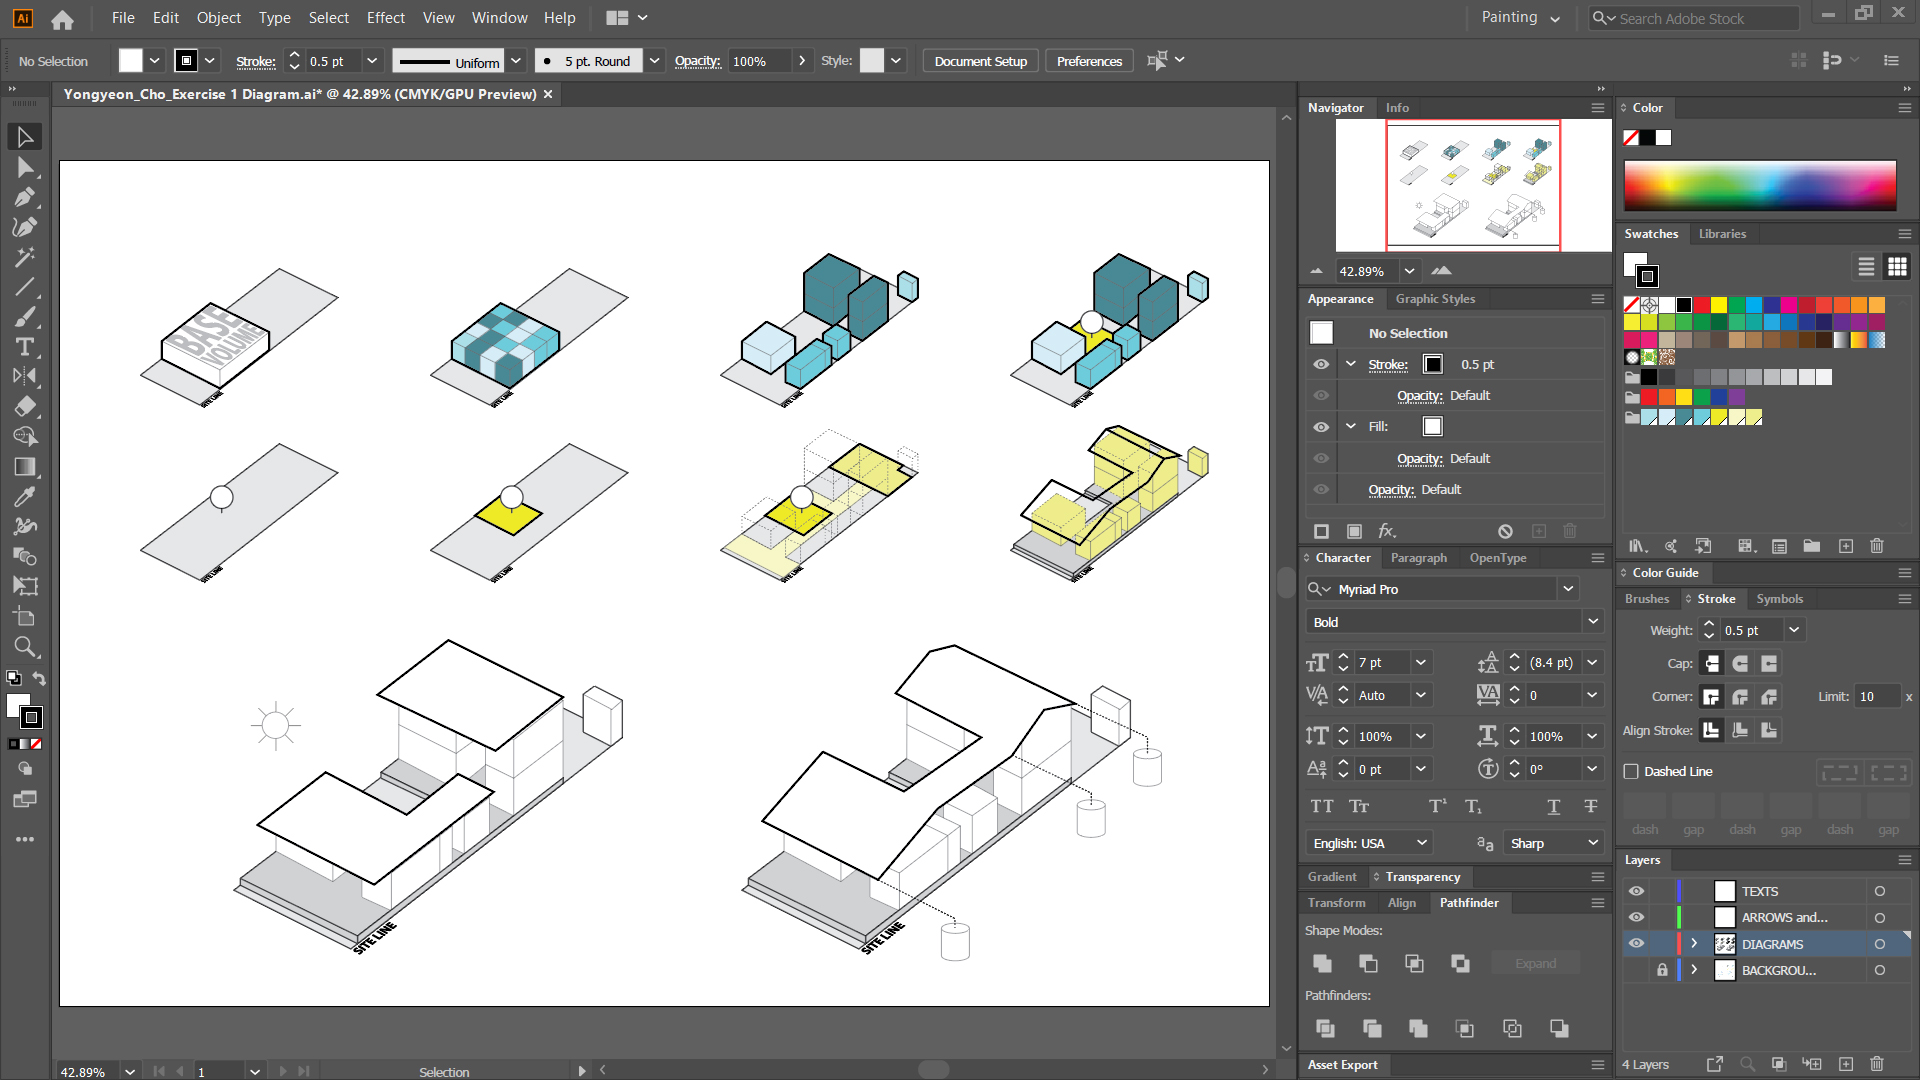
Finishing up the first diagram
- [STEP 01] Adjust the building volume fill color to hide the site line.
- [STEP 02] Adjust the site line color to indicate the volume of the site.
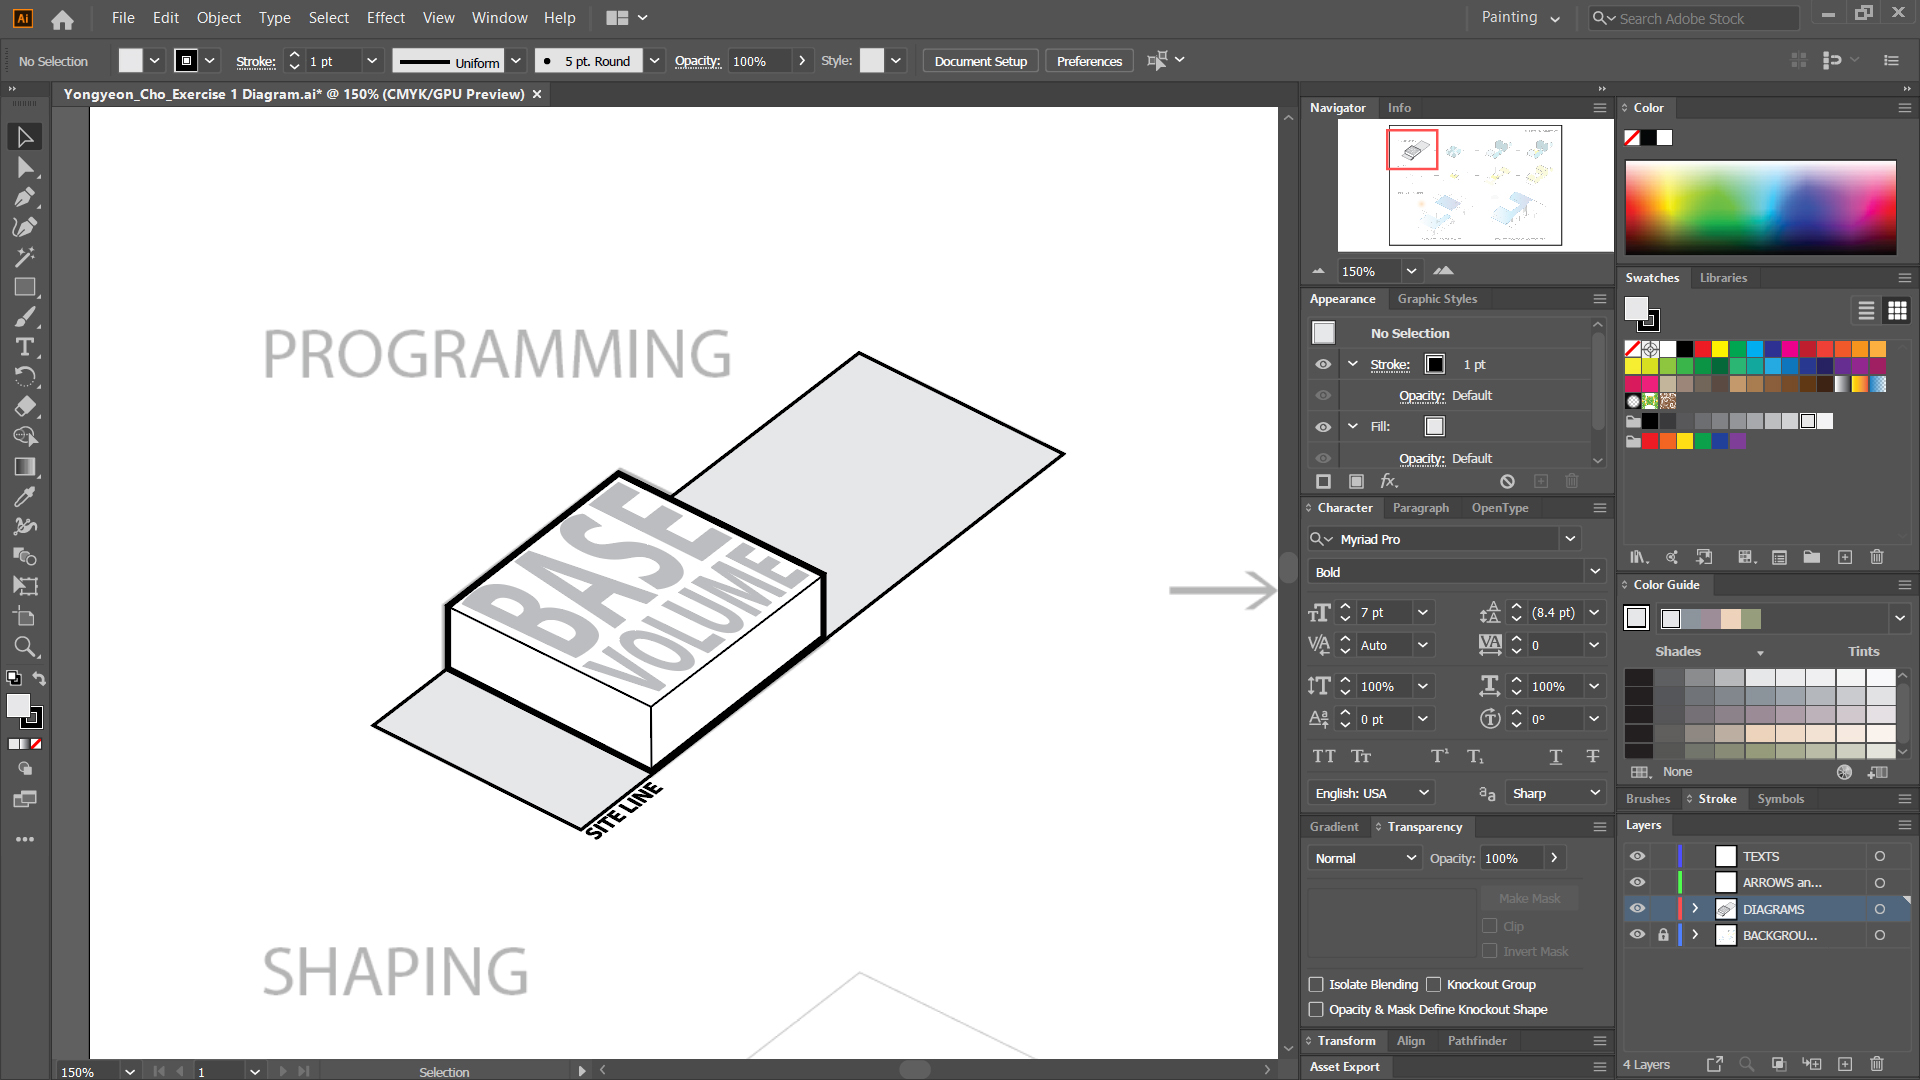
Note. For the exercise, you can add/develop the diagram that you are given. DESIGNERS!!
Ready to make the second diagram
- [STEP 01] Select the first diagram > Mouse right-click > Select [GROUP].
- [STEP 02] Hold [ALT] key > Drag and drop the first diagram to the second diagram location.
- [STEP 03] Select the copied second diagram > Mouse right-click > Select [UNGROUP].
- [STEP 04] Remove and edit to create the second diagram.
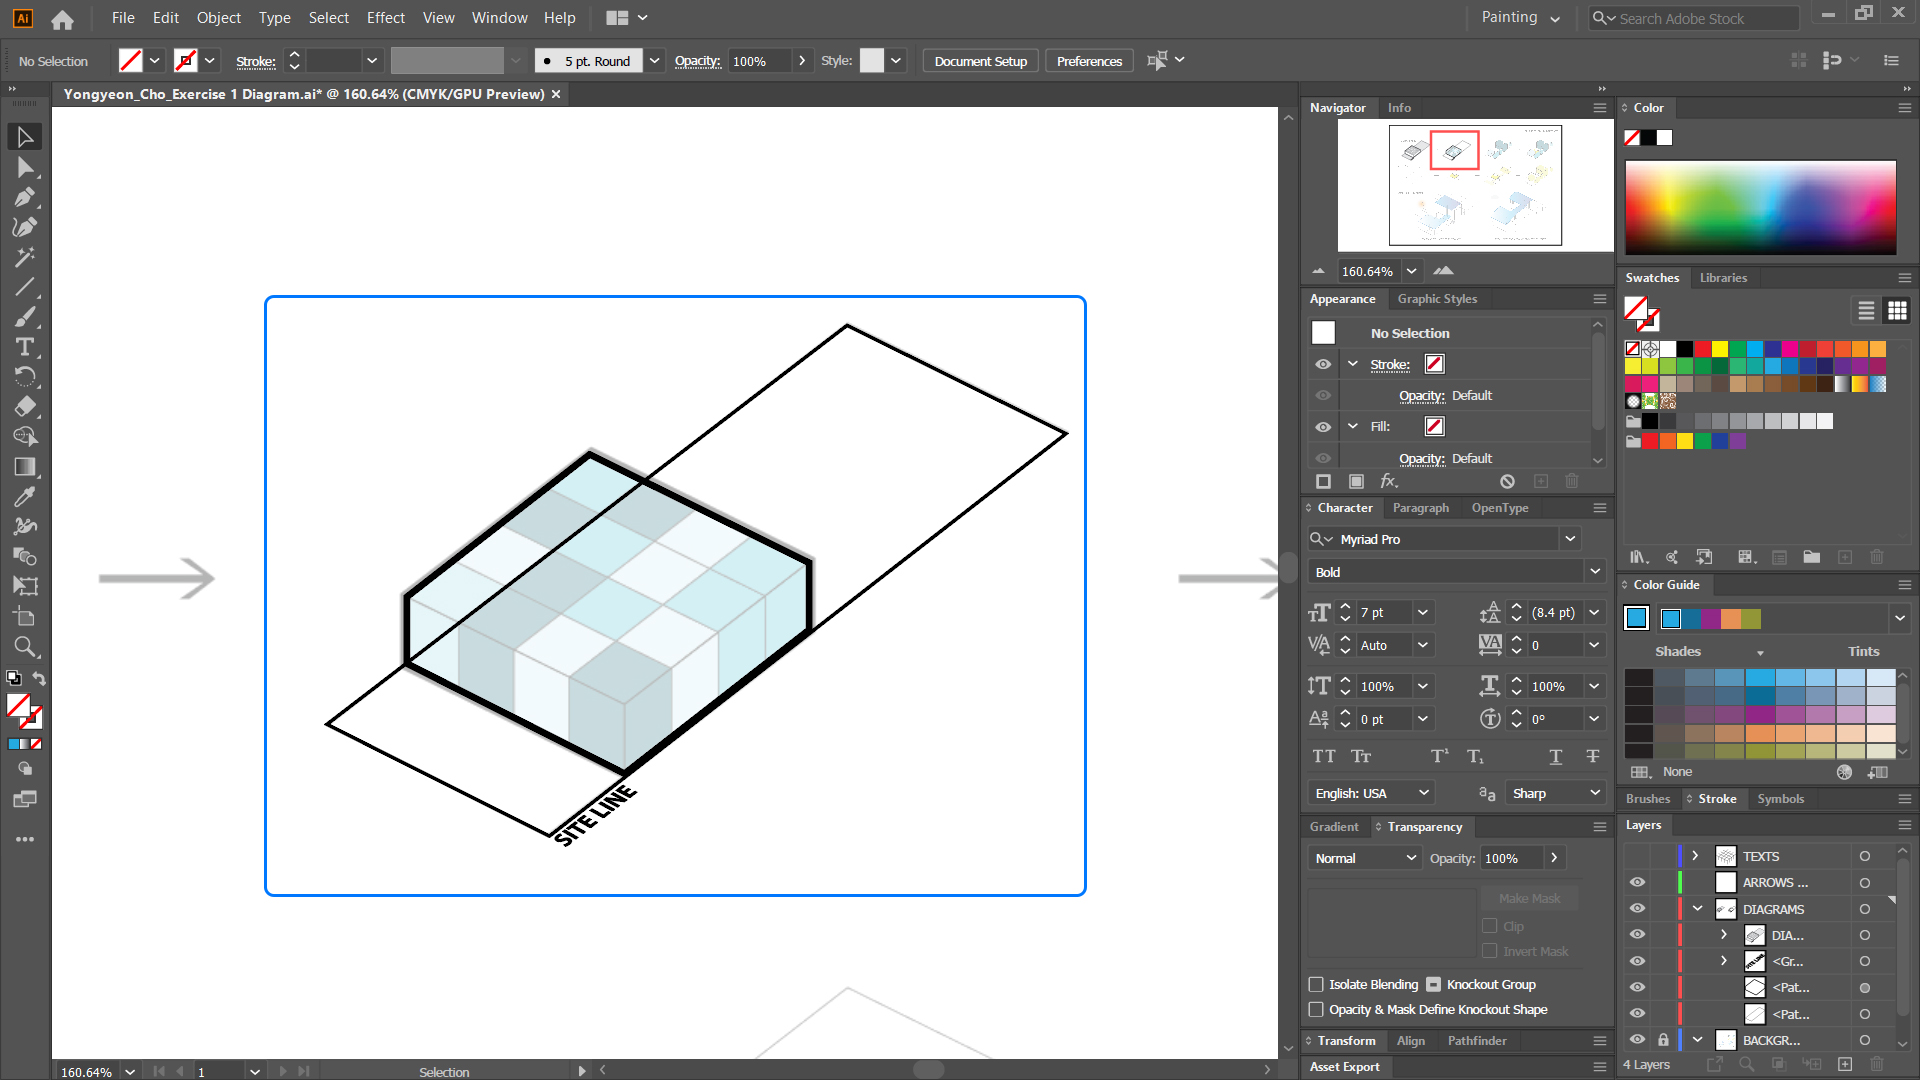
Draw lines and fill colors
- [STEP 01] Select the group > Mouse right-click > Click [ARRANGE] > Click [SEND BACKWARD] Or Select the group > Press [CTRL+[ ].
- [STEP 02] Select [LINE SEGMENT TOOL].
- [STEP 03] Draw lines to set the guide the color fill.
- [STEP 04] Select the lines that you draw by using [SELECTION TOOL].
- [STEP 05] Make a group by pressing [CTRL+G] to prevent any accidental selection while using [PEN TOOL].
- [STEP 06] And lock the line group by clicking the grouped line group from [LAYERS PANEL].
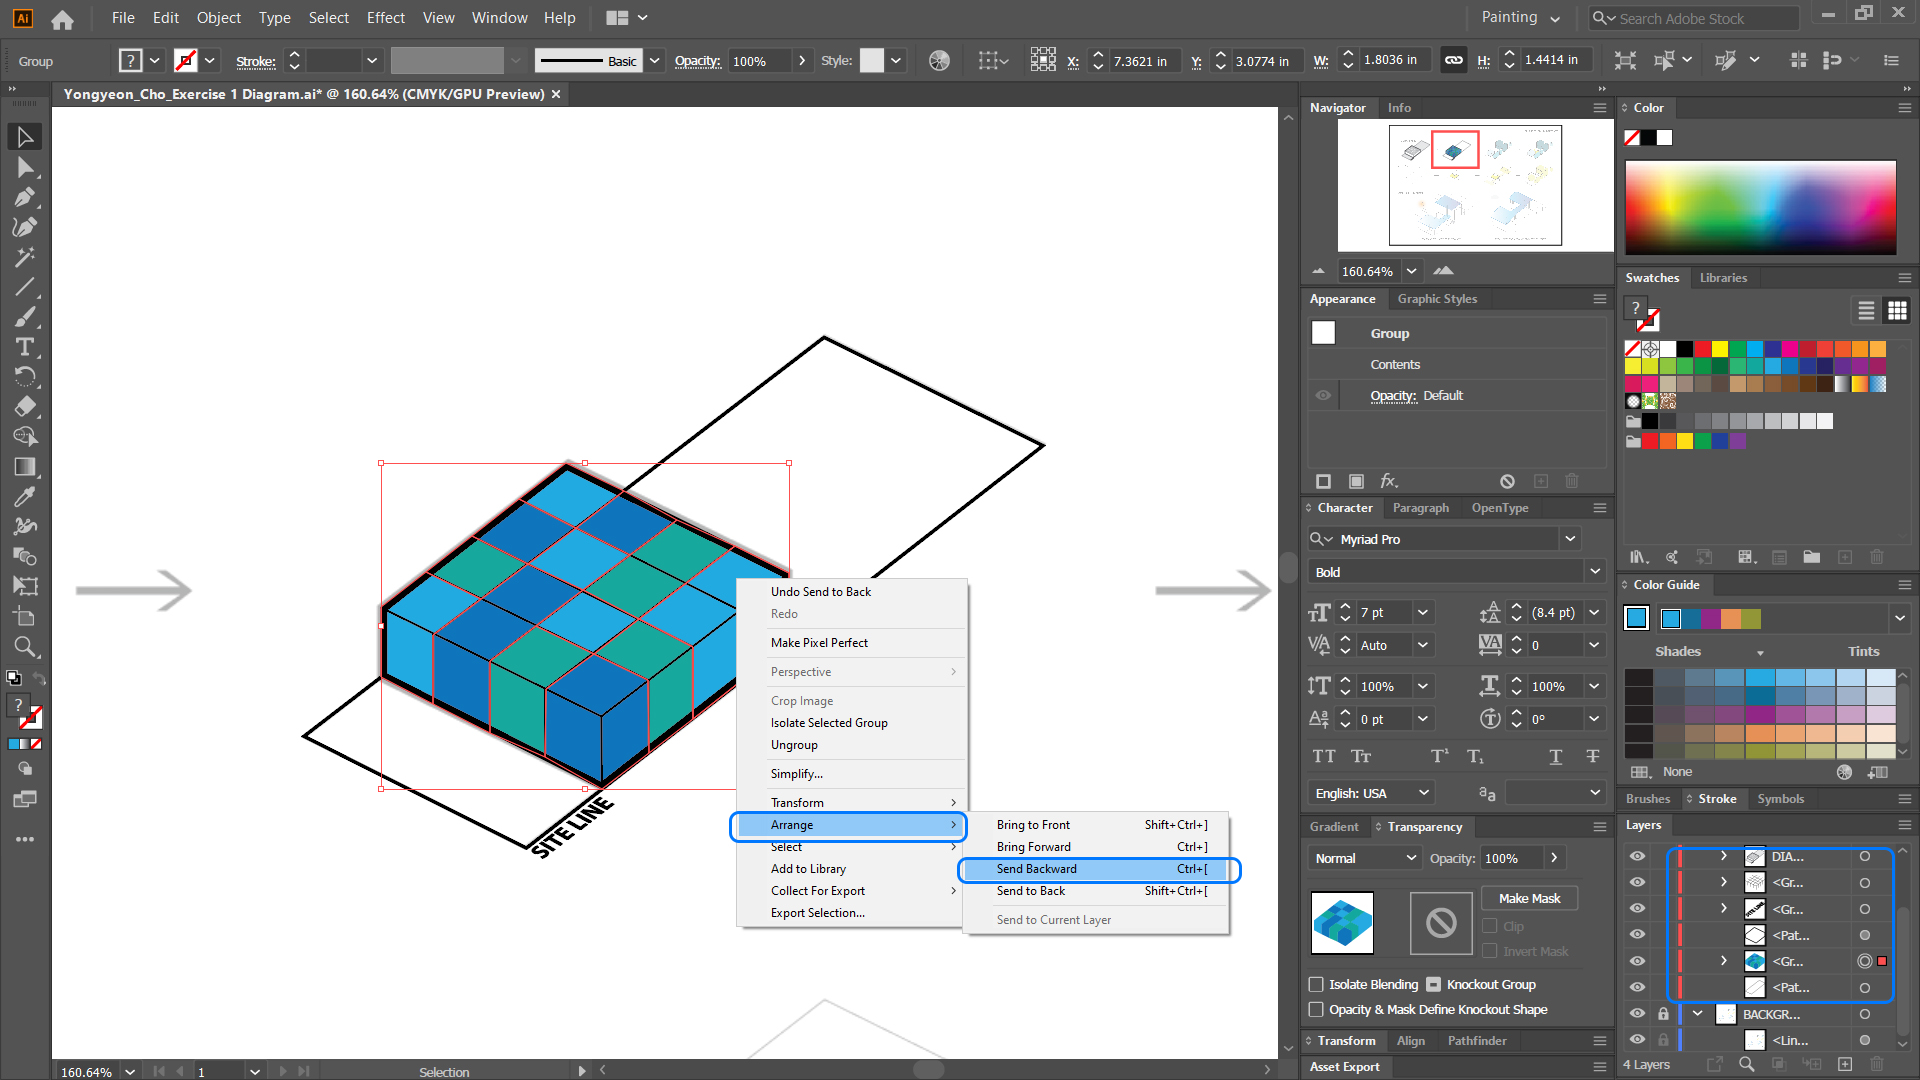
- [STEP 07] Select [PEN TOOL] to draw the color-filled area.
- [STEP 08] Draw color-filled objects individually. And adjust colors.
Tip 1. If you want to make the object line precisely, use outline mode by pressing [CTRL+Y]. It will allow us to see only outlines: no color fill, no stroke. To exit the outline mode, press [CTRL+Y] again.
Tip 2. Also use [DIRECT SELECTION TOOL], shortcut [A] to adjust the anchor points. - [STEP 09] Make groups by color of the objects.
- [STEP 10] Make a group the groups.
- [STEP 11] Change the order of the group.
Tip. Please see the [LAYERS PANEL] to see the drawing orders.
Changing color with using Swatches and Library
- [STEP 01] Previously you used the default swatches. You can select color by double-clicking Fill color and pick a color from [COLOR PICKER].
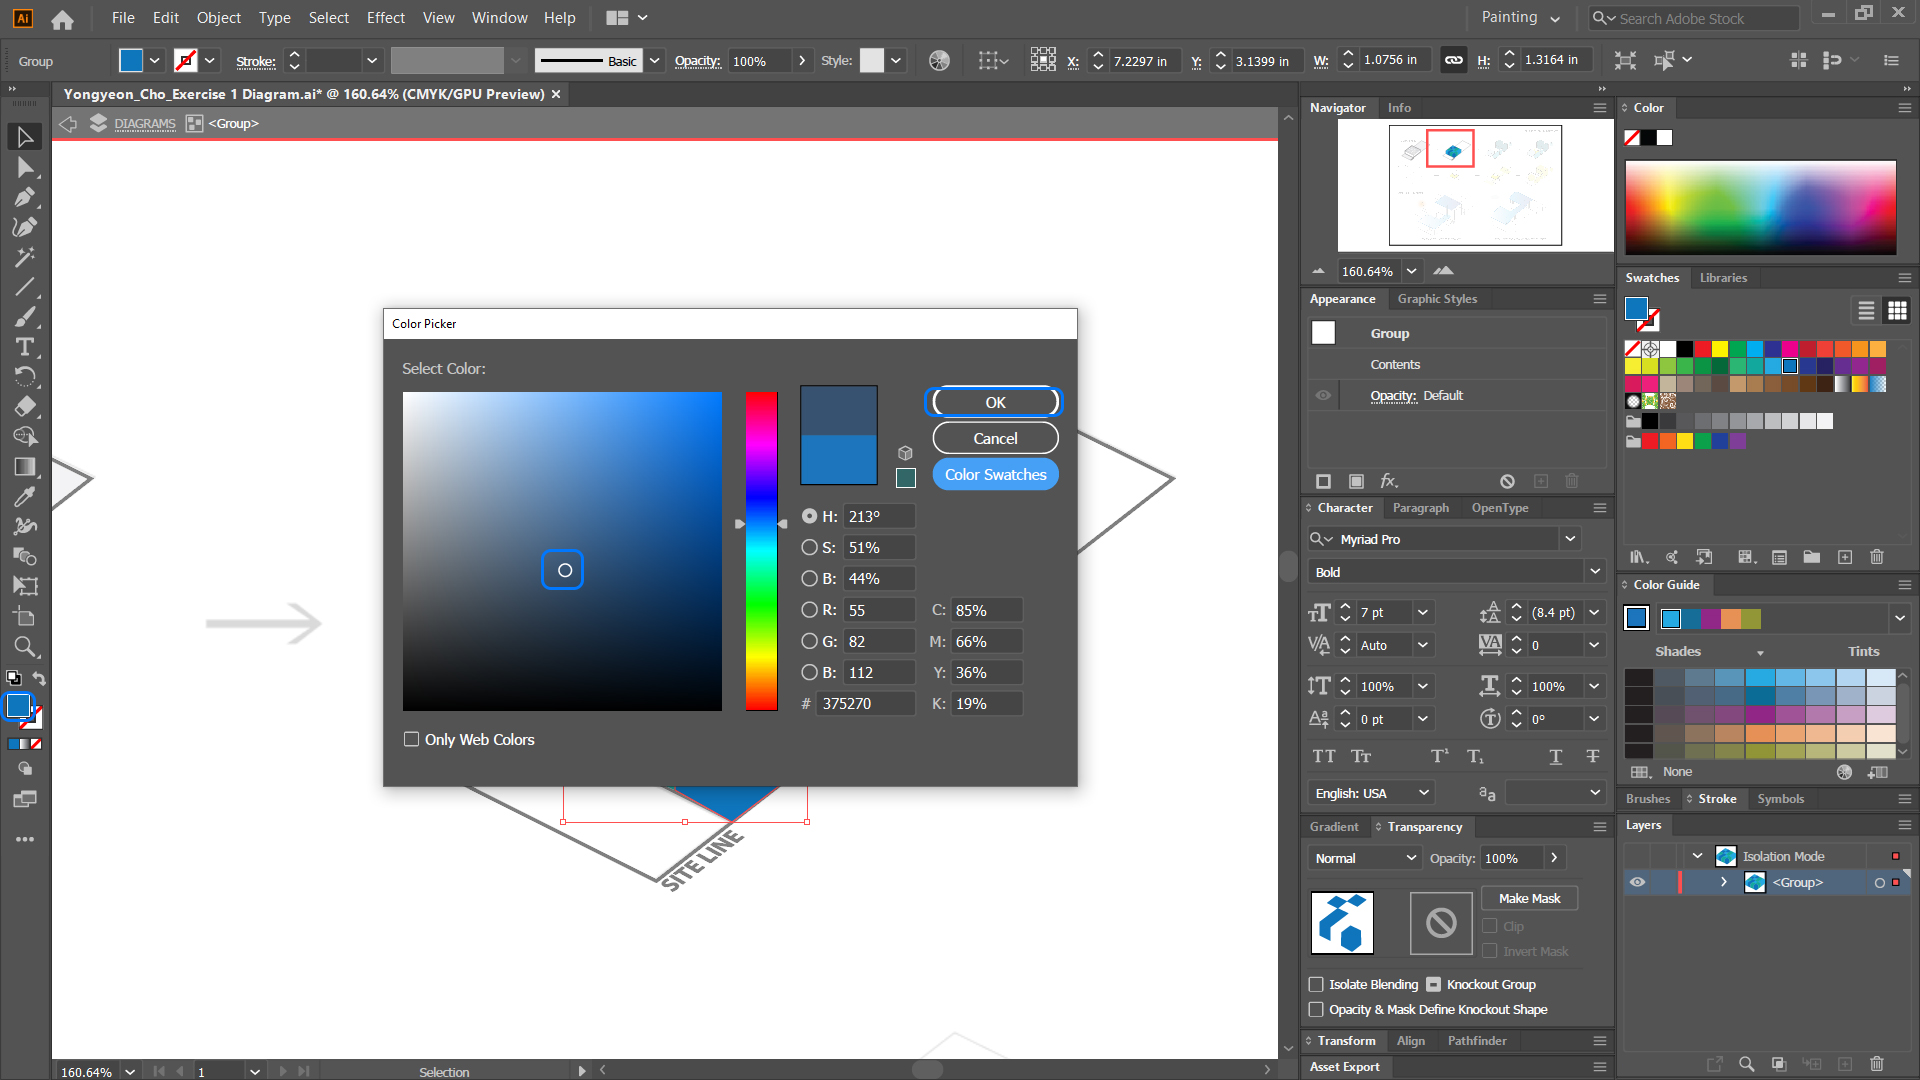
- [STEP 02] In this tutorial, you will add new colors from the background image using [EYEDROPPER TOOL], shortcut [I].
- [STEP 03] Hide the [DIAGRAMS] layer by clicking the eye icon by the layer on the [LAYER PANEL].
- [STEP 04] Unlock the [BACKGROUNDS] layer by unclicking the lock icon.
- [STEP 05] Select the image > change Opacity to 100%.
- [STEP 06] Click [EYEDROPPER TOOL] from Tool panels, shortcut [I].
- [STEP 07] Select a color that you want to add to the swatches.
- [STEP 08] Click the + icon from the [SWATCHES PANEL] to add.
- [STEP 09] Change the name if needed, check [ADD TO MY LIBRARY].
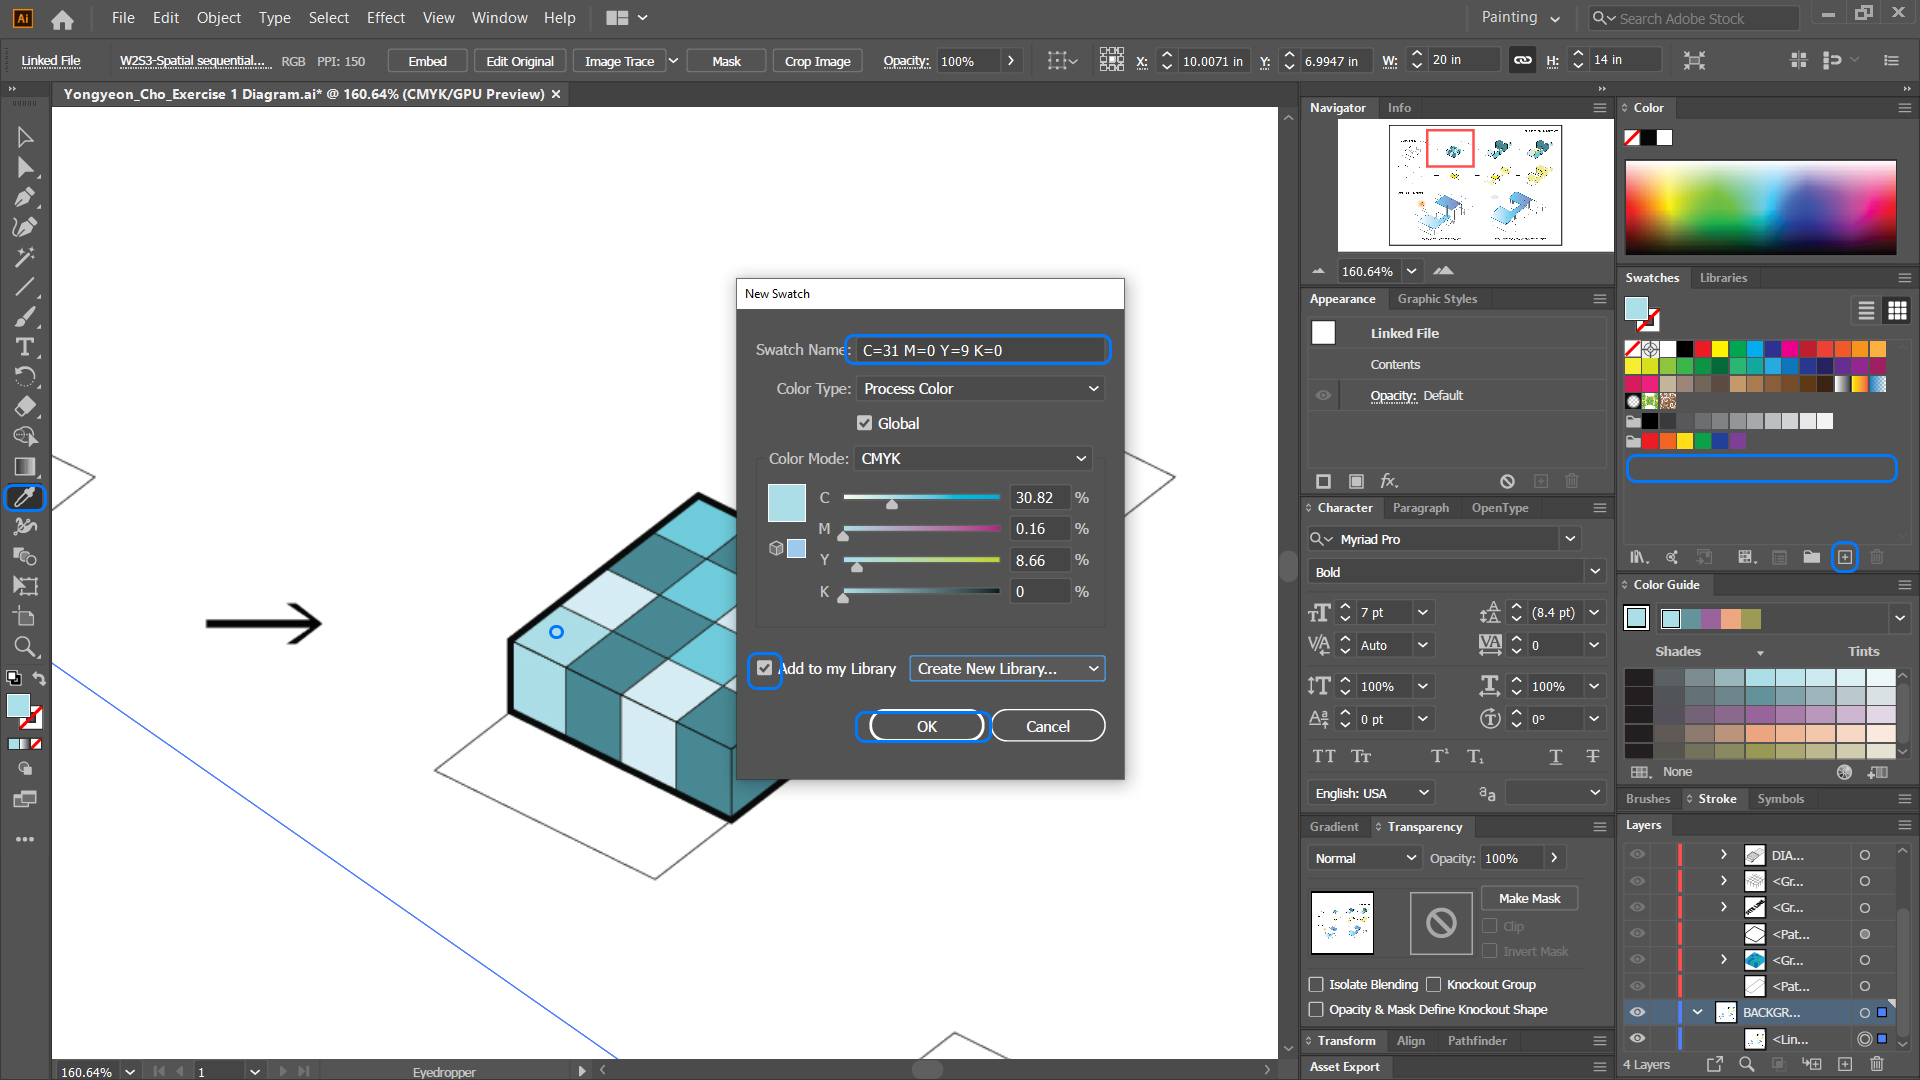
- [STEP 10] Repeat this process to save colors from a reference image.
- [STEP 11] Adjust the image opacity to 30%.
- [STEP 12] Lock the [BACKGROUNDS] layer.
- [STEP 13] Unhide the [DIAGRAMS] layer.
- [STEP 14] Click the Folder icon to create a swatch folder > Name it > Select the swatches that you made > Drag and drop off the swatches to the folder.
- [STEP 15] Select an object/ a group > make sure Fill color is activated > select a swatch to apply the color to the object/ a group.
- [STEP 16] Make a group for the [DIAGRAM 2] and rename the group from the [LAYER PANEL].
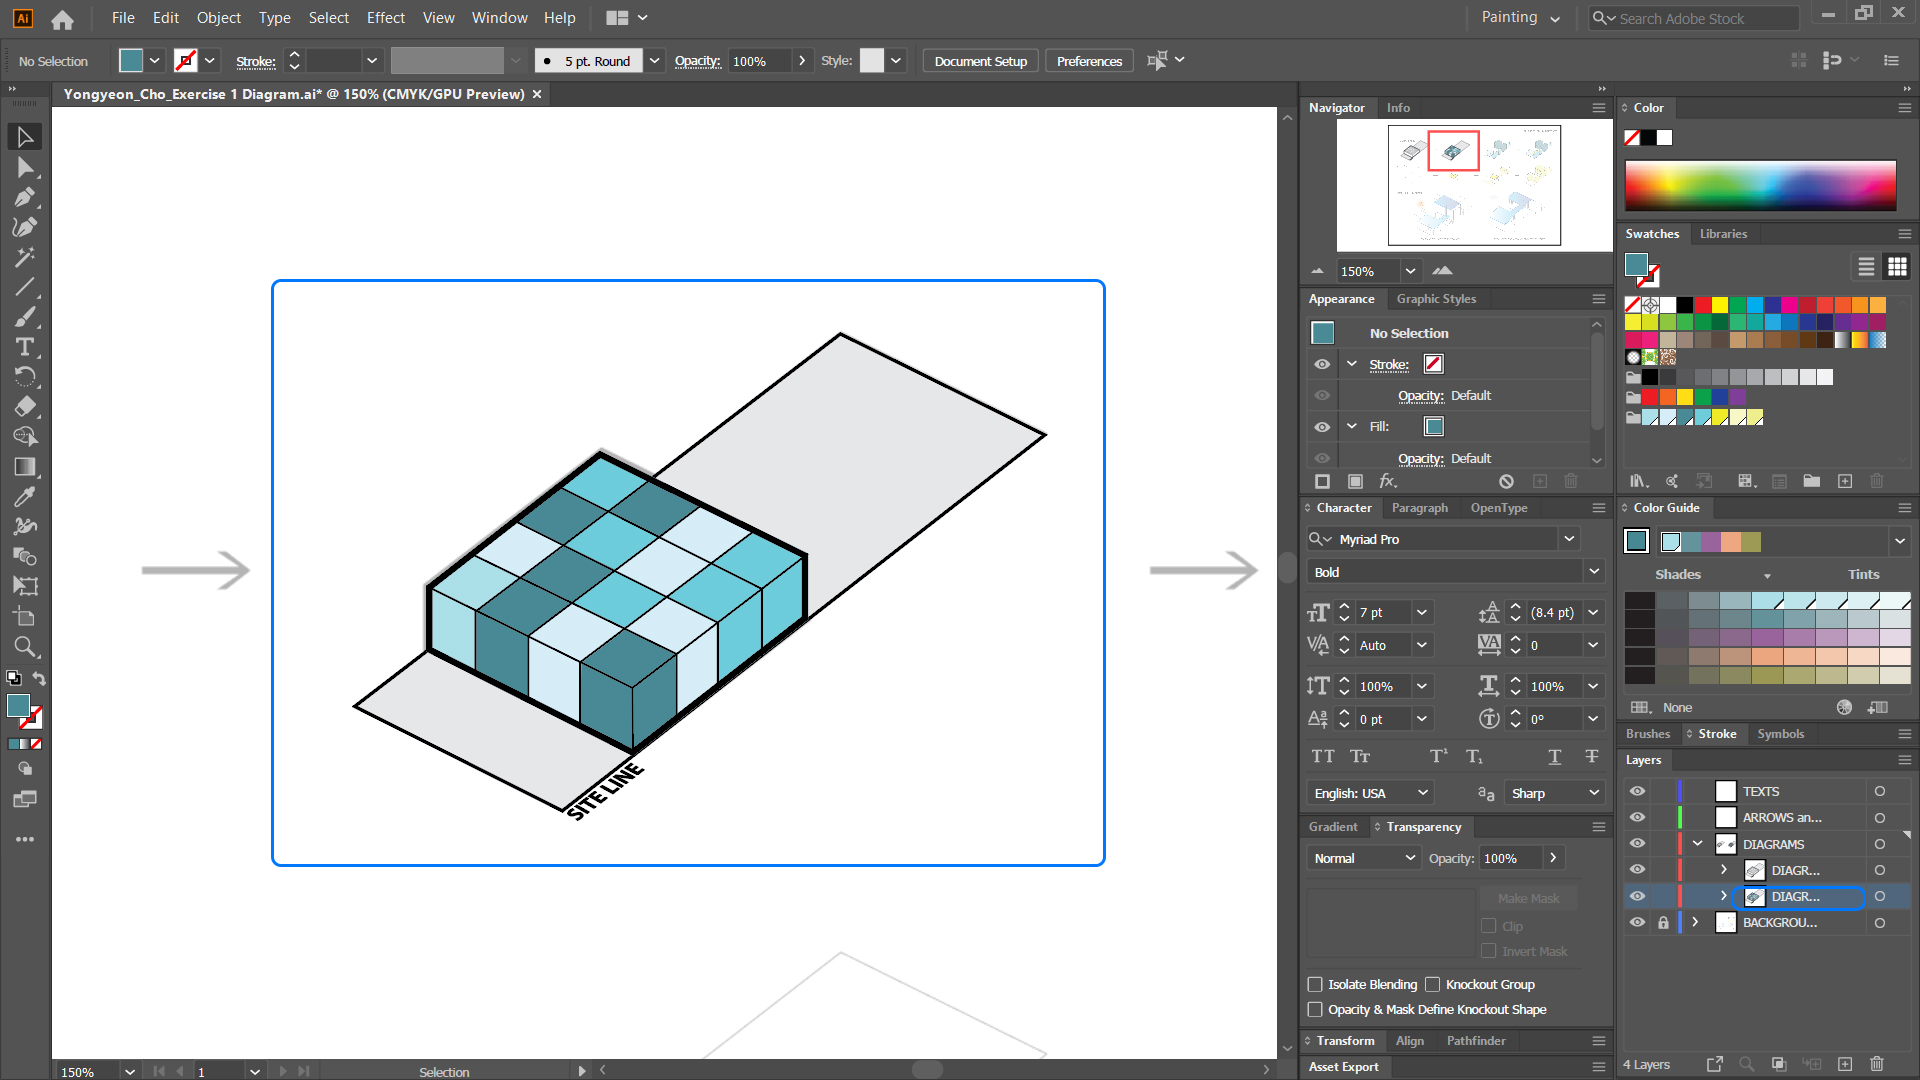
Create the third diagram
- [STEP 01] Copy the diagram 2 group to the diagram 3 location by holding [ALT] key and dragging and dropping the object/the group. If you want to copy to a straight line, hold the [SHIFT] key while dragging and dropping the object/the group.
- [STEP 02] If the background image is off from the copied diagram, you can change the image location.
- [STEP 03] Repeat [Ready to make the second diagram] to [Changing color with using Swatches and Library] to create the third diagram.
- [STEP 04] Consider the drawing orders, the thickness of lines, and the color of the object.
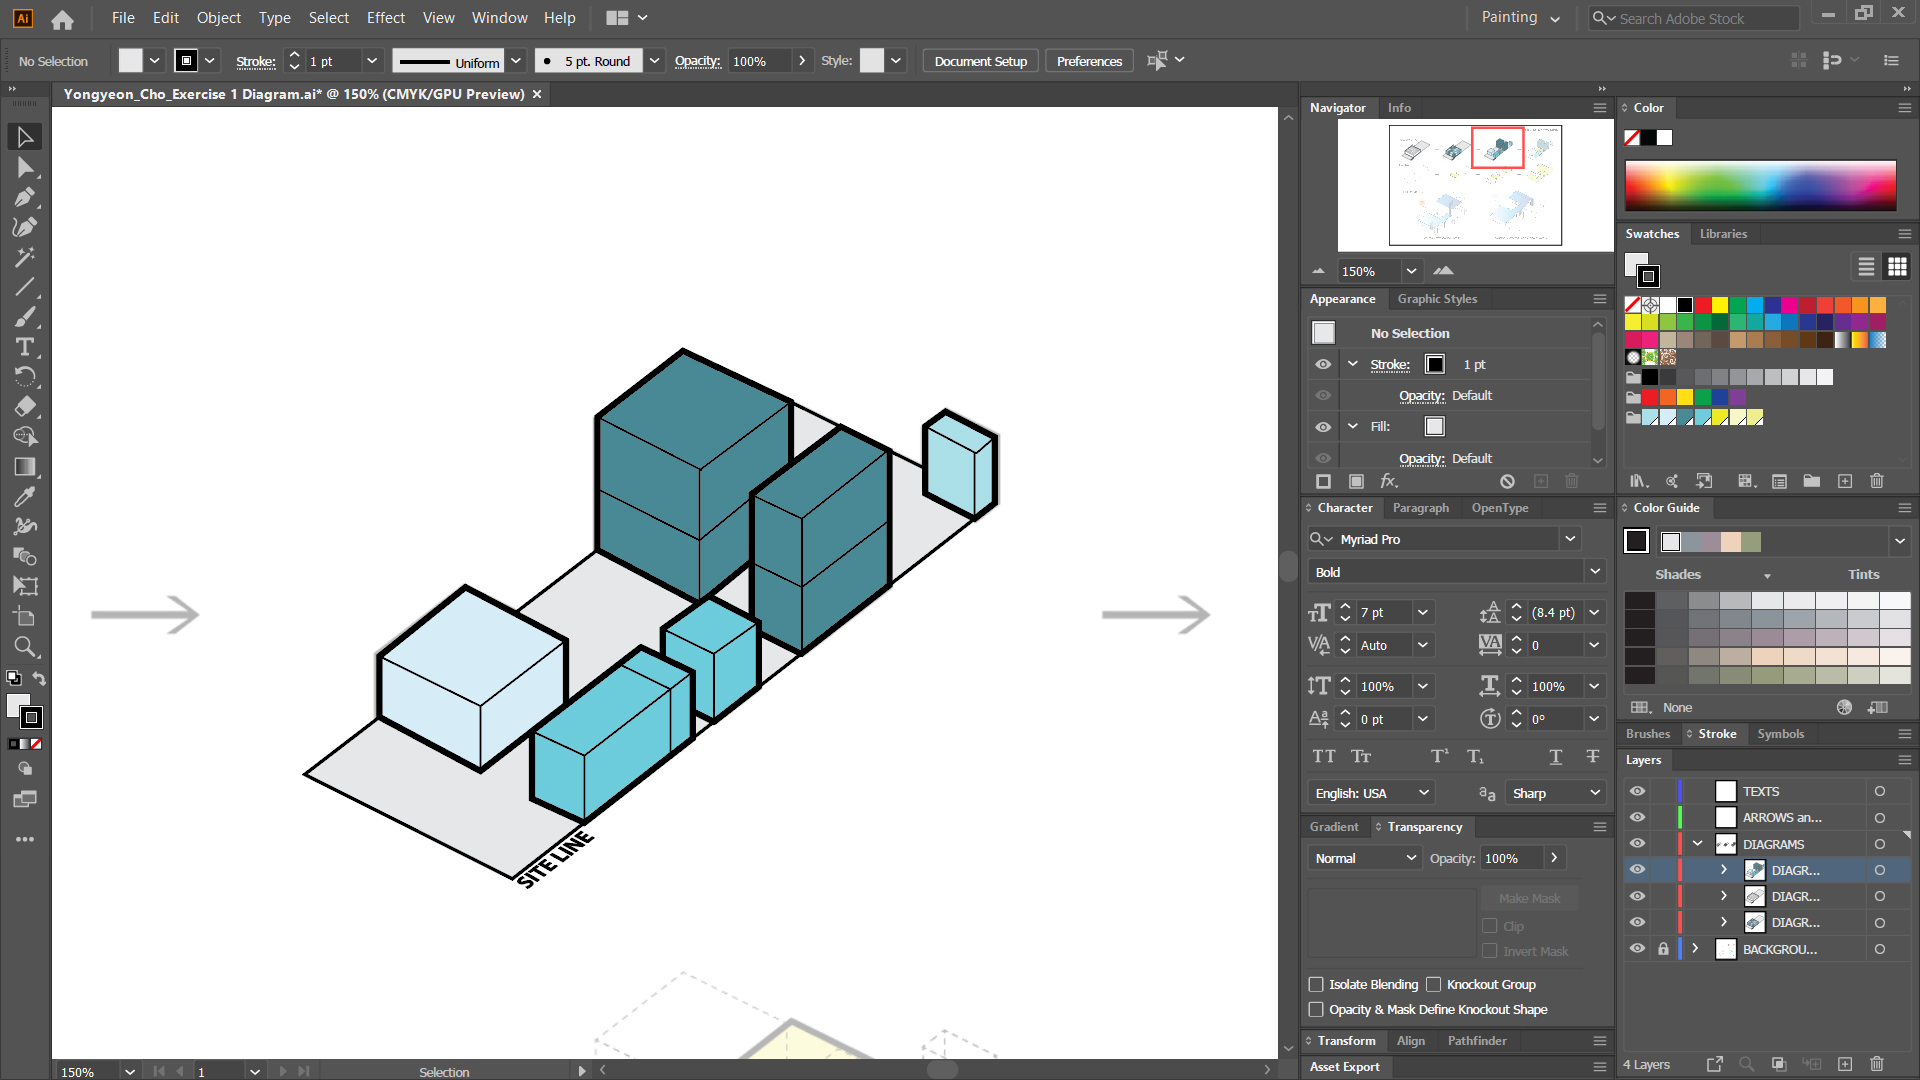
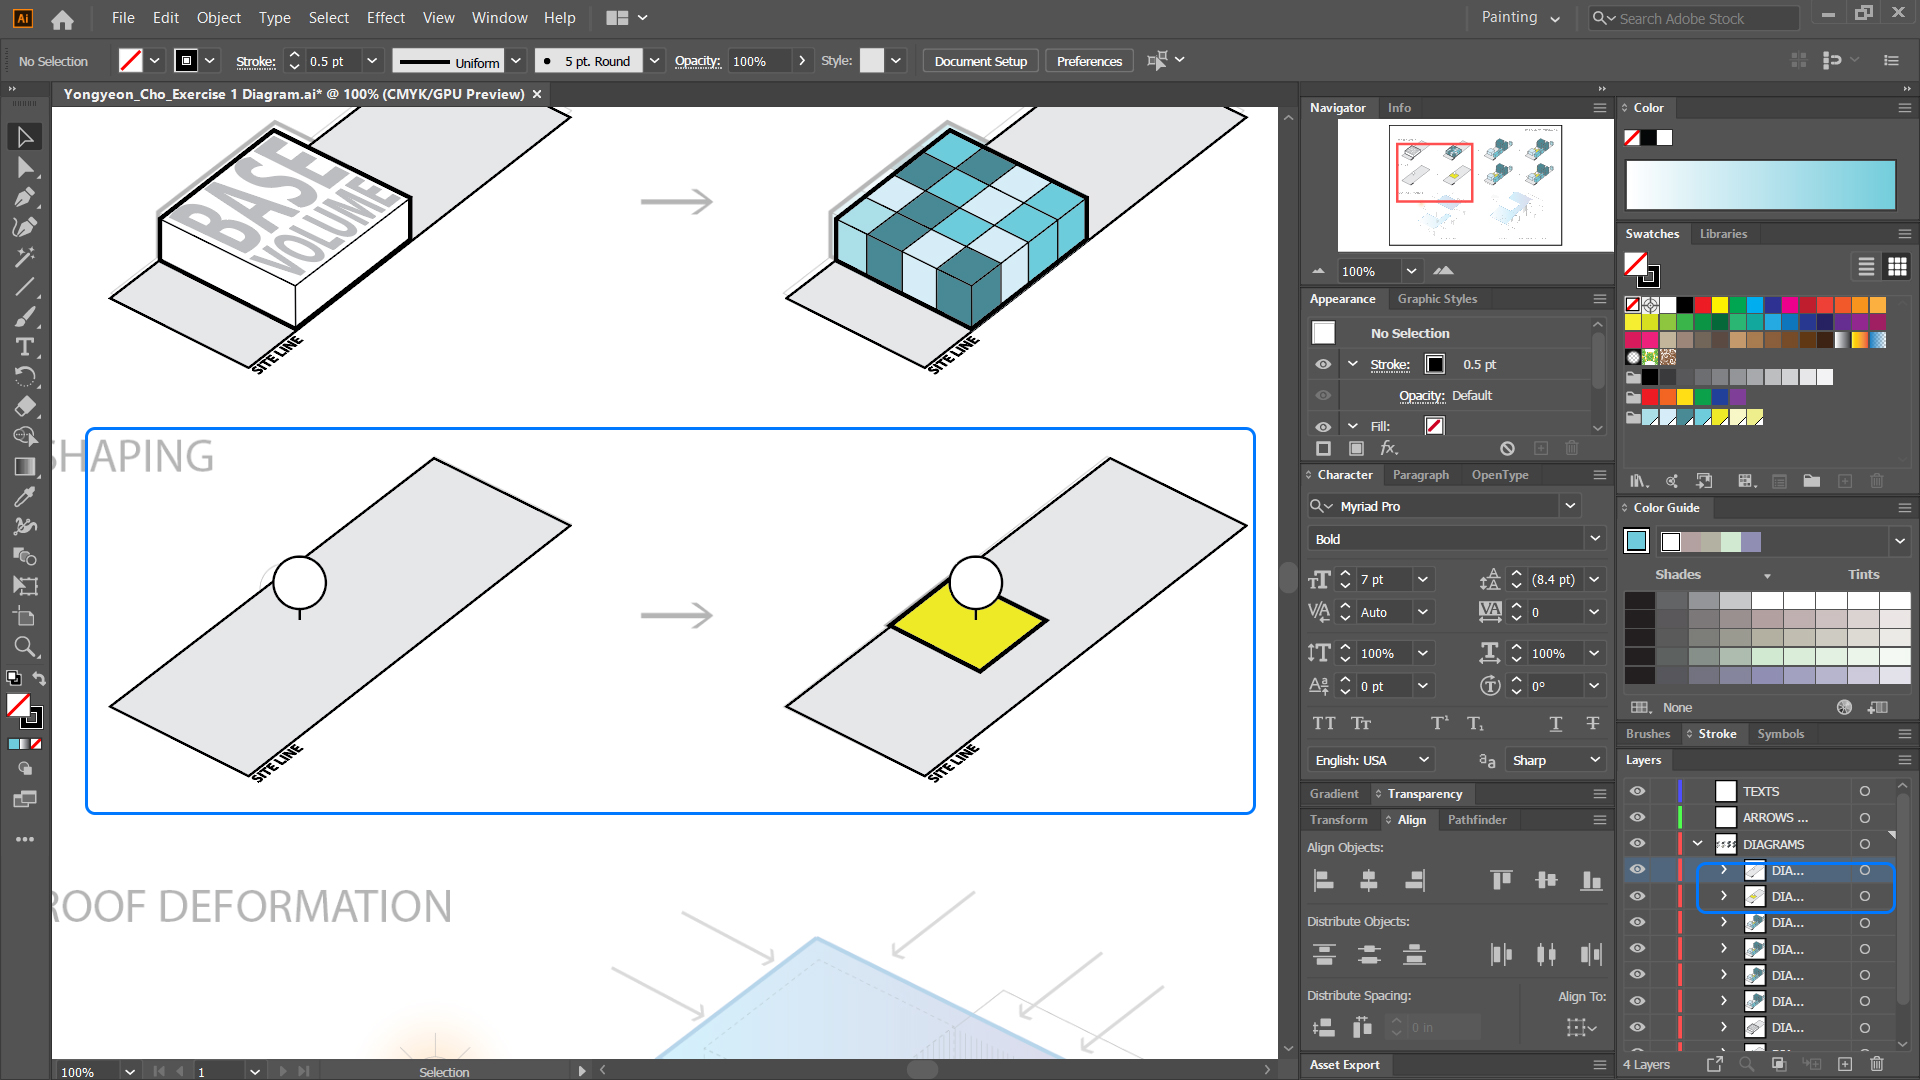
Create Diagram 4
- [STEP 01] For Diagram 4, you only need to add the Yellow square and tree in the middle of the site. You don’t need to ungroup and draw new all. You will keep the elements and only add the yellow square and three.
- [STEP 02] To see the background image, you can change the opacity value of the copied diagram or adjust the transparency style to [MULTIPLY].
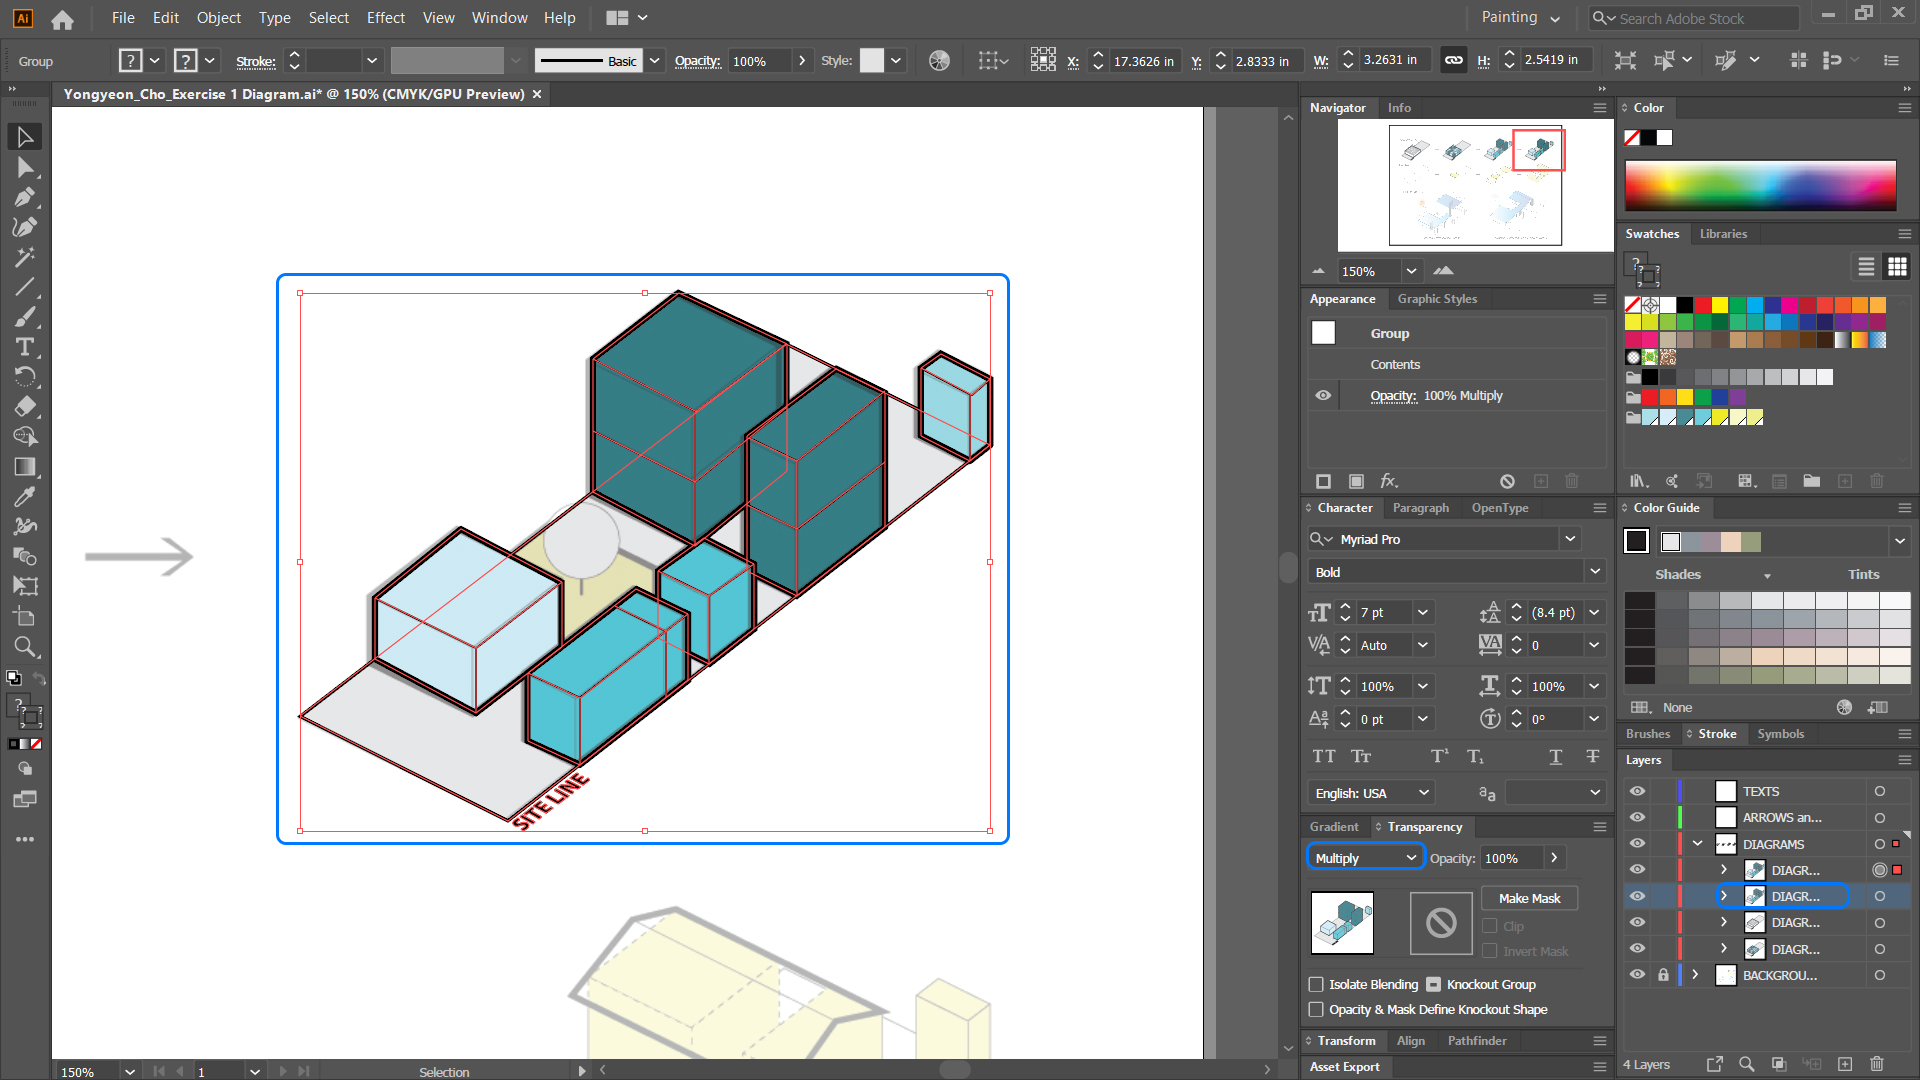
- [STEP 03] Draw the YELLOW AREA and update the color and thickness of the stroke.
- [STEP 04] Ungroup the copied diagram.
- [STEP 05] Update drawing order.
- [STEP 06] Group the copied diagram including the yellow area with the trees.
- [STEP 07] Rename of the group.
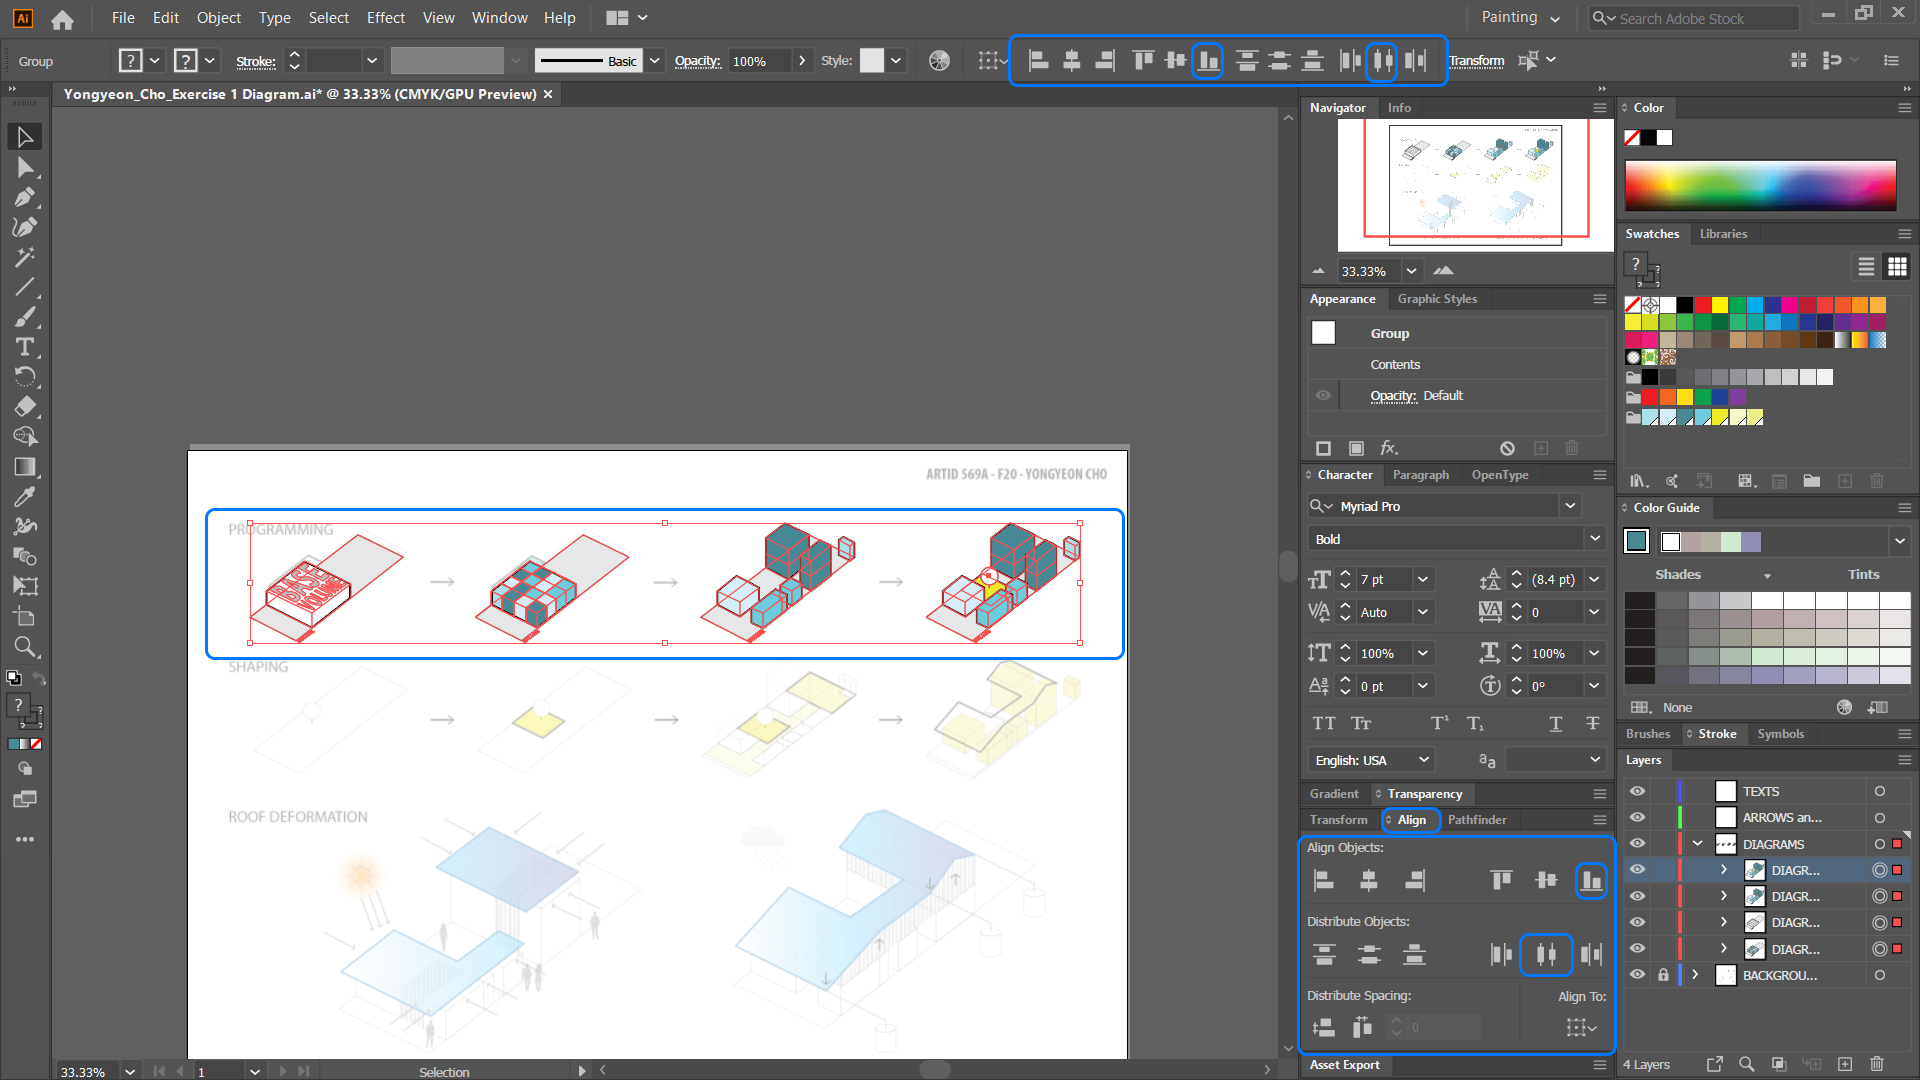
Align the four diagrams
- [STEP 01] Select the four diagrams.
- [STEP 02] Open [ALIGN PANEL] or find the align icons on the [CONTROL PANEL].
- [STEP 03] Click [VERTICAL ALIGN BOTTOM] icon.
- [STEP 04] Click [HORIZENTAL DISTRIBUTE CENTER] icon.
Create Diagram 5 and 6
- [STEP 01] Copy from diagram 4 to Diagram 5, 6, 7, and 8.
- [STEP 02] Align with Diagram 1 for diagram 5 and Diagram 3 for diagram 5.
- [STEP 03] Move the image if necessary.
- [STEP 04] Ungroup the copied diagram.
- [STEP 05] Remove objects that are not needed.
- [STEP 06] Group the object and rename it.
Create Diagram 7 and 8
- [STEP 01] Diagram 7 will be updated from diagram 4.
- [STEP 02] Update the color and stroke.
- [STEP 03] For the dashed line, you will need to open the [STROKE PANEL] and check the Dashed Line box and value dash.
- [STEP 04] Add objects to the ground by using [PEN TOOL].
Tip. Lock the diagram while you draw the ground line to prevent merging objects. - [STEP 05] Adjust drawing order.
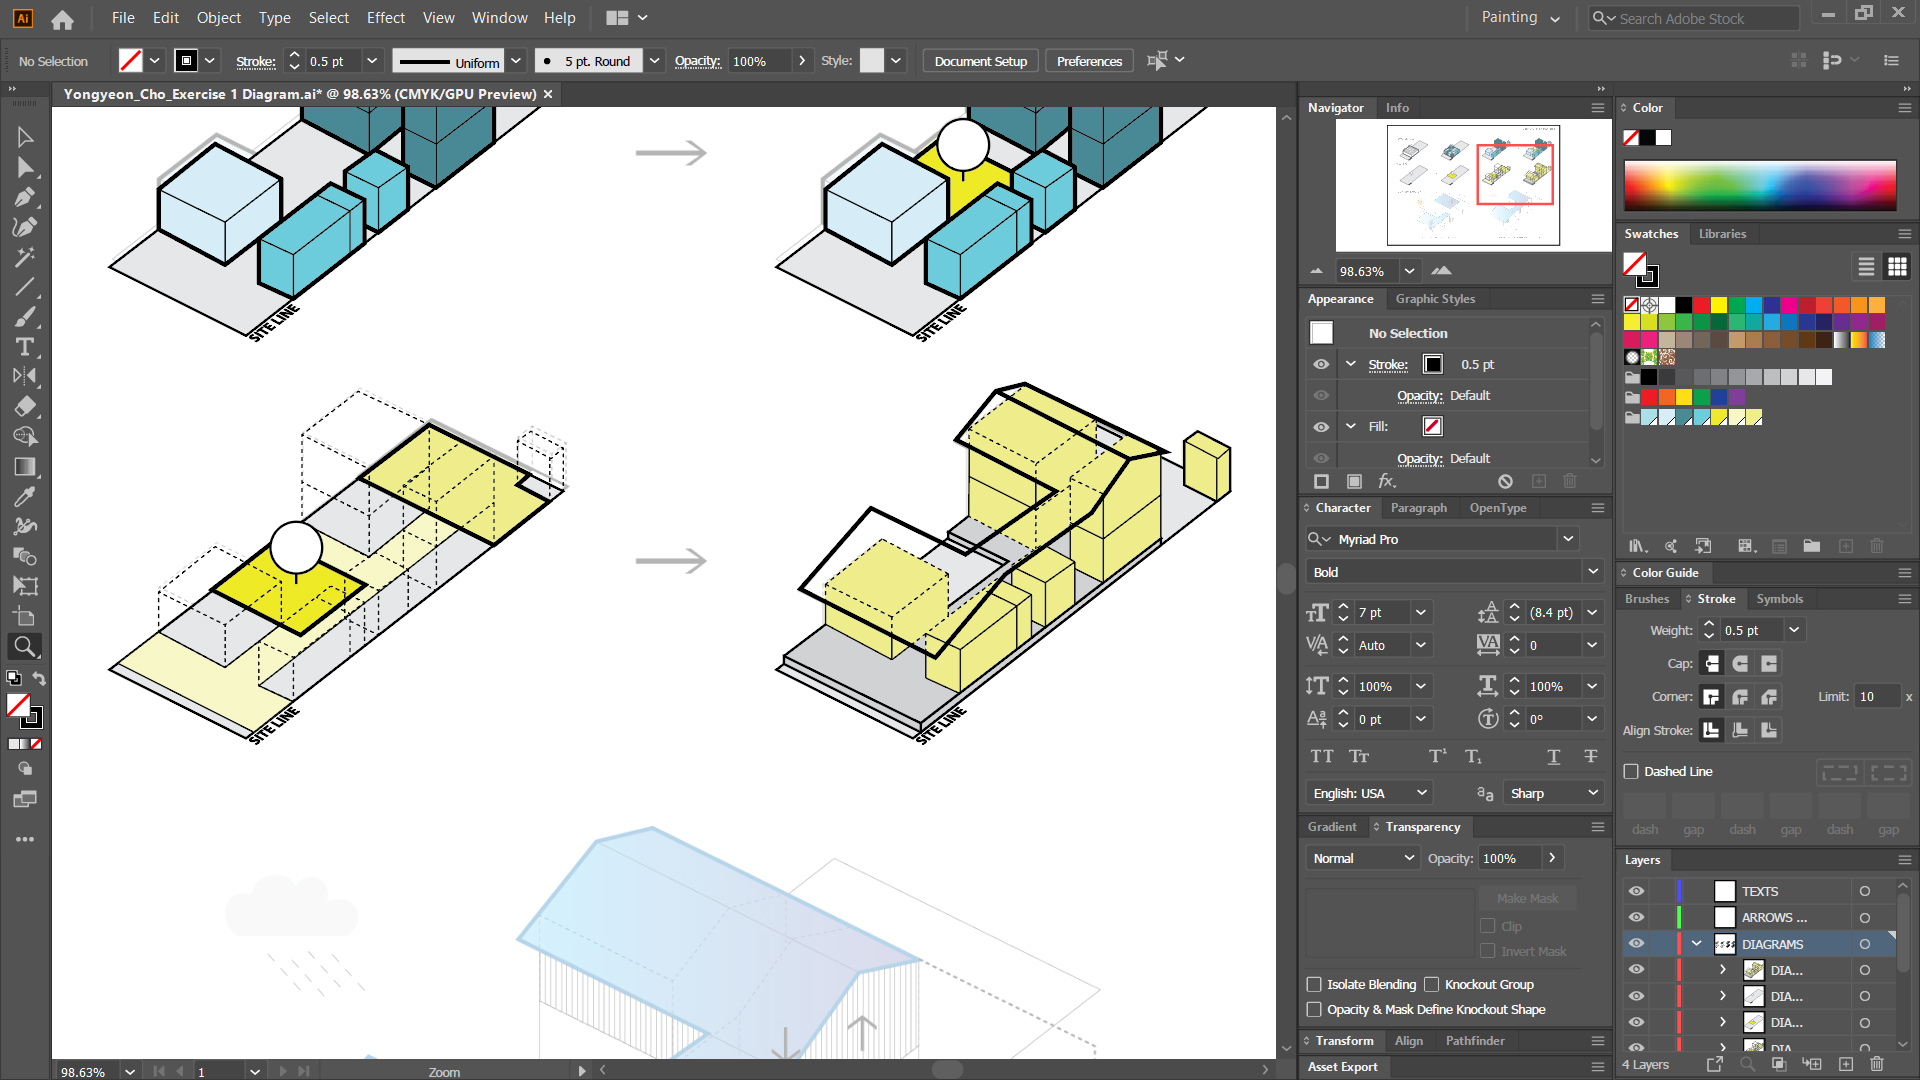
Create Diagram 9 and 10
- [STEP 01] Copy diagram 9 and 10 from diagram 8.
- [STEP 02] Scale change with keeping the ratio of the group by holding the [SHIFT] key.
- [STEP 03] Update fill colors and strokes.
- [STEP 04] Add detailed elements (Sun and water tanks) with [GEOMATICS] and [PEN TOOL].
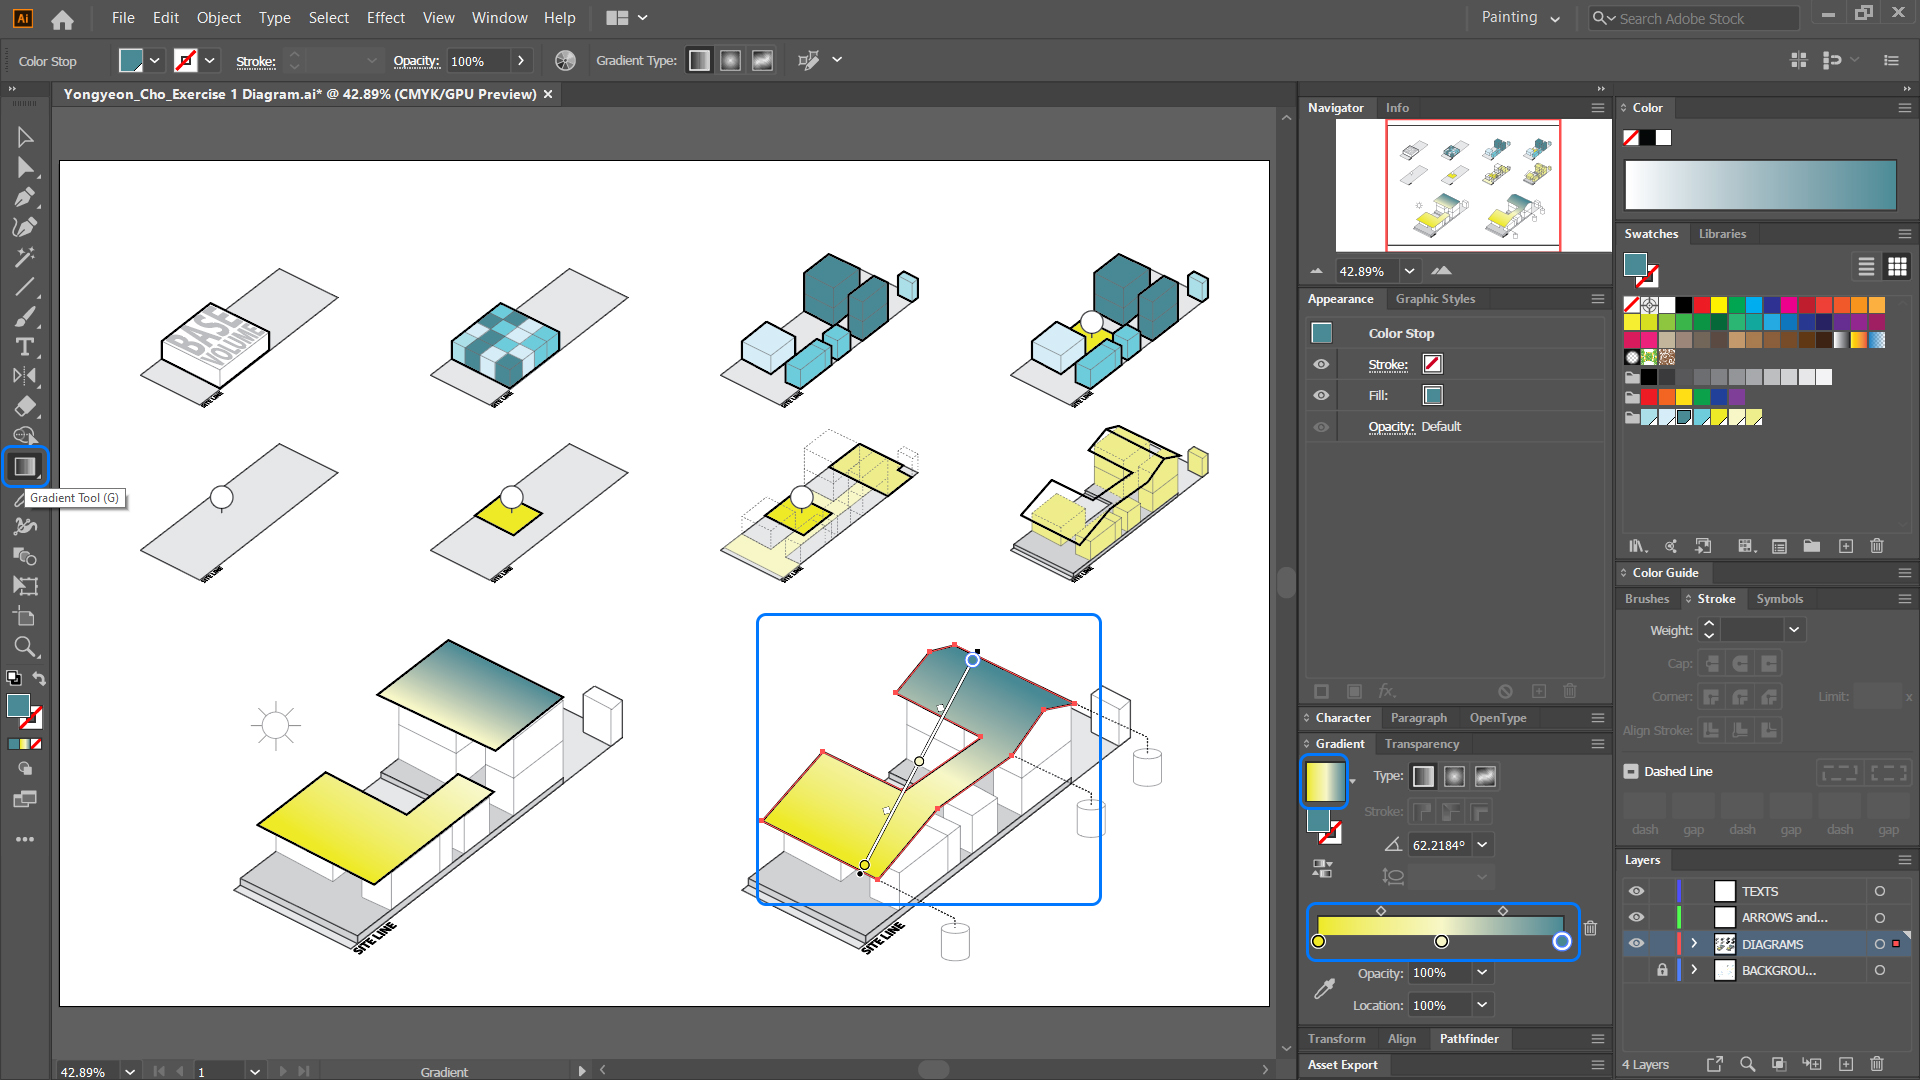
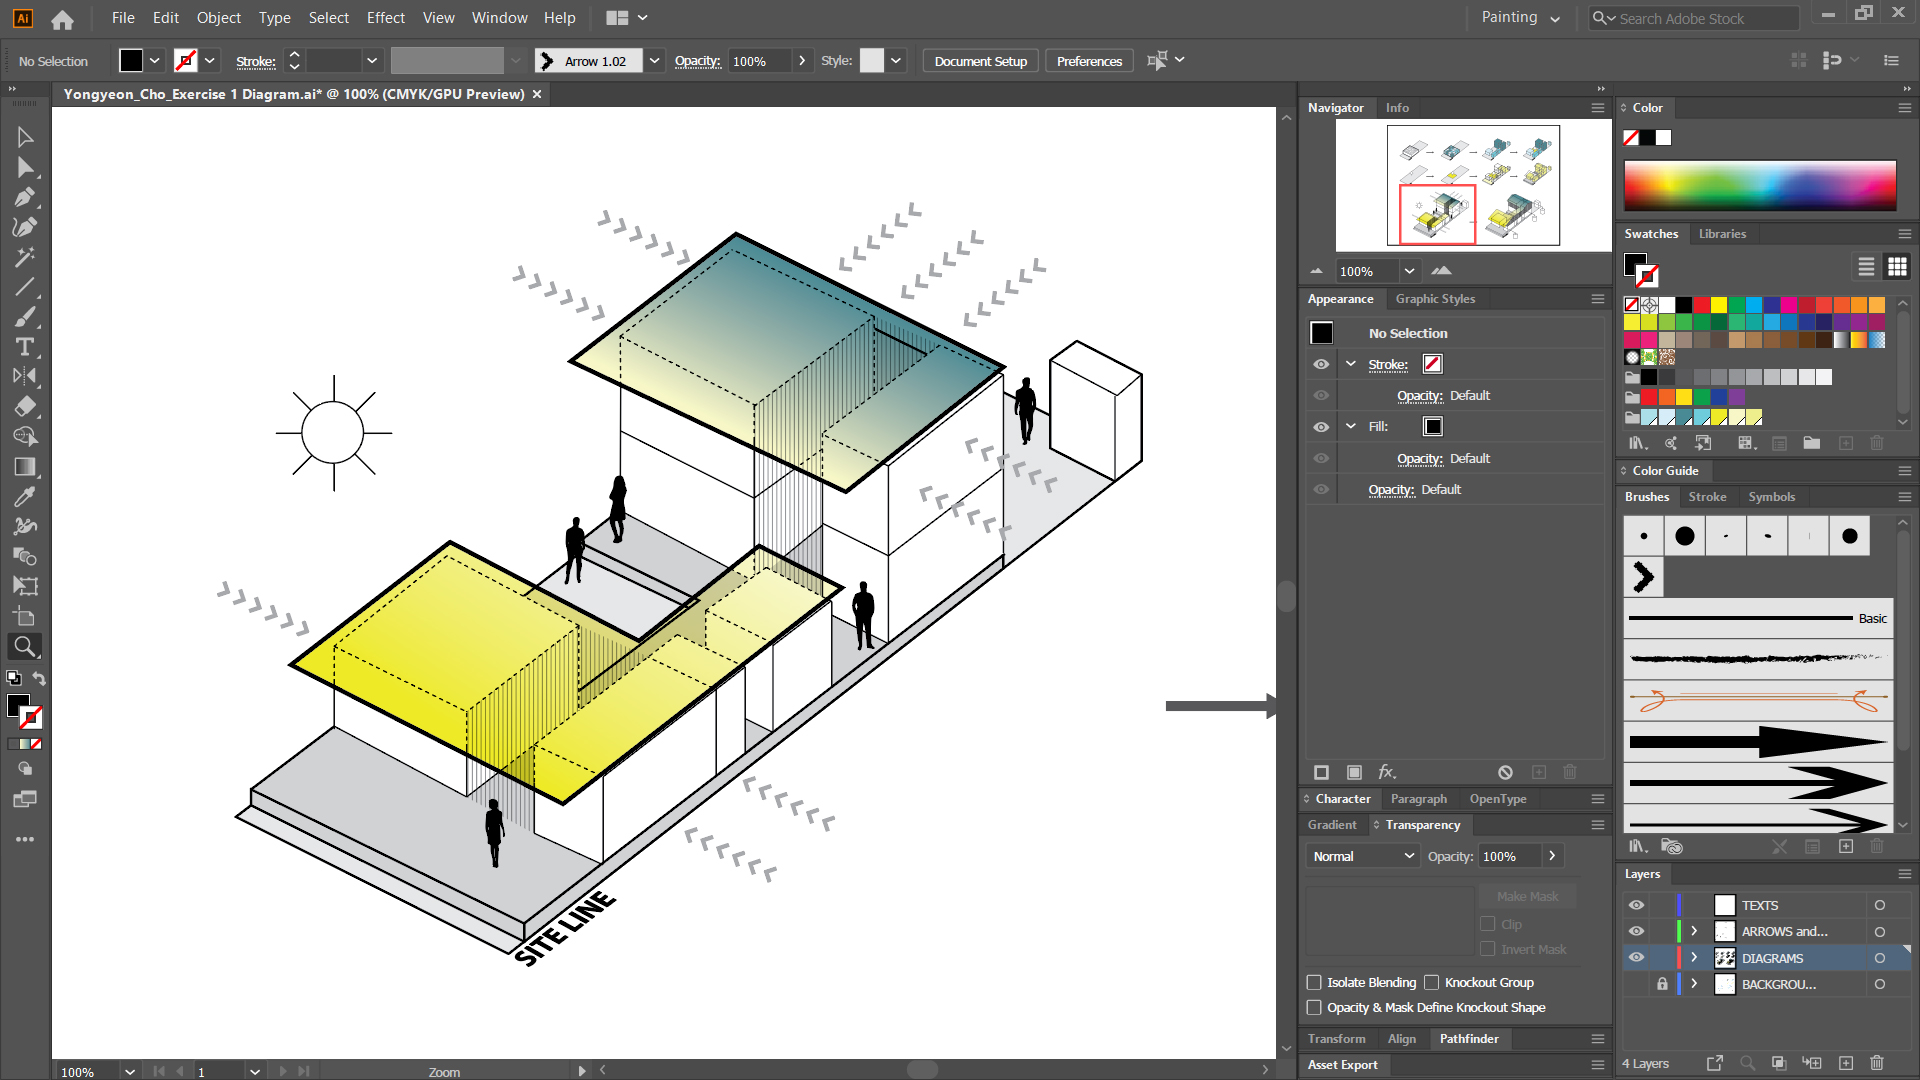
Add/edit Gradients on the roofs
- [STEP 01] Click an object to that you want to add a gradient.
- [STEP 02] Click [GRADIENT PANEL].
- [STEP 03] Make sure you selected [FILL].
- [STEP 04] Click [GRADIENT] to activate.
- [STEP 05] Click the [GRADIENT] icon on the tool panel to control gradient direction.
- [STEP 06] Double-click the black color on the [GRADIENT PANEL] to select a color.
- [STEP 07] Double-click the white color on the [GRADIENT PANEL] to select a color.
- [STEP 08] If you want to add color to the gradient that you made, click in the middle of the gradient and change the color. You can also adjust the percentages of the gradient.
- [STEP 09] Update transparency style to Multiple to show the behind the objects.
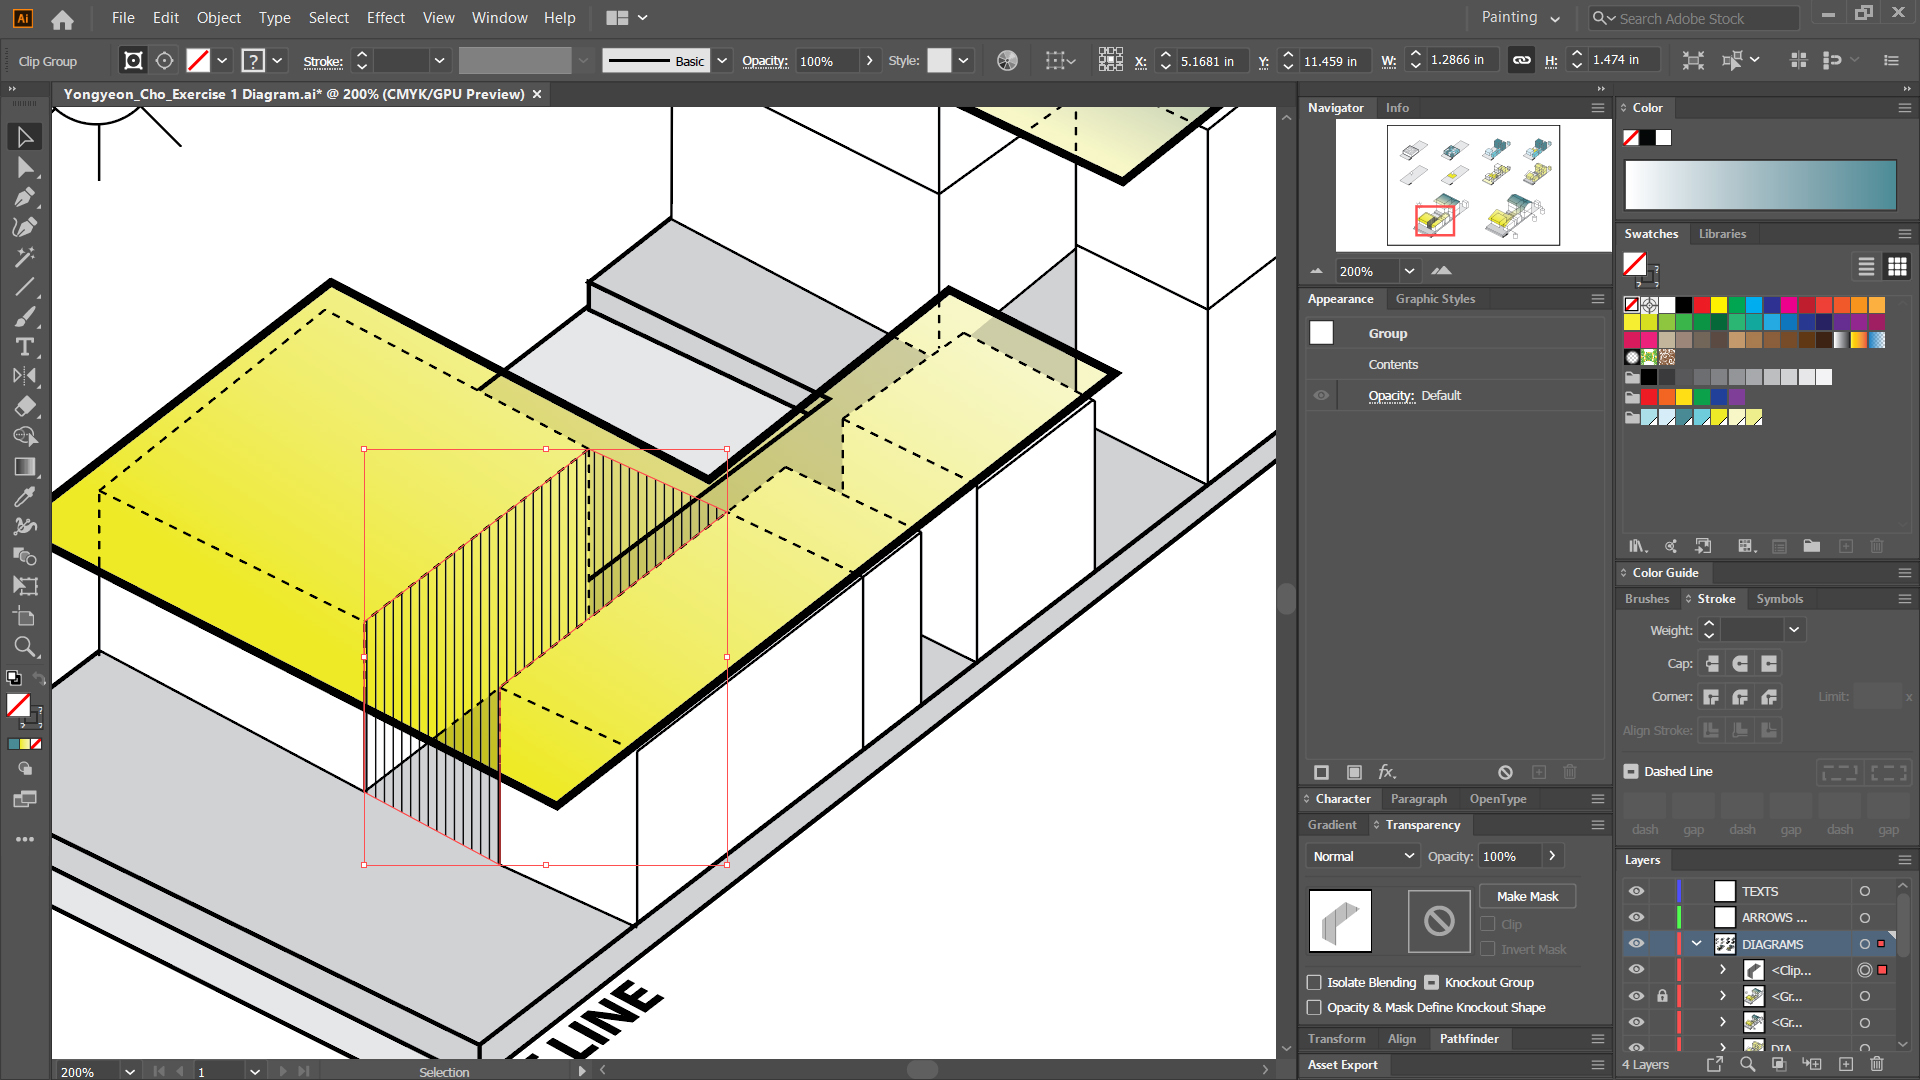
Add hatch using Make Clipping Mask
- [STEP 01] Create a pattern as a group with an object/objects.
- [STEP 02] Draw a line and copy the line multiple times and align [HORIZENTAL DISTRIBUTE CENTER] and make the lines to a group.
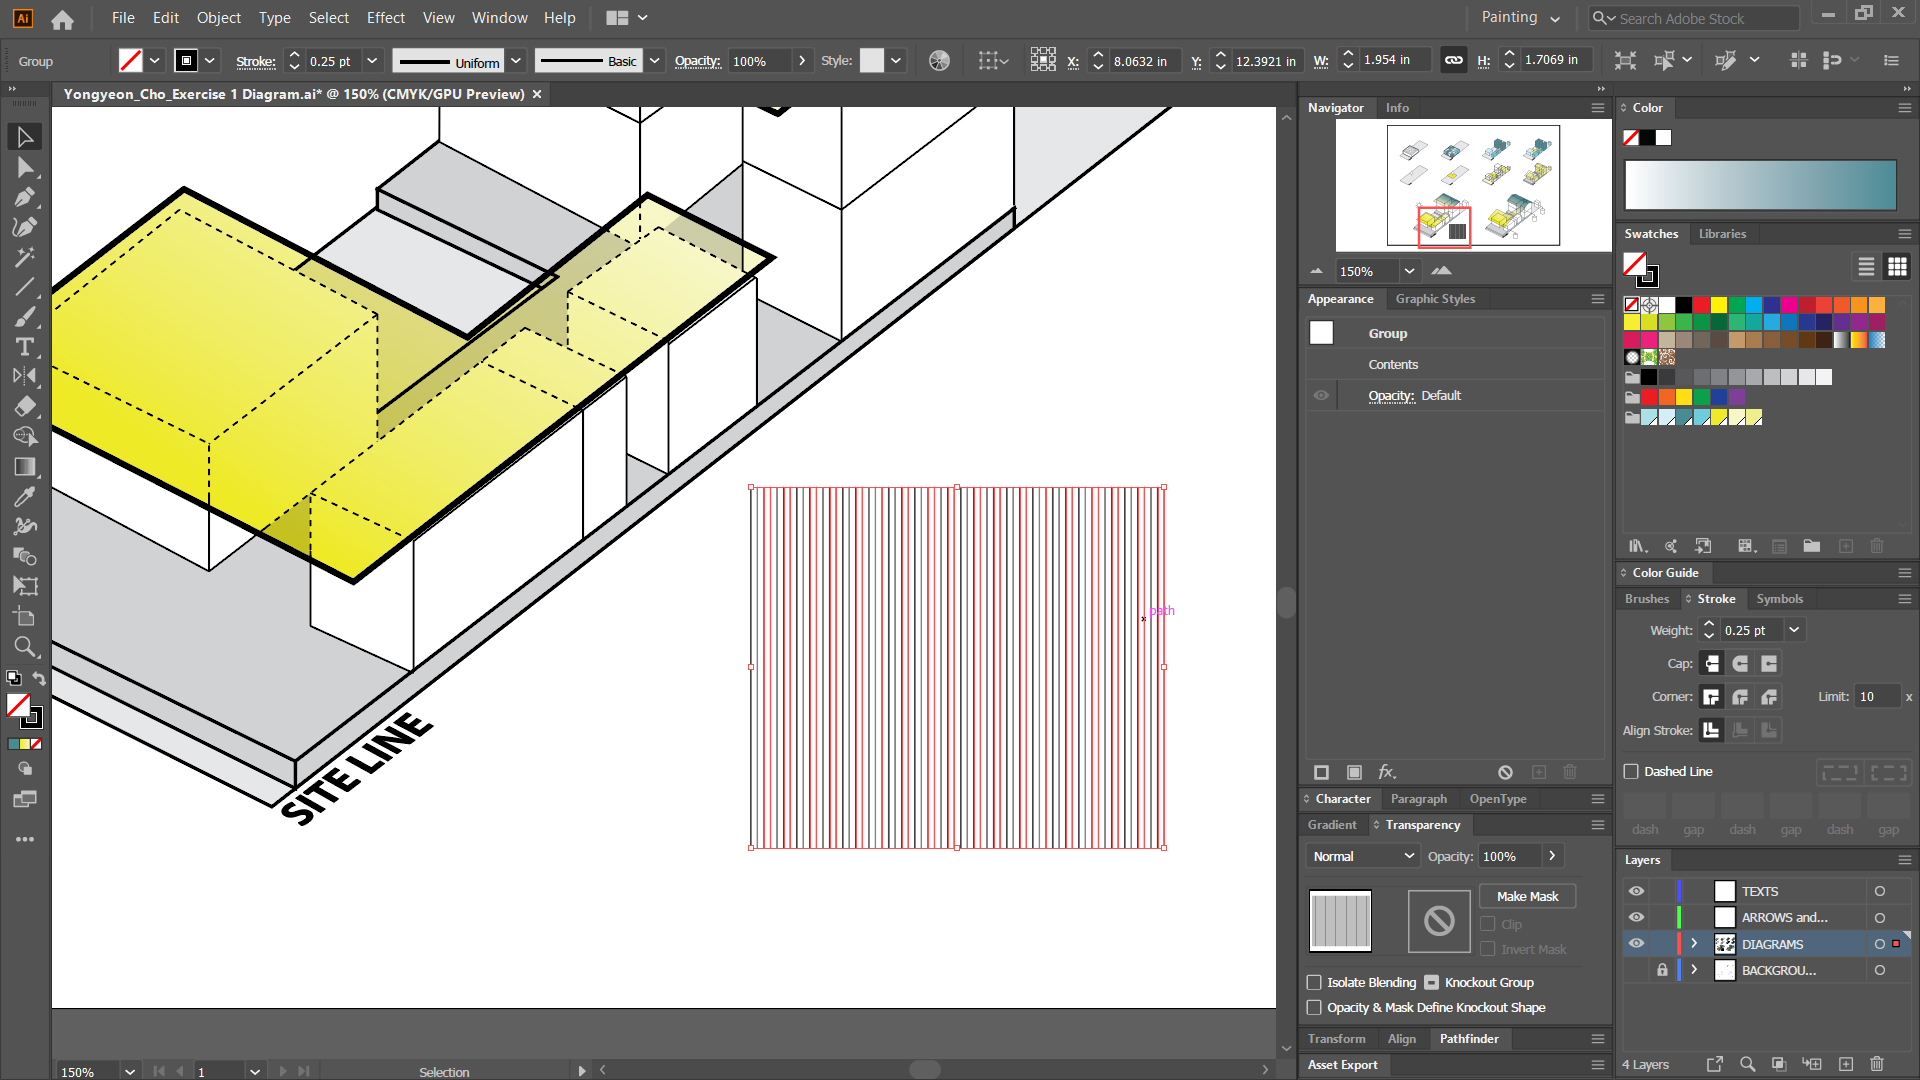
- [STEP 03] Move the pattern group to where you want to apply.
- [STEP 04] Draw the boundary line (must be closed a loaf).
- [STEP 05] Select the pattern group (below) and the boundary line (above).
- [STEP 06] Mouse right-click > click [MAKE CLIPPING MASK].
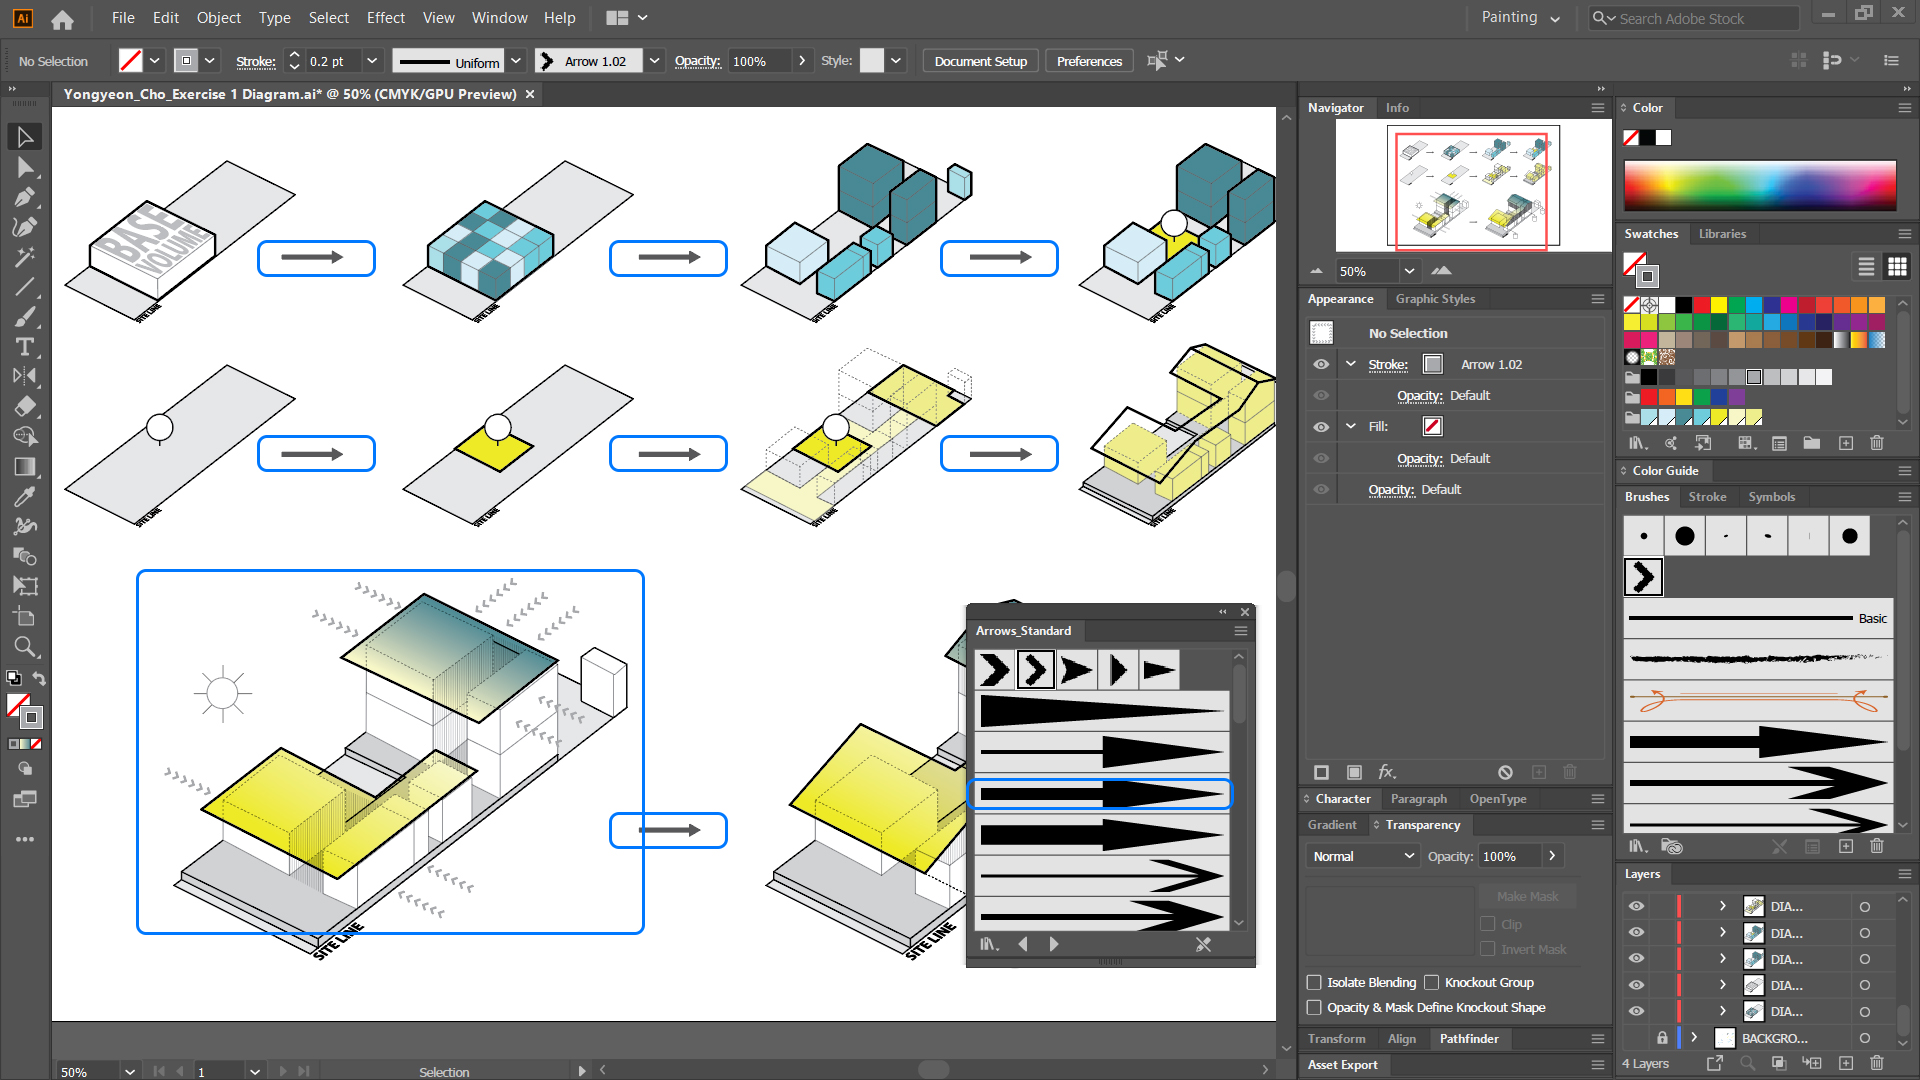
Add arrows
- [STEP 01] Illustrator has lots of brushes in the library.
- [STEP 02] Click [BRUSH PANEL] > click the panel extension > Click [OPEN BRUSH LIBRAY] > Click [ARROWS] > Click [ARROWS_STANDARD].
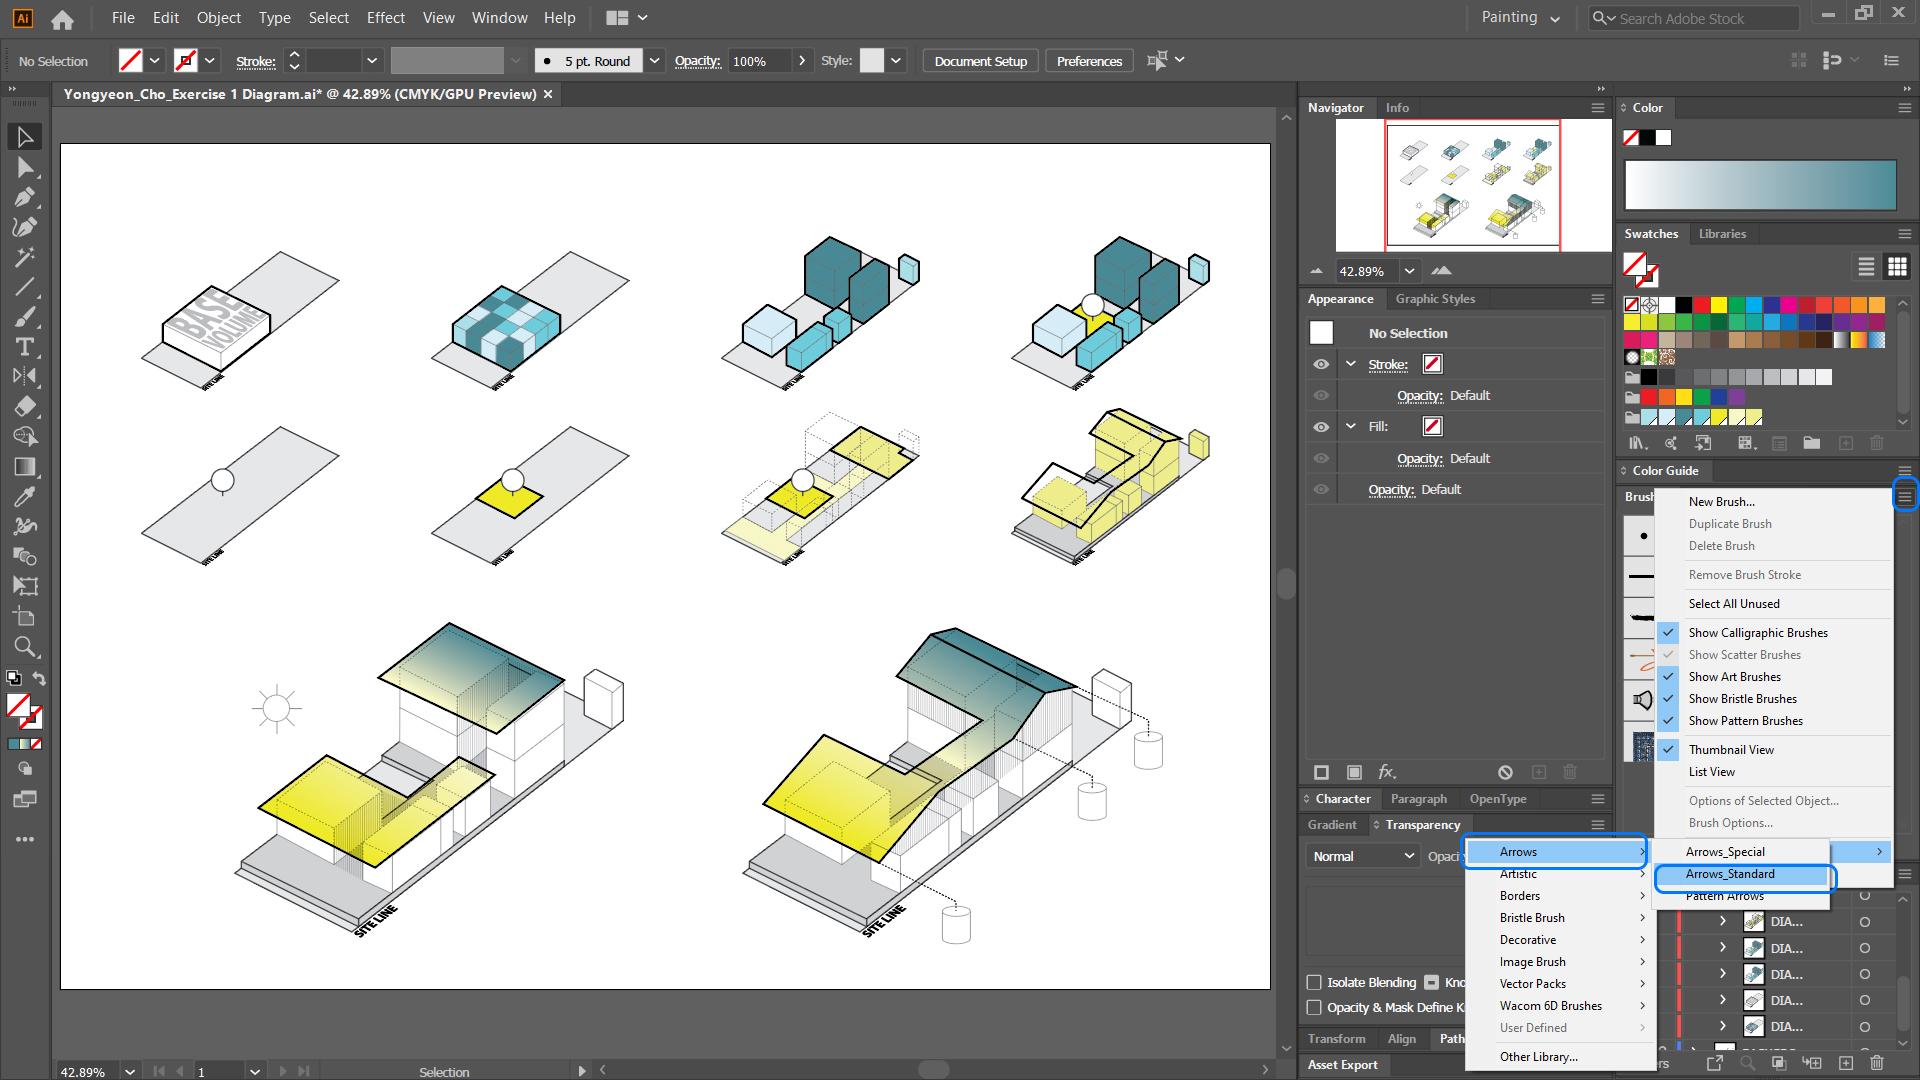
- [STEP 03] Draw a line.
- [STEP 04] Select an arrow from the brush library to apply.
- [STEP 05] Adjust stroke color and thickness to change the appearance.
Add icons from images using image tracing
- [STEP 01] In this tutorial, you will learn how to convert a raster (bitmap) image to a vector image.
- [STEP 02] Download a silhouette icon (the black and white image will have the best results) from the image searching website.
- [STEP 03] Place the image on the artboard [SHIFT+CTRL+P].
- [STEP 04] Click [EMBED] from the [CONTROL PANEL].
- [STEP 05] Click the small arrow by the [IMAGE TRACE] to select [BLACK AND WHITE LOGO].
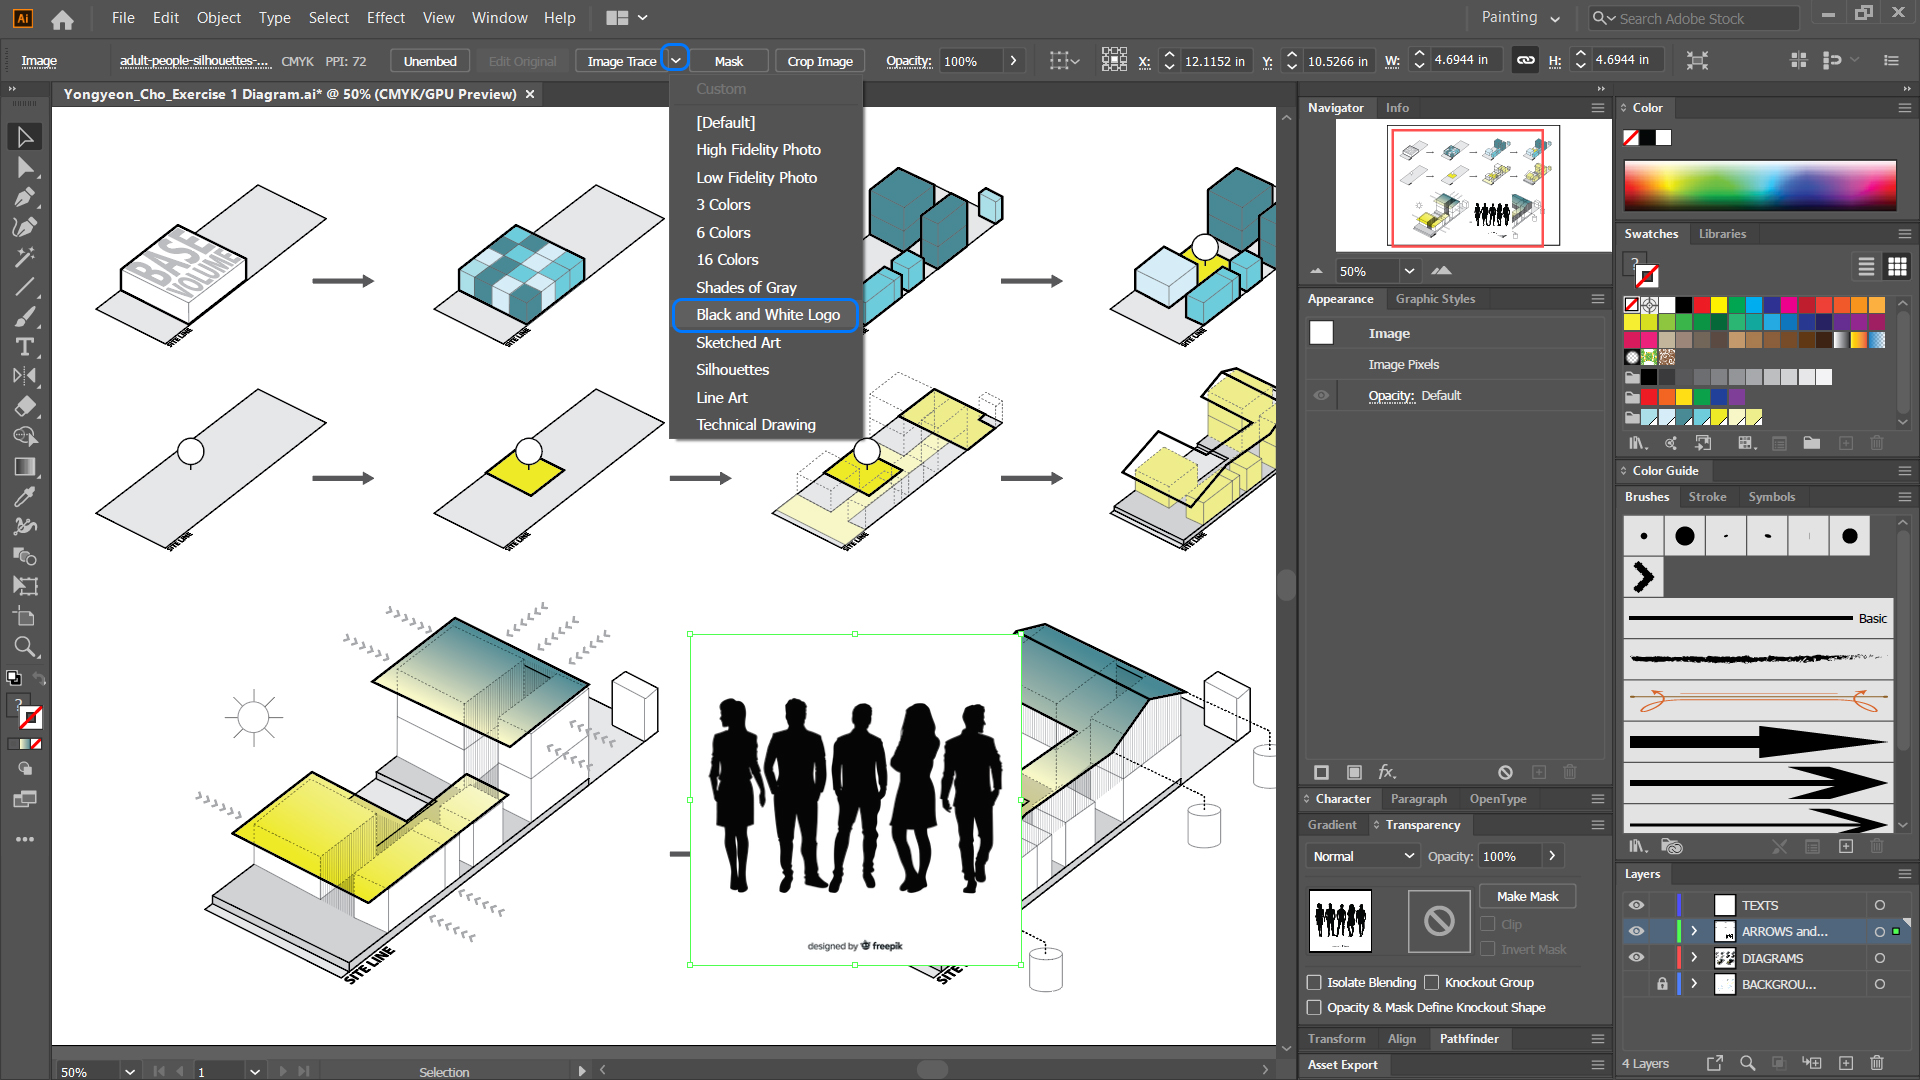
Image credit: Black and white human figures designed by freepik. [STEP 06] Open [IMAGE TRACE PANEL] to adjust the detail.
- [STEP 07] Once you think the image is ready to convert to a vector image, click [EXPAND] from the control panel.
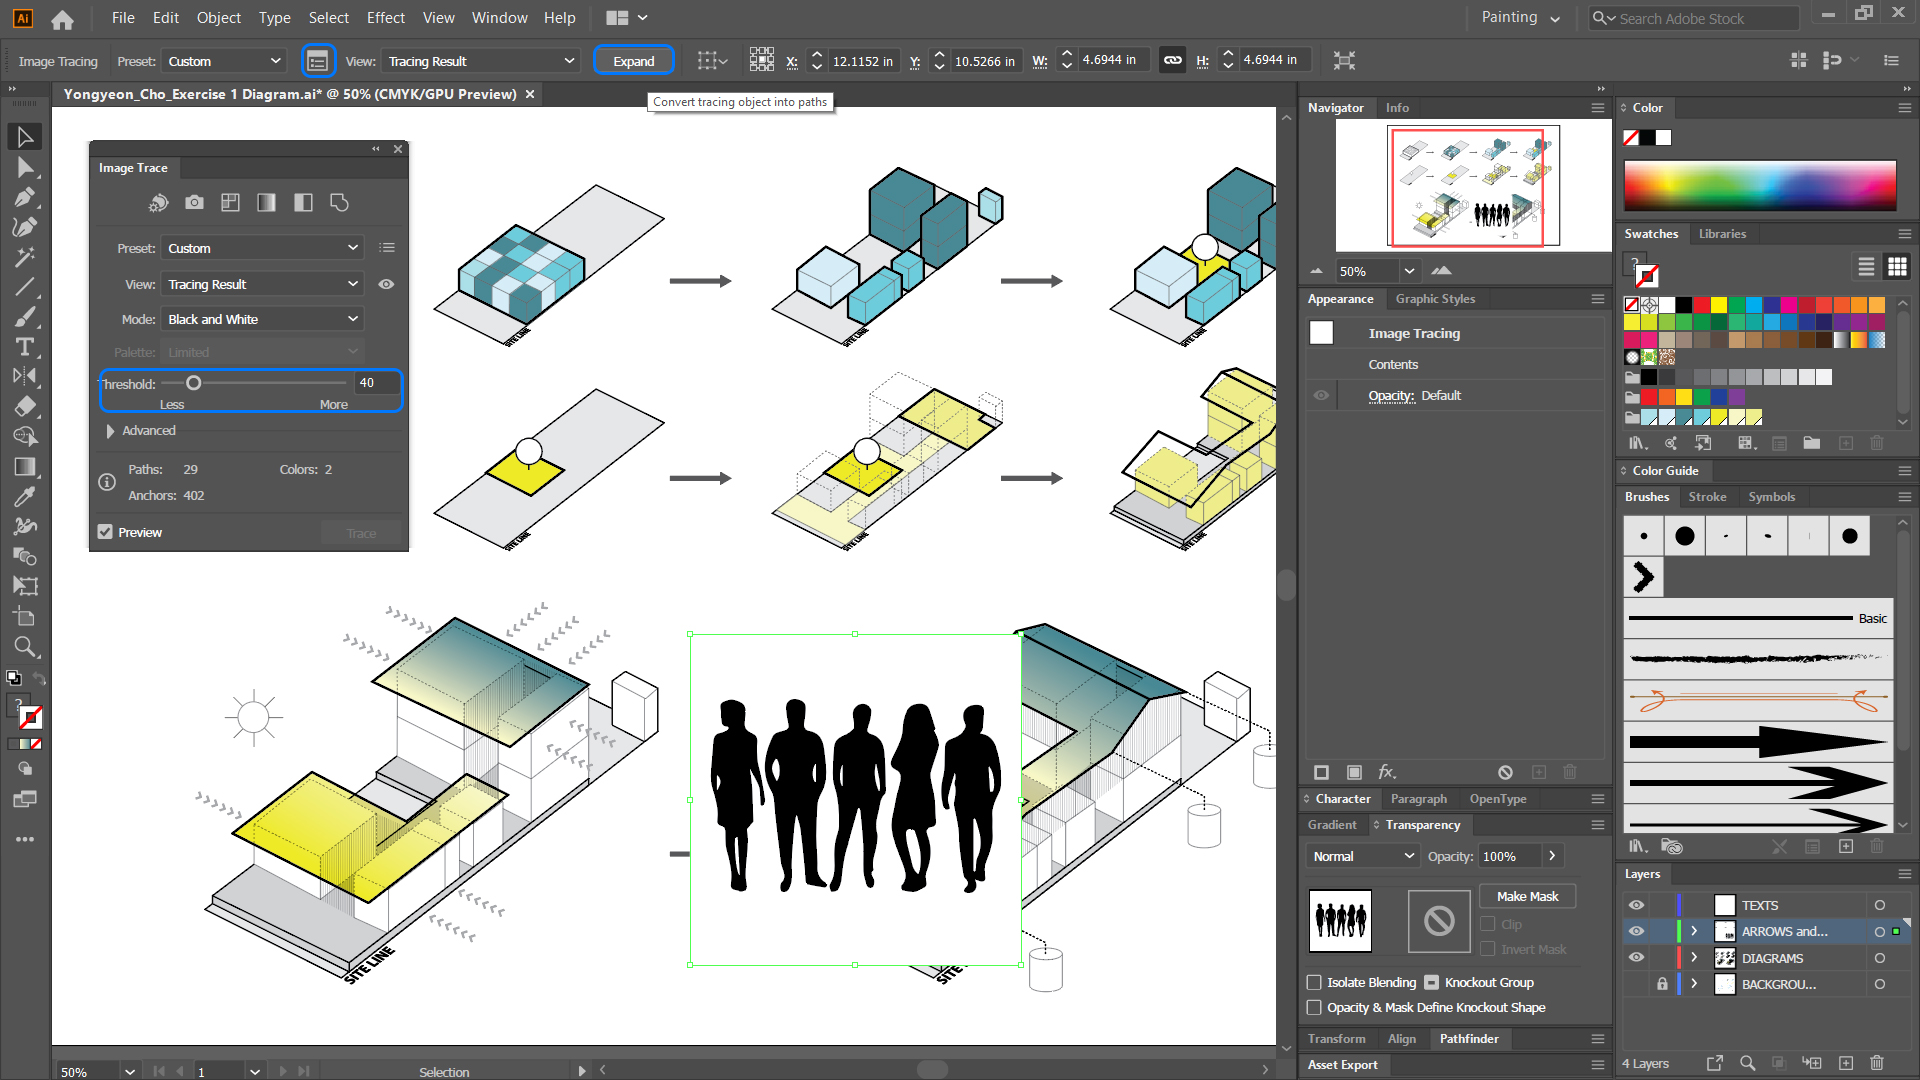
- [STEP 08] Ungroup the expanded image to control the individual object.
- [STEP 09] Remove the unnecessary objects.
- [STEP 10] Adjust scale and position.
Add texts
- [STEP 01] Click [TYPE TOOL] from [TOOL PANEL], or press [T].
- [STEP 02] Create a text box and add texts.
- [STEP 03] Modify fonts and size.
Export to PDF and JPG
- [STEP 01] Before you create PDF and JPG, you must save the file.
- [STEP 02] To create a PDF file, you should use [SAVE A COPY] from the file menu > select [PDF] for the file type > select Adobe PDF Preset [PRESS QUALITY].
- [STEP 03] To create a JPG file, you should use [EXPORT] from file menu > select [EXPORT AS] > select [JPG] for the file type > click [EXPORT] > select the quality, resolution (150 ppi for low quality print).
 References
Curt, I. (2019, September 30). Quick tip: How to create an isometric grid in less than 2 minutes! Design & Illustration Envato Tuts+. Retrieved December 22, 2021, from https://design.tutsplus.com/tutorials/quick-tip-how-to-create-an-isometric-grid-in-less-than-2-minutes–vector-3831
Pyo, M., & Kim, S. (2012). Architectural and program diagrams: 1 Construction and design manual/editor [s], Miyoung Pyo, Seonwook Kim. (1., neue Ausg.. ed., Construction and design manual).
