
Part One. Image Search/ Diagramming/ Data Visualization
Chapter 4. Depthmap X – Data visualization
Upon completing this session, students will be able to:
- (CO 1) Understand the concepts of Space Syntax and the examples
- (CO 2) Ready for Space Syntax images
- (CO 3) Generate isovist, connectivity, and gate count graphics
 Session Highlights
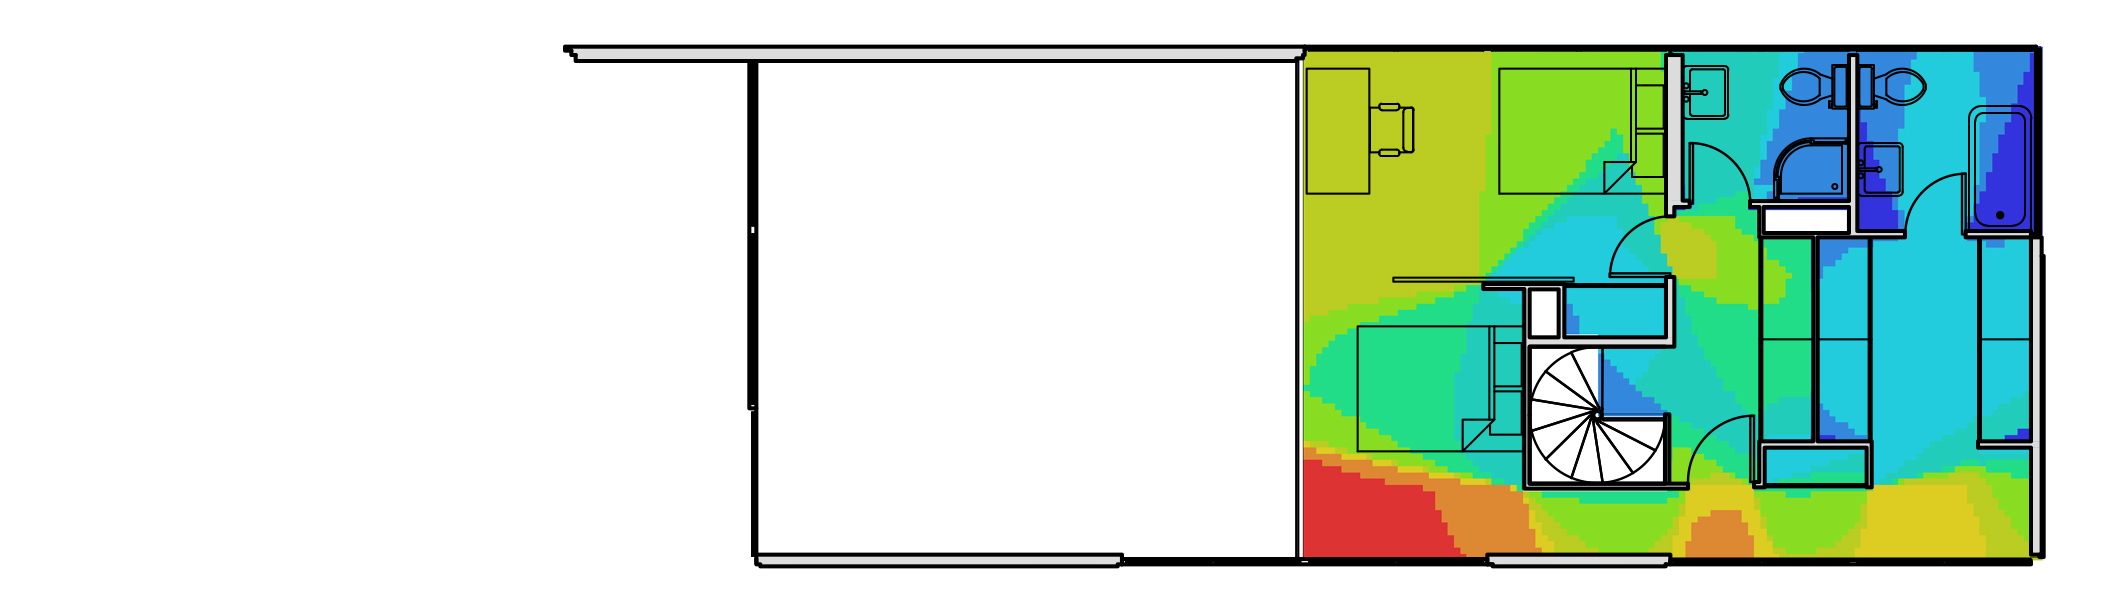
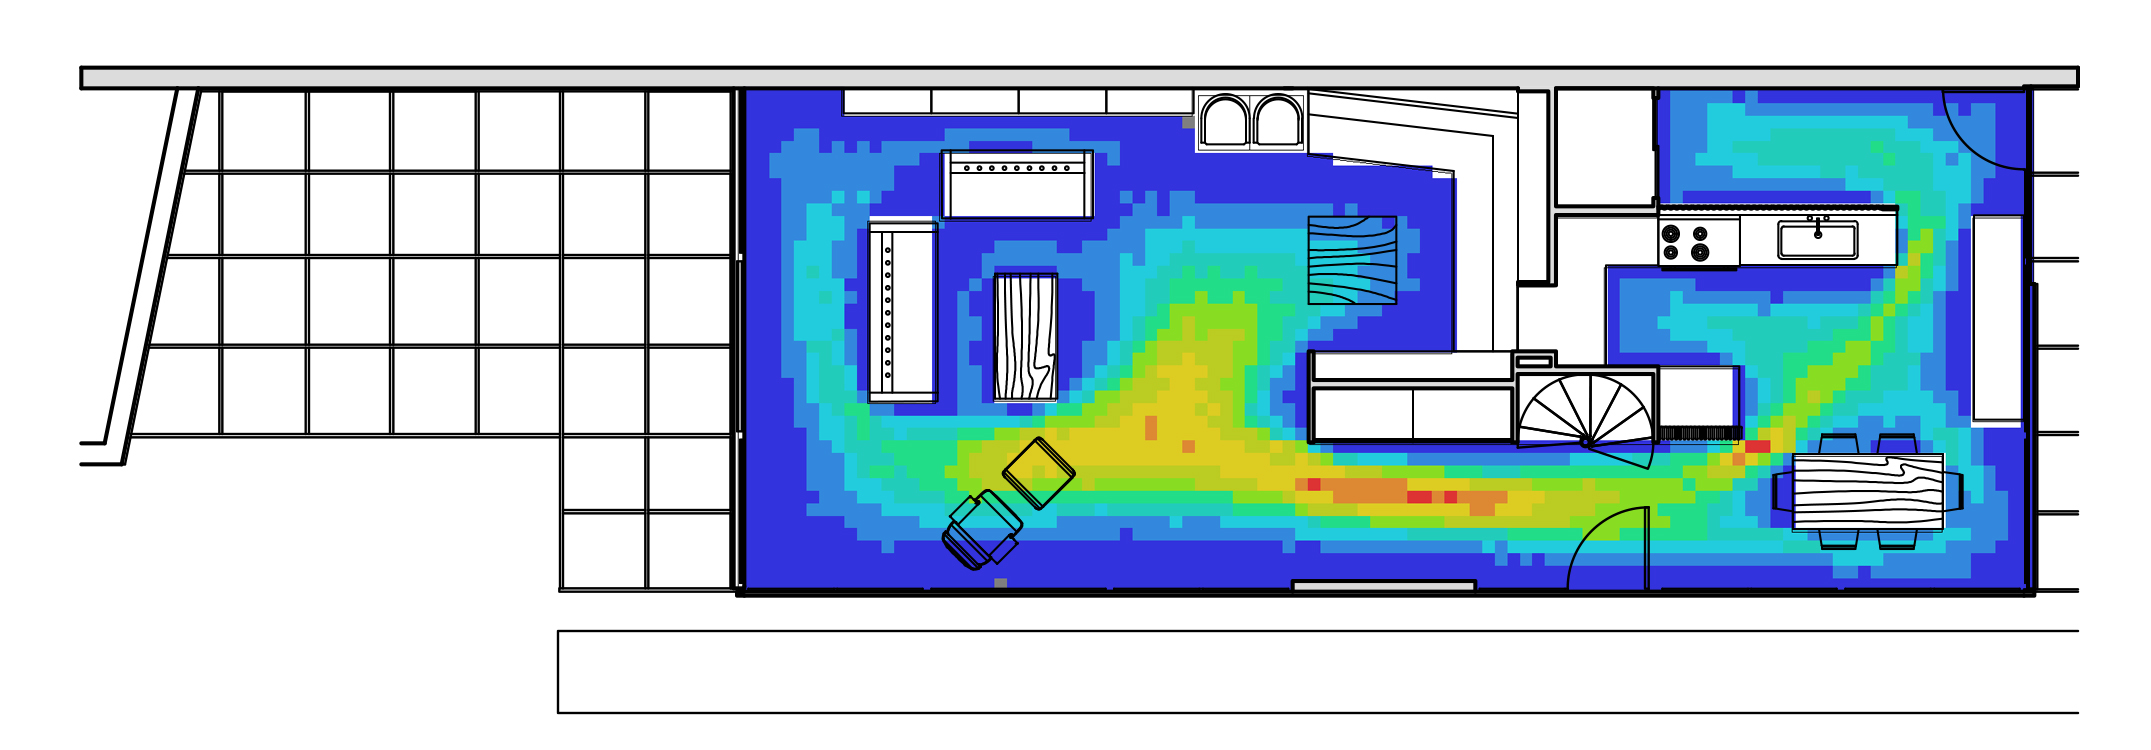
At the end of the session, students will be able to create the graphics below.
 Lecture Contents
(CO1) Understand the concepts of Space Syntax and the examples
What is Space Syntax
The term space syntax encompasses a set of theories and techniques for the analysis of spatial configurations. It was conceived by Bill Hillier, Julienne Hanson, and colleagues at The Bartlett, University College London in the late 1970s to early 1980s to develop insights into the mutually constructive relationship between society and space. As space syntax has evolved, certain measures have been found to correlate with human spatial behavior, and space syntax has thus come to be used to forecast the likely effects of architectural and urban space on users (Wikimedia Foundation, 2021, March 26).
Three assumptions
- Spaces can be broken down into components.
- Spaces can be analyzed as networks of choices.
- Spaces can be represented as maps and graphs to describe the connectivity and integration of spaces.
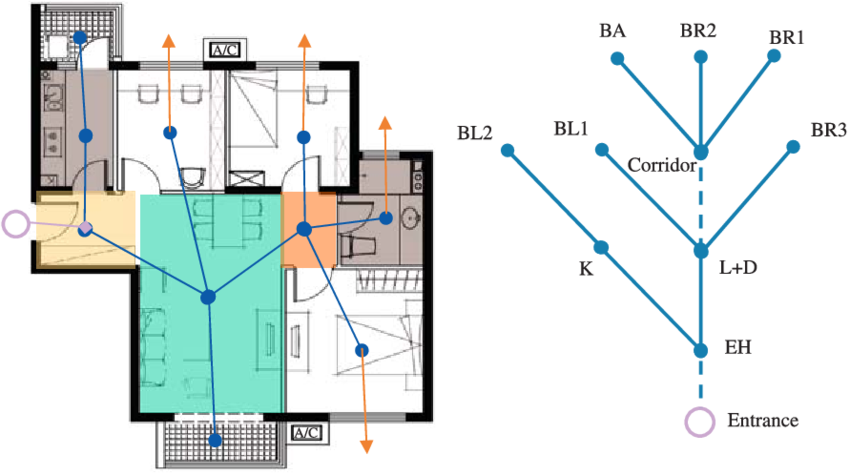
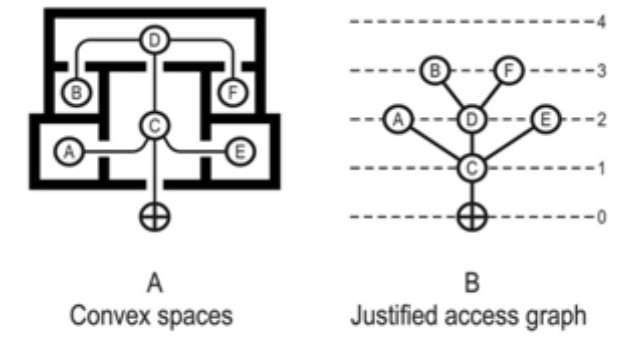
Three basic concepts in Space Syntax analysis
Convex space
(popularized by John Peponis, and his collaborators at Georgia Tech), an occupiable void where, if imagined as a wireframe diagram, no line between two of its points goes outside its perimeter: all points within the polygon are visible to all other points within the polygon.
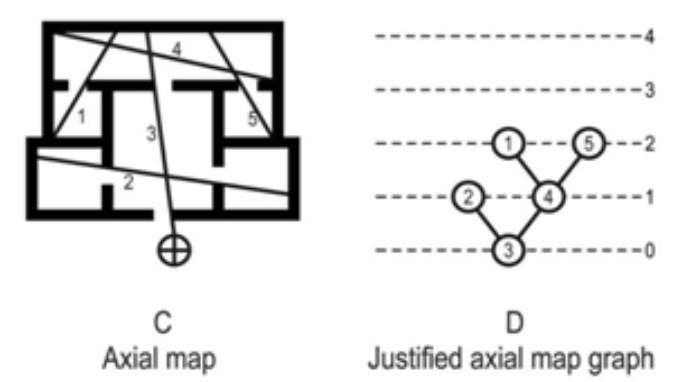
Axial space
(idea popularized by Bill Hillier at UCL), a straight sight-line and a possible path
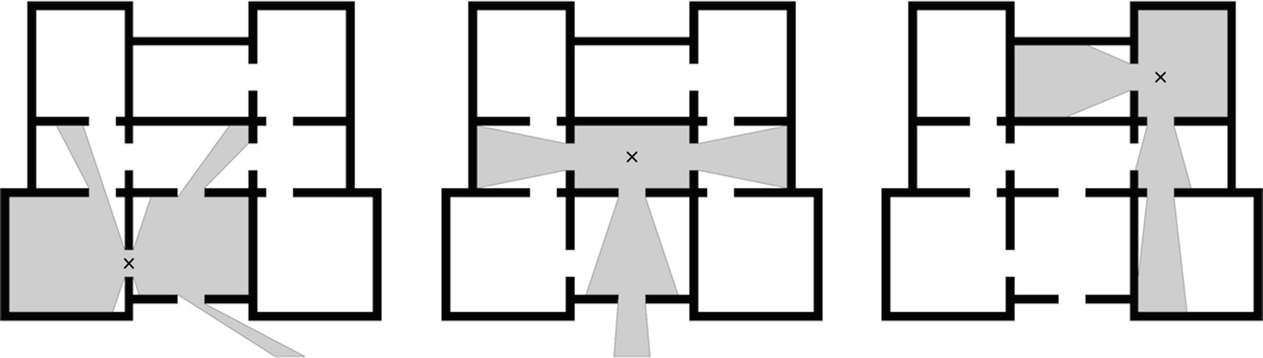
Isovist space
(popularised by Michael Benedikt at University of Texas), or viewshed or visibility polygon, the field of view from any particular point
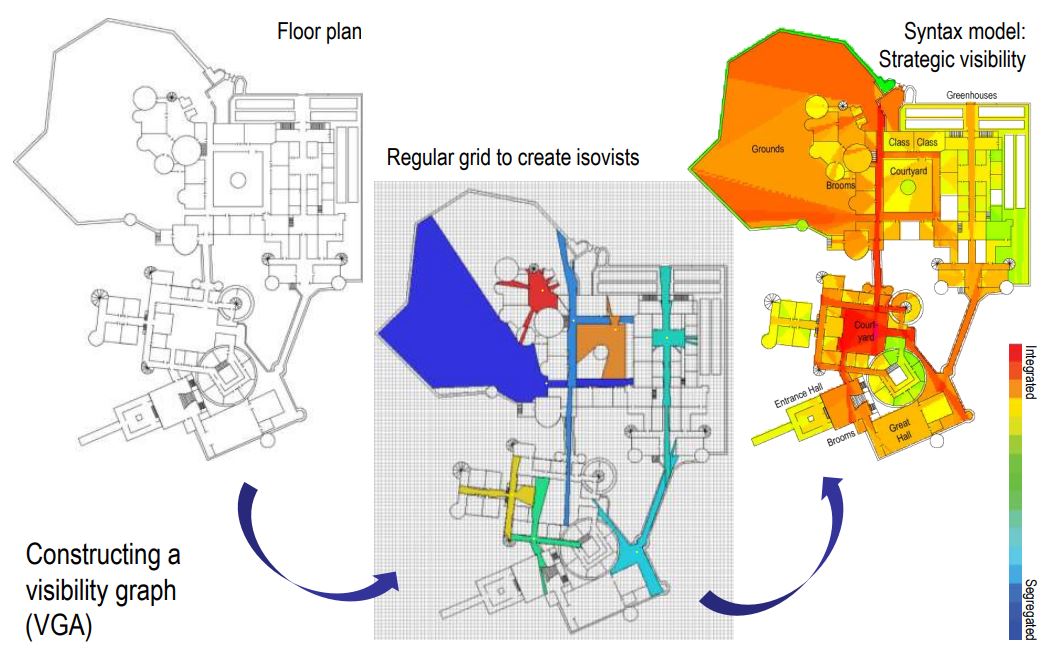
Visibility Graph Analysis (VGA)
In architecture, visibility graph analysis (VGA) is a method of analyzing the inter-visibility connections within buildings or urban networks. Visibility graph analysis was developed from the architectural theory of space syntax by Turner et al. (2001) and is applied through the construction of a visibility graph within the open space of a plan.
Visibility graph analysis was firstly implemented in Turner’s Depthmap software and is now widely used by both academics and practitioners through the open-source and multi-platform depthmapX developed by Tasos Varoudis (Sailer, K, 2016, February 3).
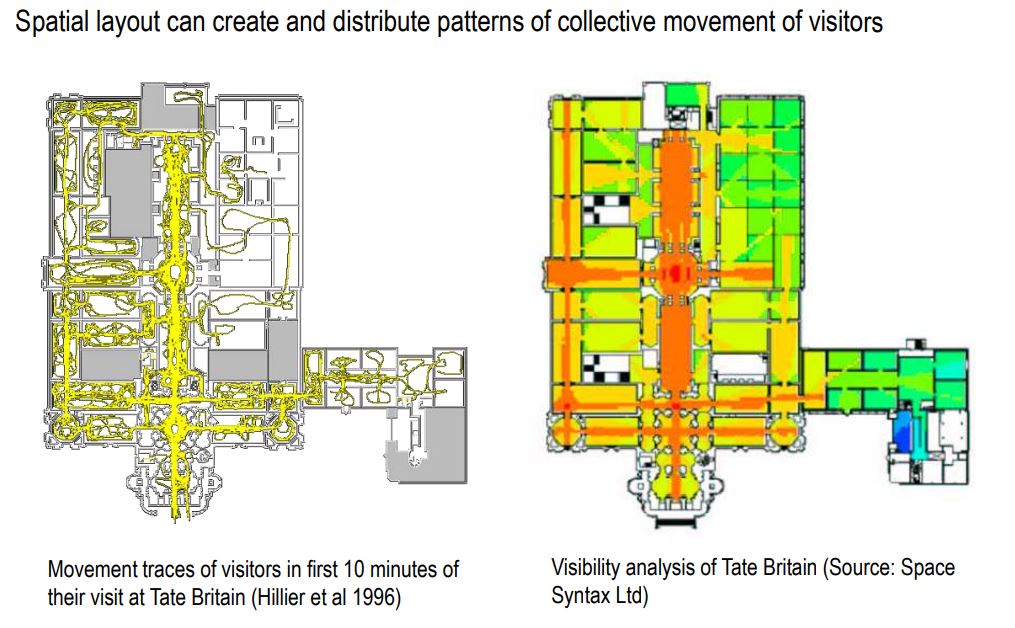
Why does it matter?
The main proposition of Space Syntax research: the character of social life within a space depends on its position within the fabric of a city or a building.
Integrated spaces: livelier and frequented by more people.
Segregated spaces: lesser frequentation.
Affects the patterns of copresence and encounters in space and thus the patterns of interaction between people (Sailer, K, 2016, February 3).
Software – Depthmap X
depthmapX is a multi-platform software platform to perform a set of spatial network analyses designed to understand social processes within the built environment. It works at a variety of scales from building through small urban to whole cities or states. At each scale, the aim of the software is to produce a map of open space elements, connect them via some relationship (for example, intervisibility or overlap), and then perform a graph analysis of the resulting network (UCL Space Syntax, n.d).
- Download the software from the Archtech website.
depthmapX-0.50-64bit-Windows.zip.
Unzip the file and open the [depthmapX 0.50-64bit.exe] file.
No installation is required for the application.
(CO2) Ready for Space Syntax images
In order to simulate in Depthmap X, your drawing needs to be ready for the application.
- [STEP 01A] If you use Revit for your project,
- Open a plan view(s).
- Show Walls, Windows, Doors, Furniture, Built-In Furniture.
- Export the view(s) in DWG file format to use in AutoCAD.
- [STEP 01B] If you use AutoCAD, Eames House_SS_Base_01.dwg.
- Hide all except Walls, Windows, Doors, Furniture, Built-In Furniture layers.
- Copy the elements that show in a separate CAD file.
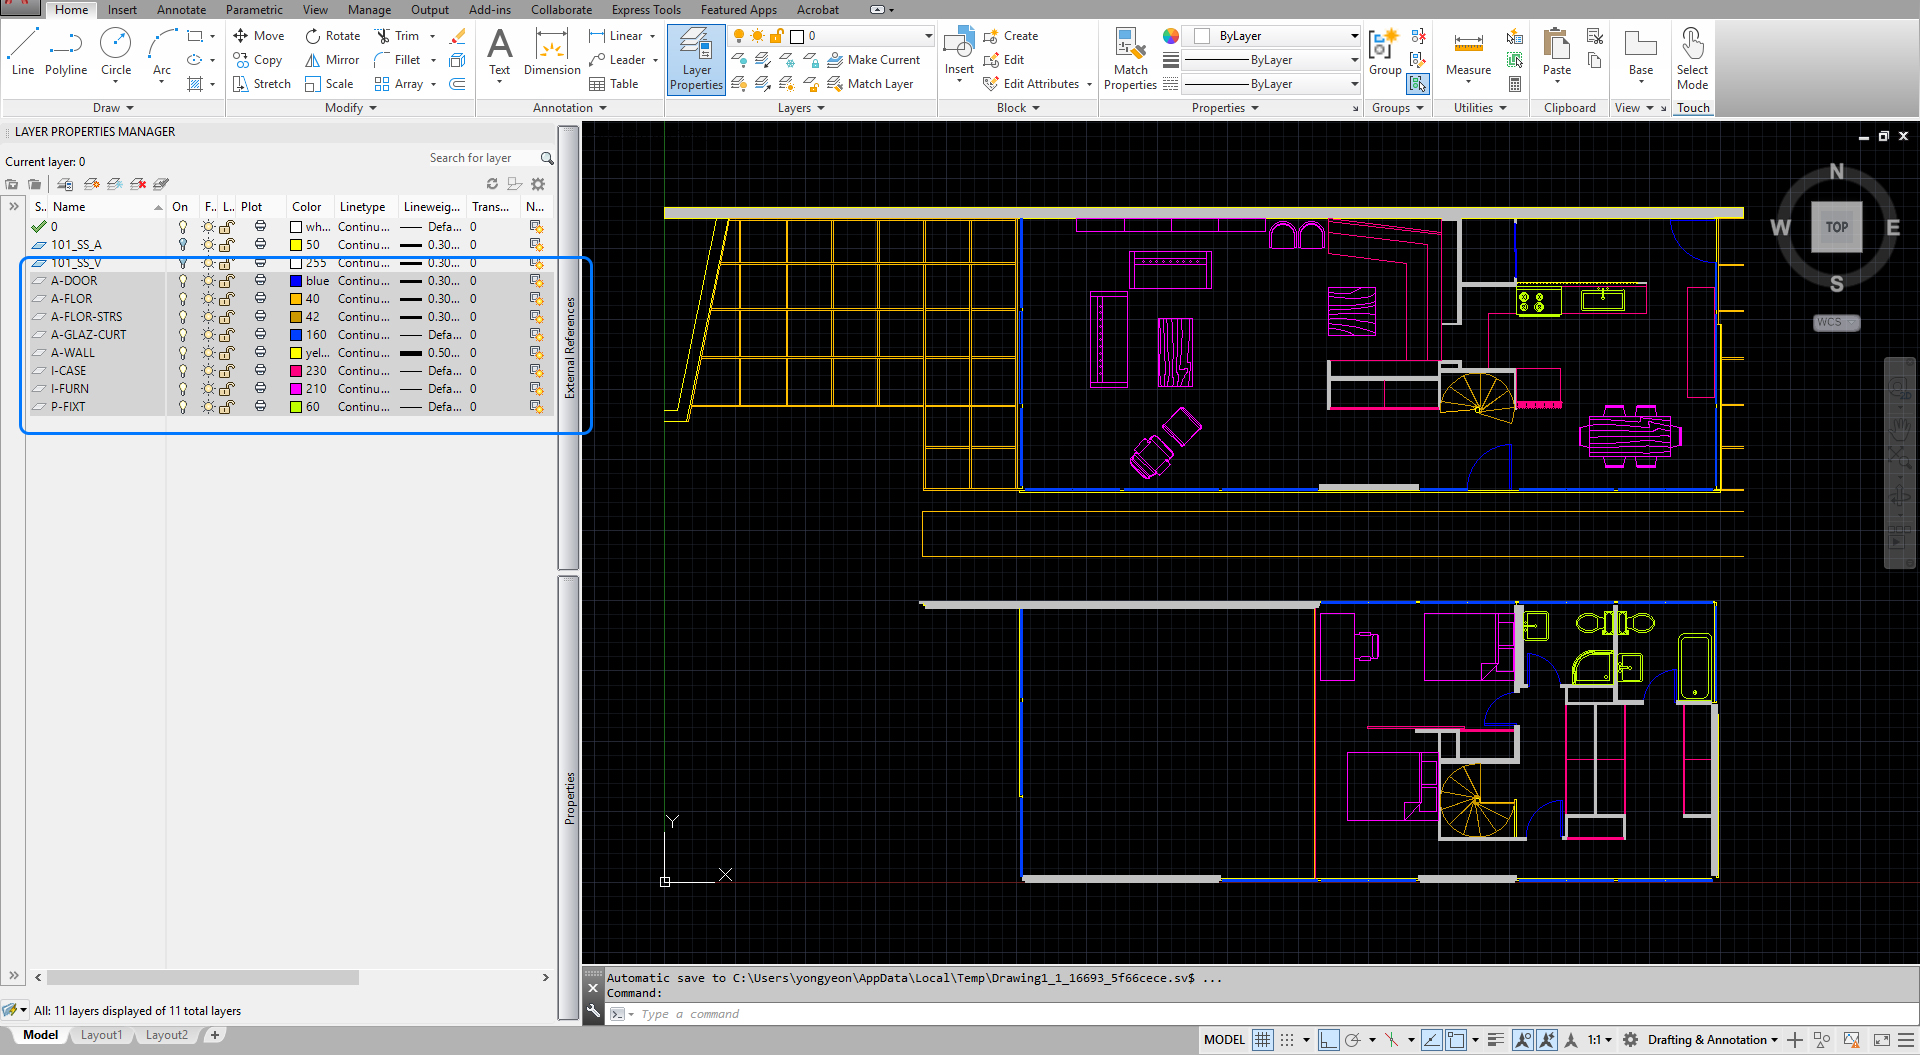
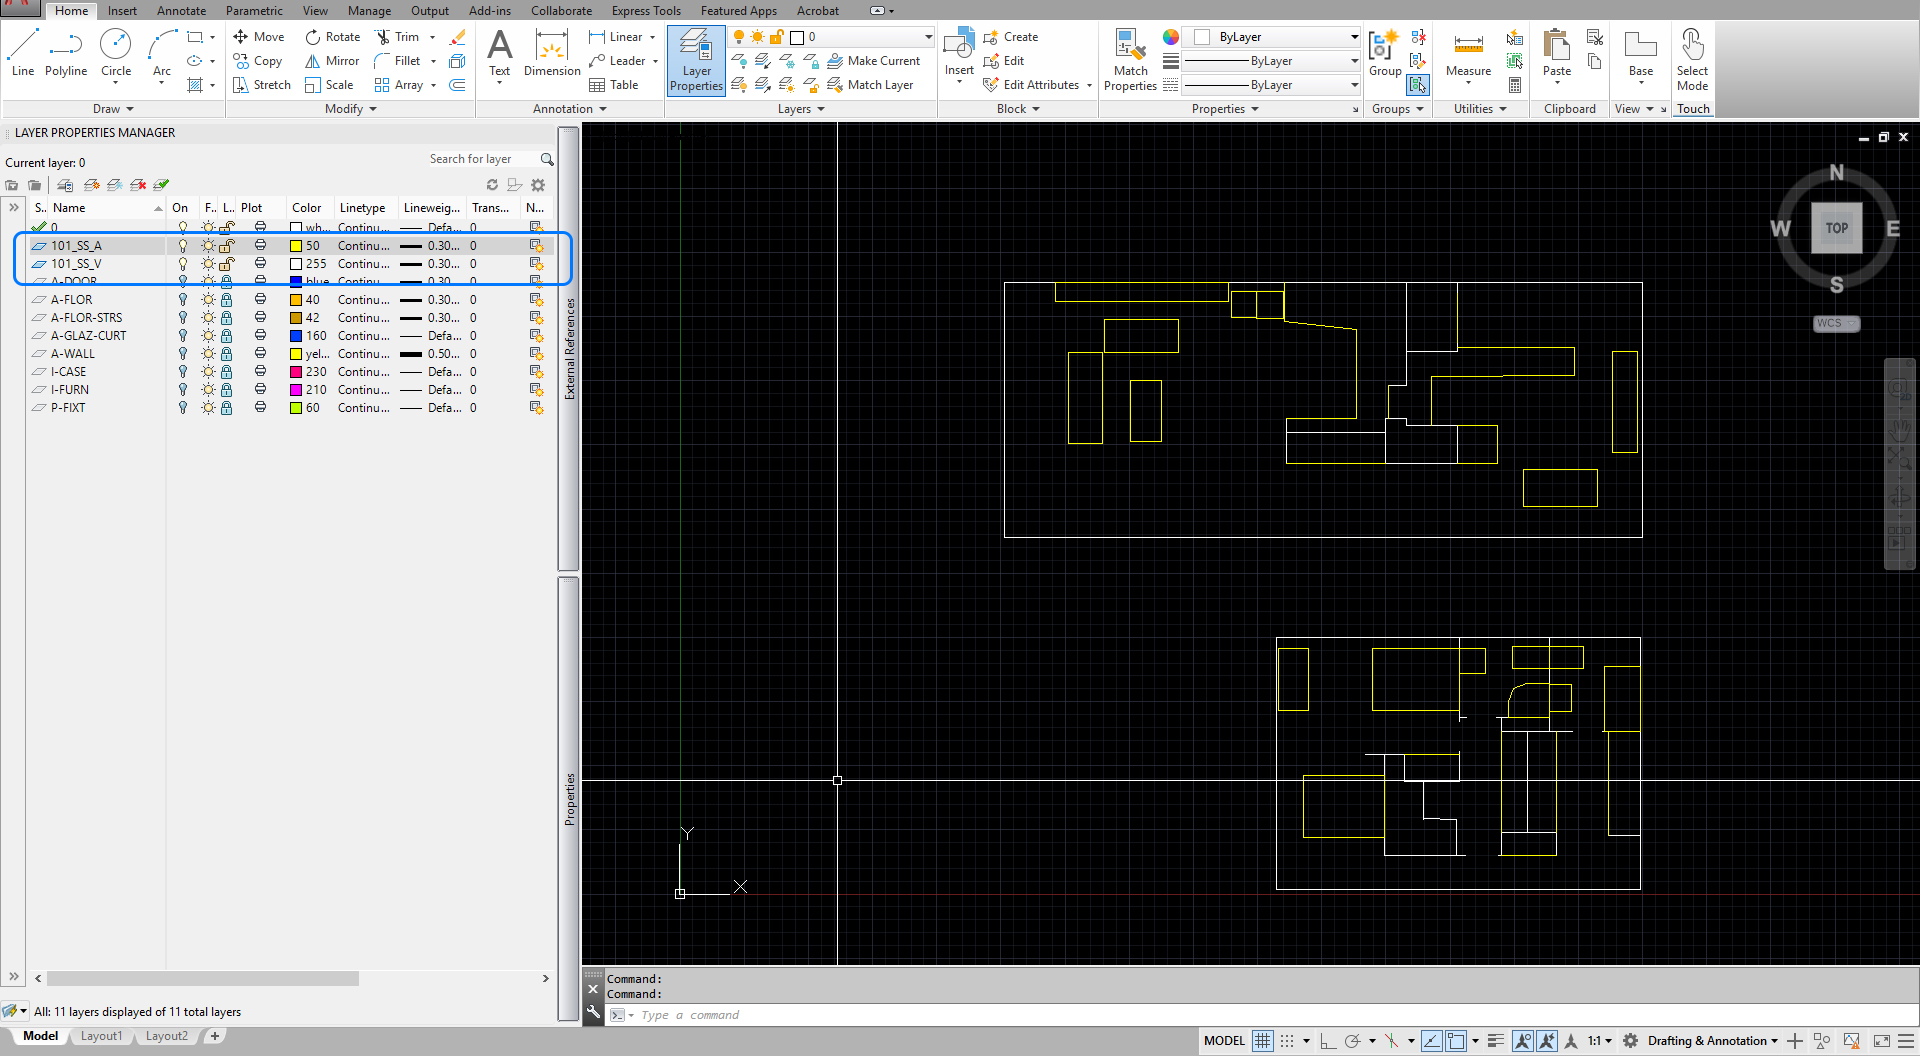
- [STEP 02] If the drawing is simple, you can use the files in depthmap X, but it is recommended to redraw the elements in separated layers (e.g., 101_SS_A, 101_SS_V,
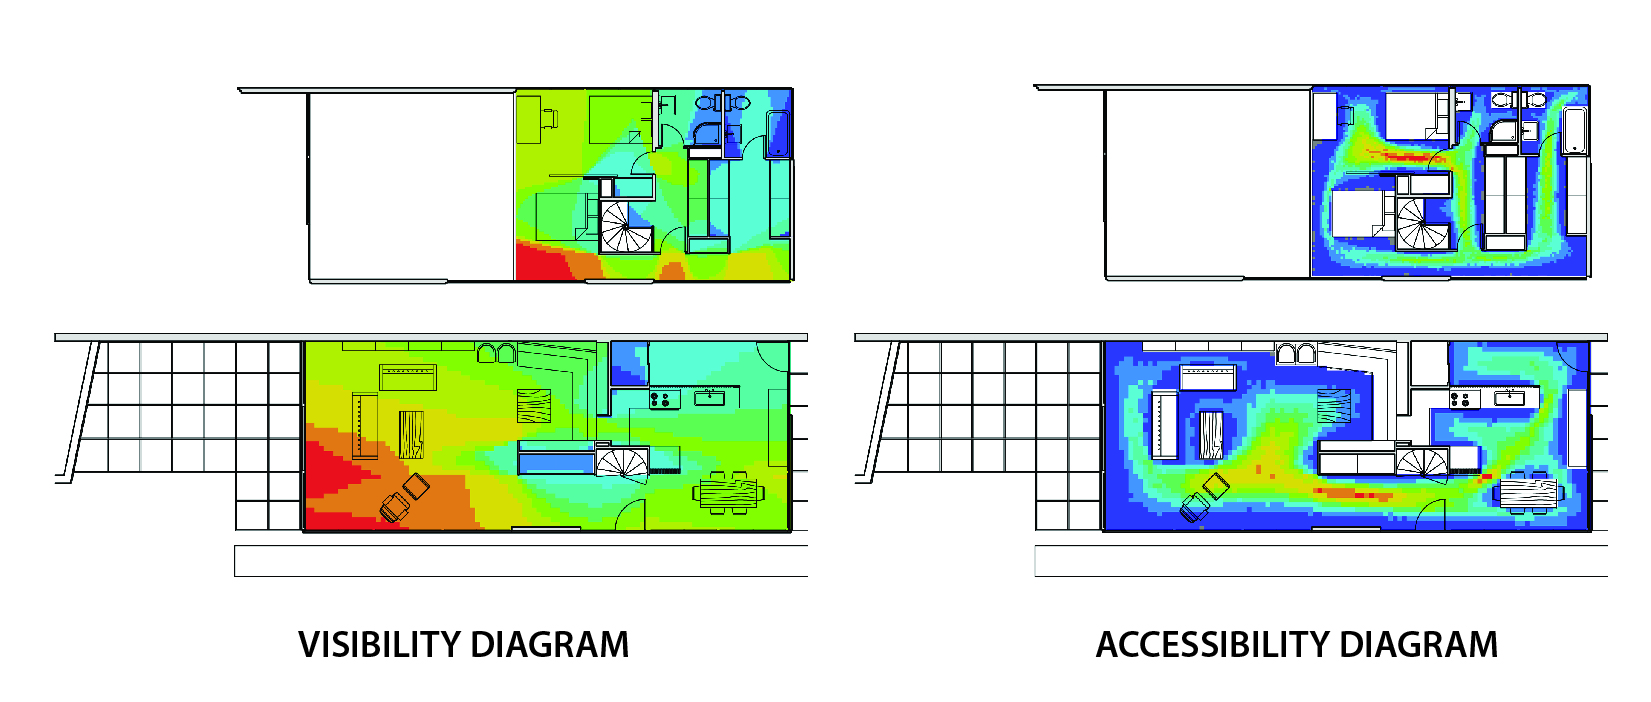
101_SS_A layer is for accessibility diagram, 101_SS_V layer is for visibility diagram, you can set a different color for the layers).- Building envelop(s) should be closed – 101_SS_V layer.
- Interior walls should be no thickness (just a single line) – 101_SS_V layer.
- Doors should be open (no line required).
- Interior windows(glassing) should be no thickness – 101_SS_A layer.
- Furniture (movable) should not be drawn.
- Furniture (stationary) should be drawn in simple lines – 101_SS_A layer.
- Built-In Furniture should be drawn in simple lines – 101_SS_A layer.
- [STEP 03] Create two files by copying the drawn elements.
One is for a visibility diagram.
- Including 101_SS_V layer only.
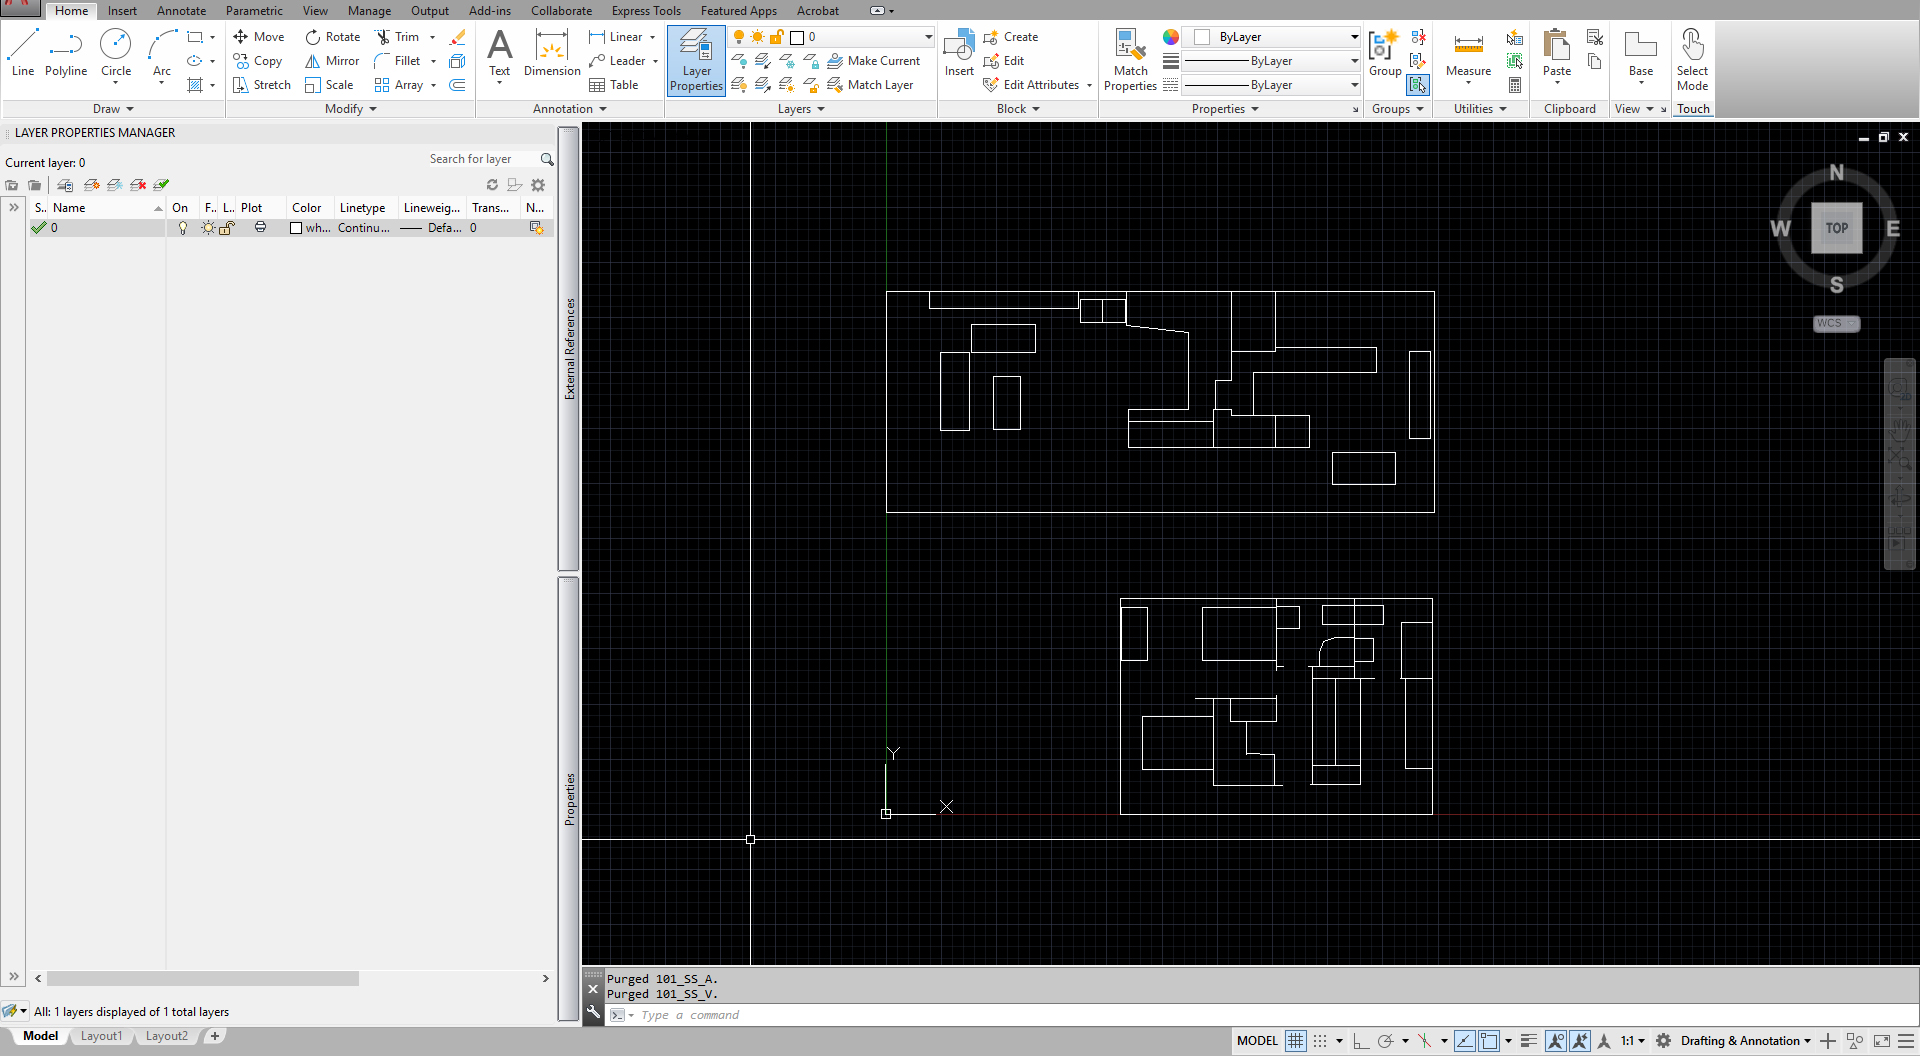
- Merge all elements into the [0] layer.
- Use the [Purge] command to clean up layers.
- Export the file in DXF file format.

- Duplicate the DXF file and change the names by level.
- Open the files and delete unnecessary parts (For example, the file is for the 1st level, delete the 2nd level elements).
The other is for an accessibility diagram
- Including both 101_SS_A and 101_SS_V layers.
- Merge all elements into the [0] layer.
- Use the [Purge] command to clean up layers.
- Export the file in DXF file format.
- Duplicate the DXF file and change the names by level.
- Open the files and delete unnecessary parts (For example, the file is for 1st level, delete the 2nd level elements).
(CO3) Generate isovist, connectivity, and gate count graphics
Open depthmapX by double-clicking [depthmapX 0.50-64bit.exe].
You must click [OK] for the License.
Create a Visibility diagram
- [STEP 01] Click the [New] icon from the [MAIN] panel to create a new file.
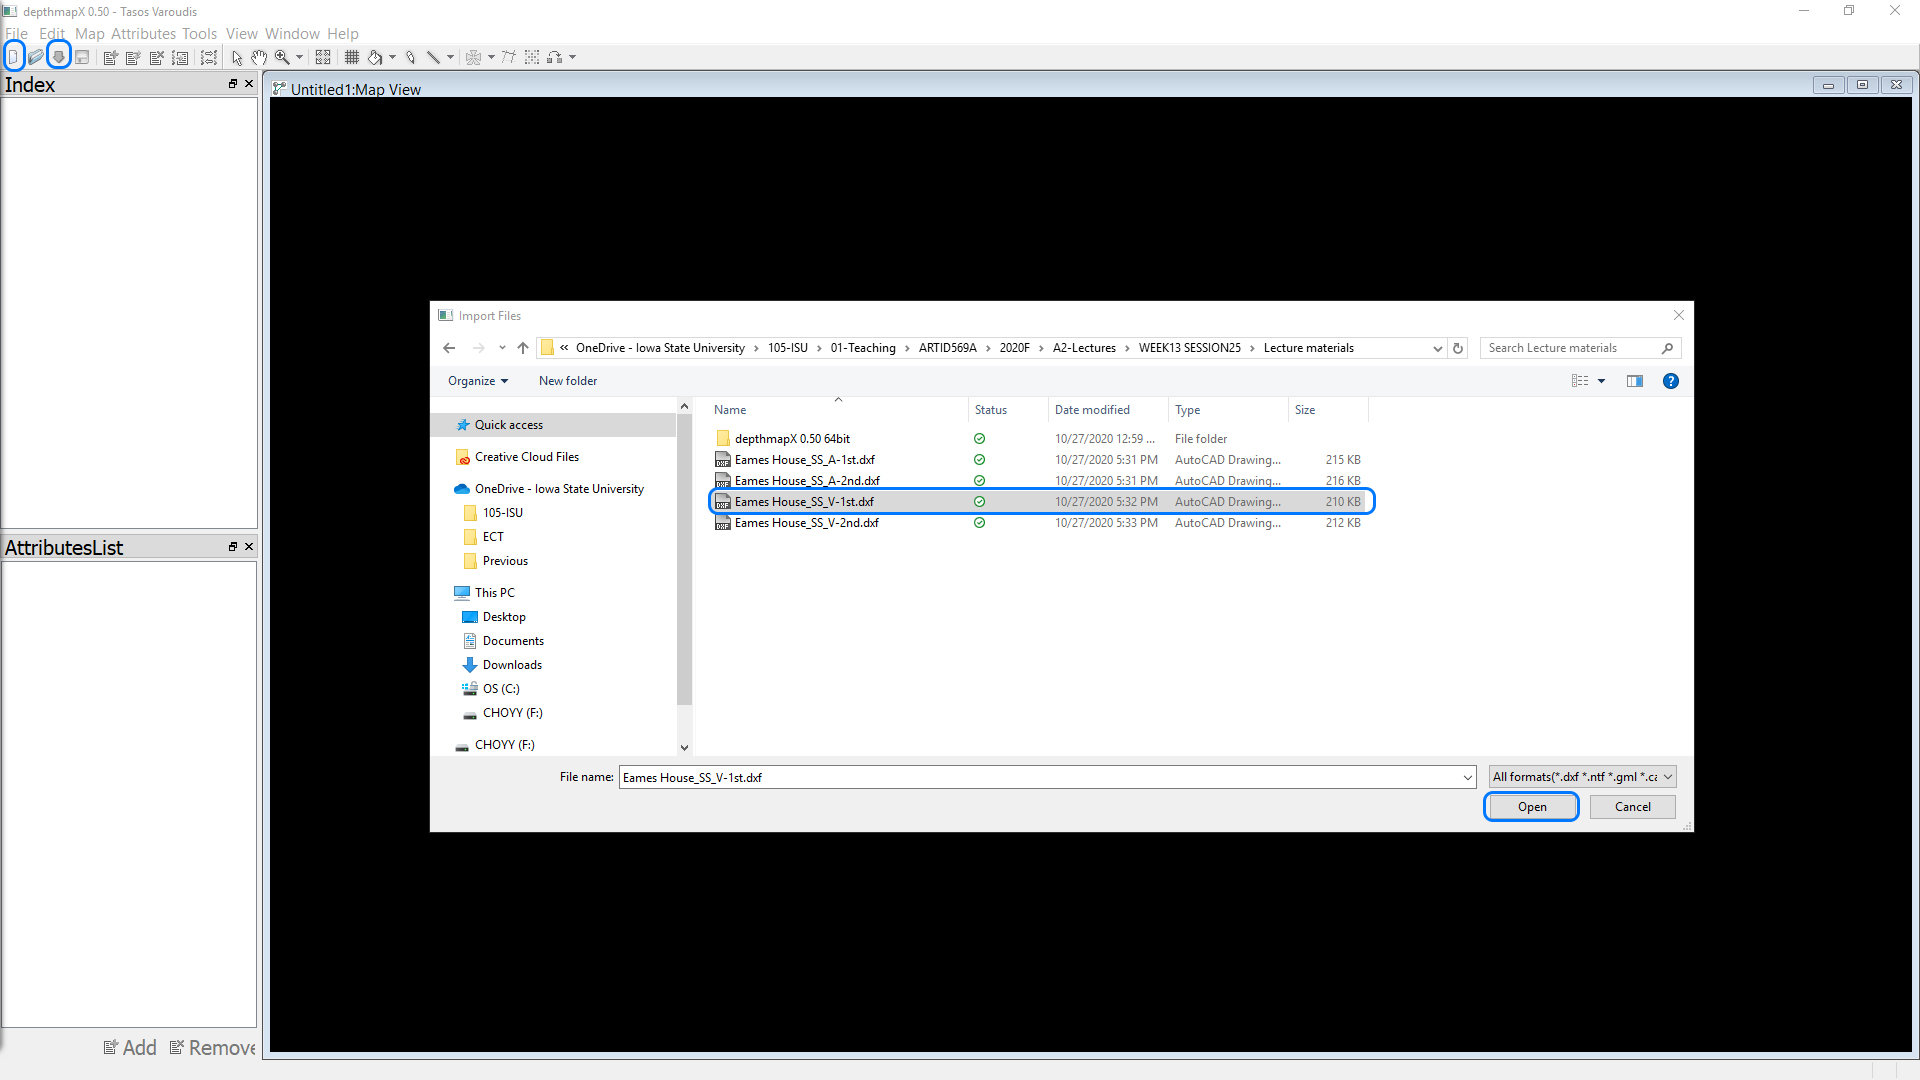
- [STEP 02] Click the [Import] icon from the [MAIN] panel to import [Eames House_SS_V-1st.dxf].
- [STEP 03] Select [Eames House_SS_V-1st.dxf] file and click [Open].
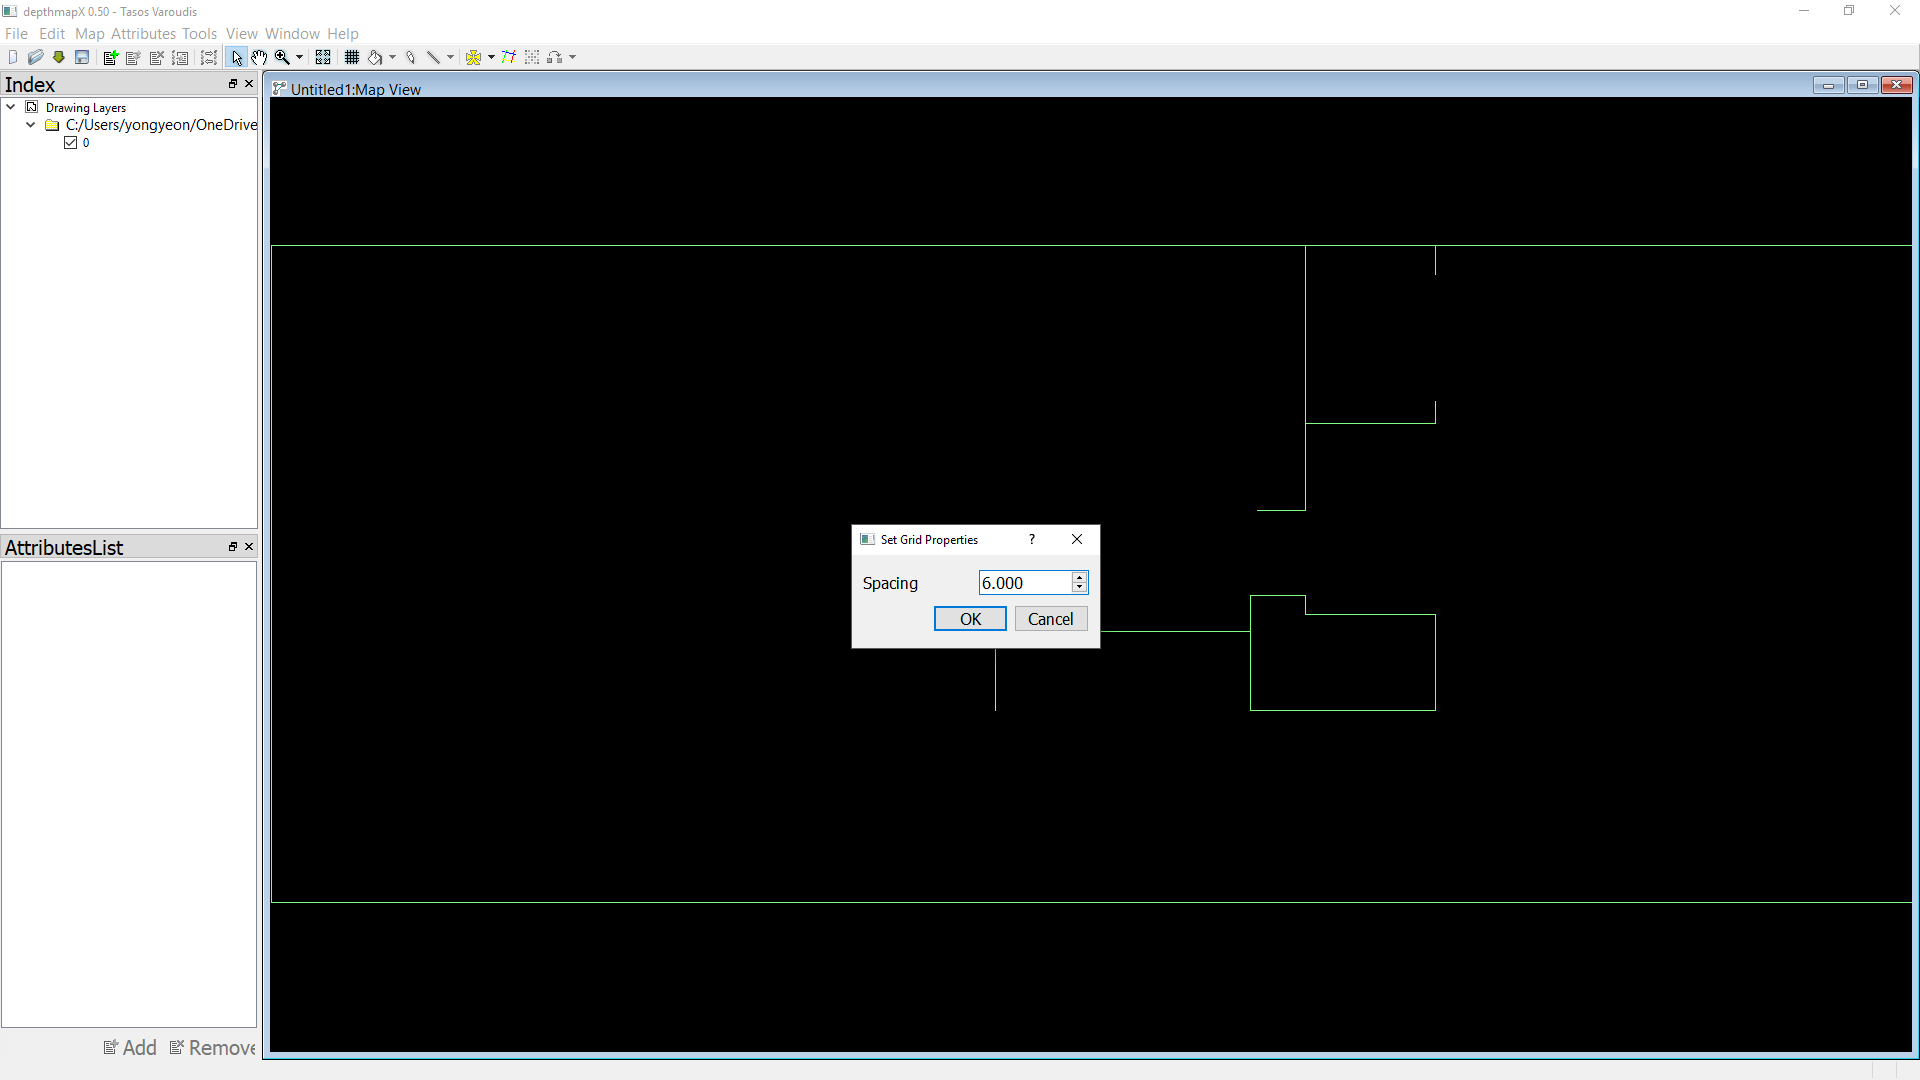
- [STEP 04] Click the [Set Grid] icon from the [Main] panel to create grids. The software will analyze your drawing within/by the grids that you created.
The spacing can be smaller, can be larger. If you set the grid smaller, you will get better graphics, but it will take more time; sometimes, you may get an error. If you set the grid larger, you will get low-quality graphics, but it will speed up your work.
Tips, If the project size is considered in a big-size project, double up the number you get from the default. If the project size is considered in a small-size project, use the number that the software provides.
- [STEP 05] Once the grid is set, click the [Fill] icon (looks like paint bucket) from the [Main] panel to designate the area you want to analyze > Click one of the grids that you want to analyze.
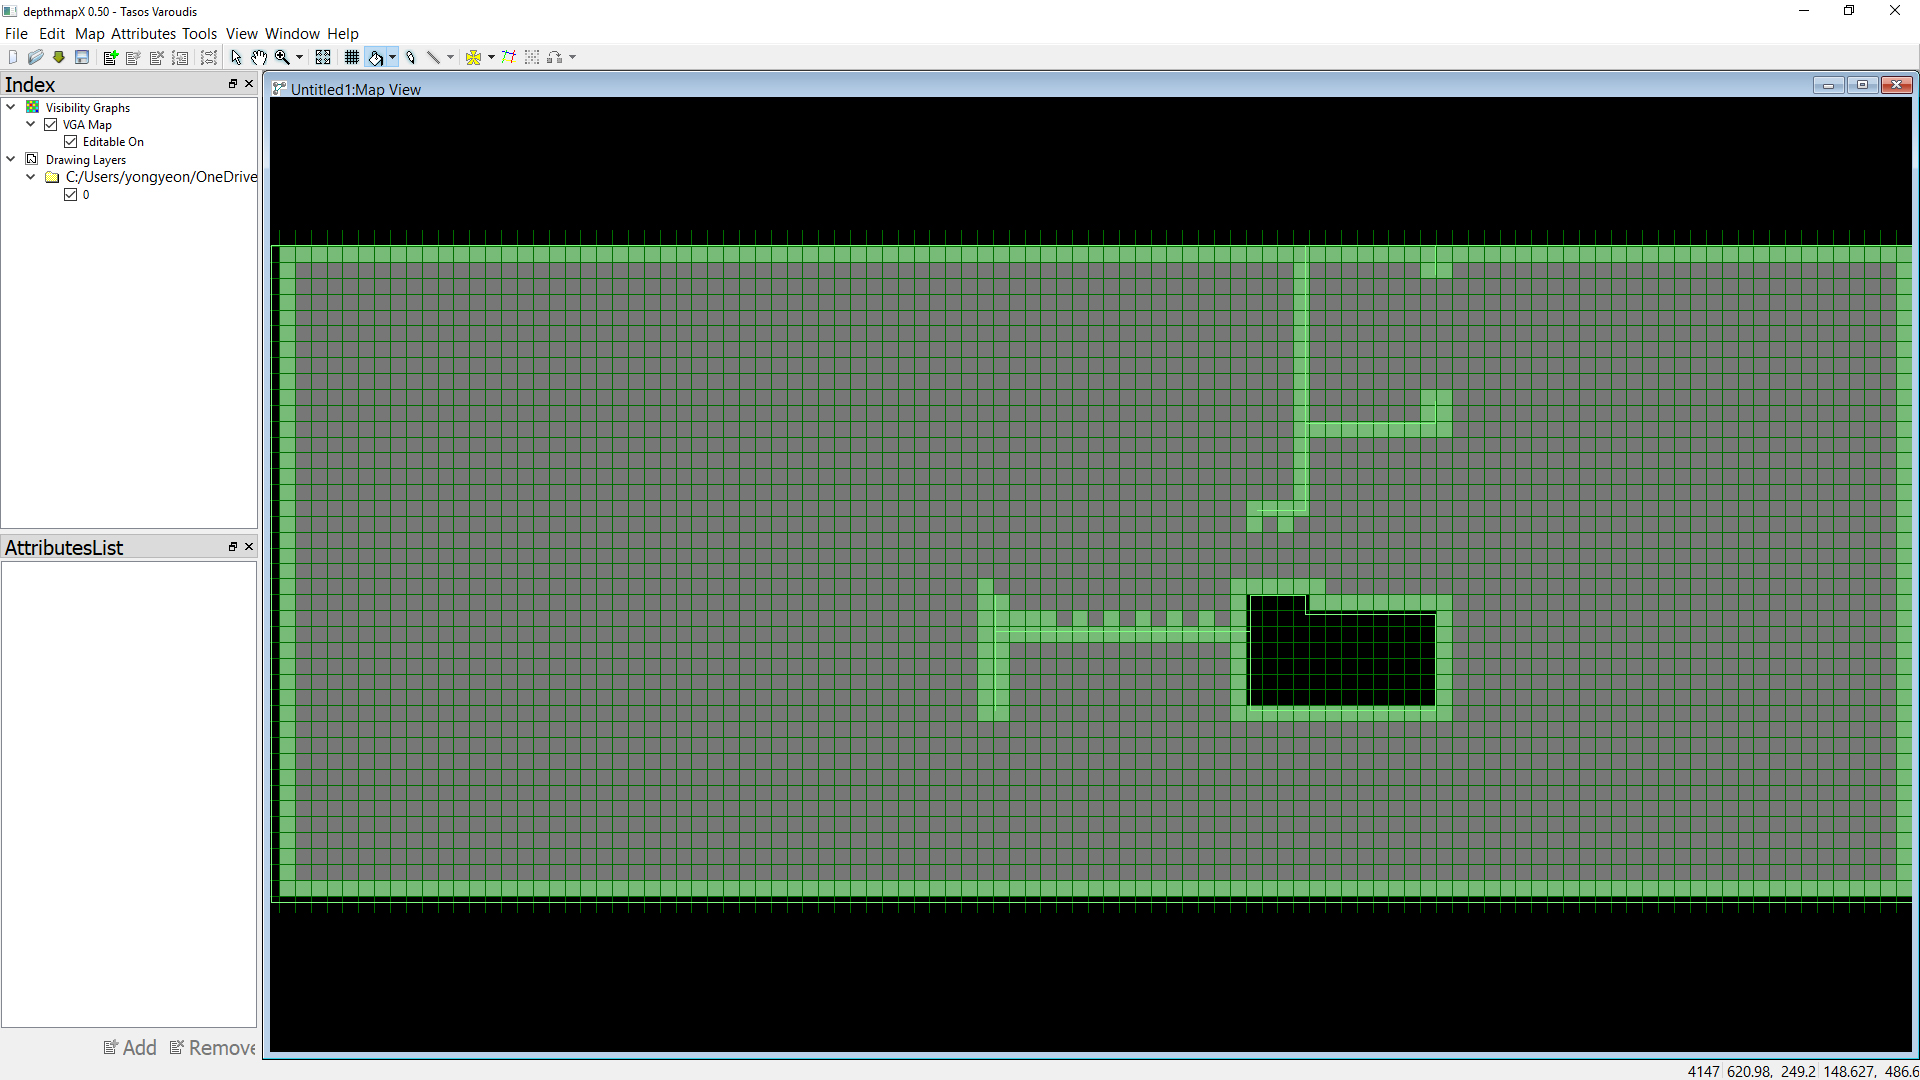
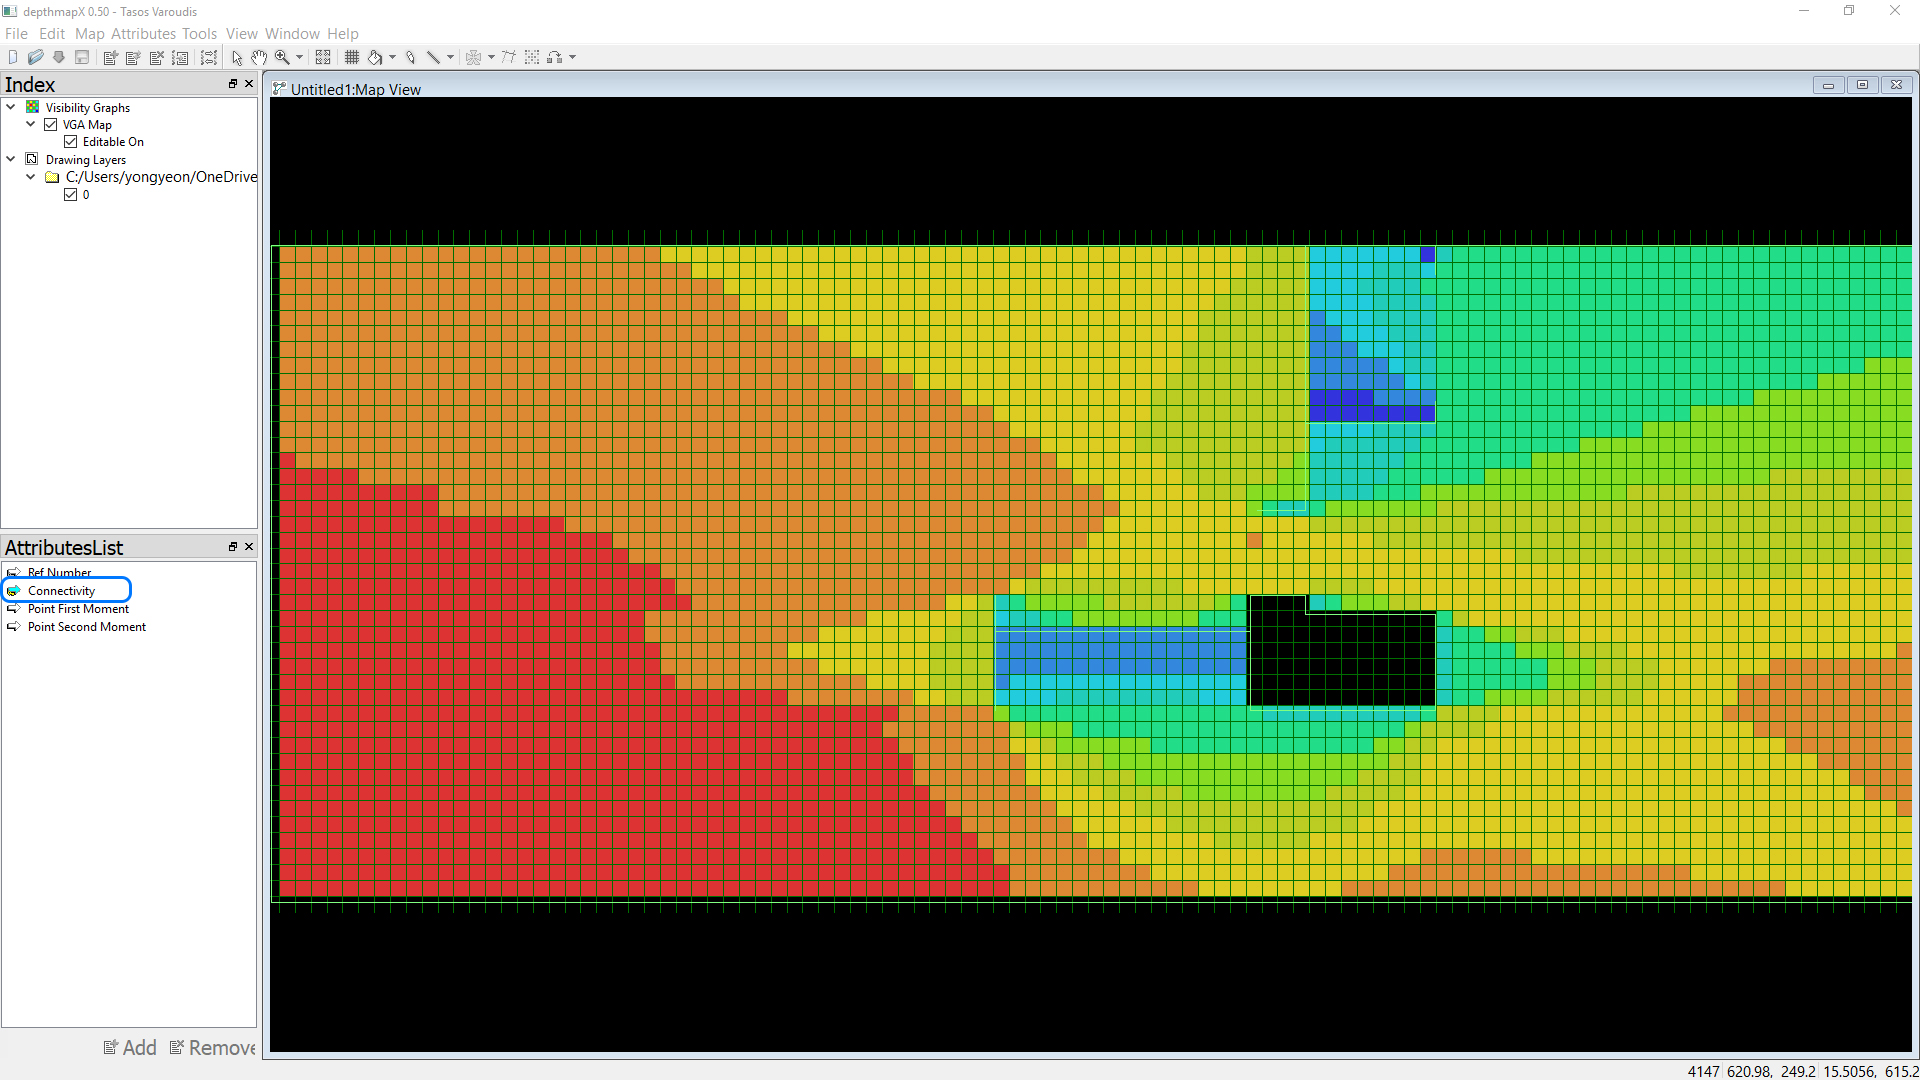
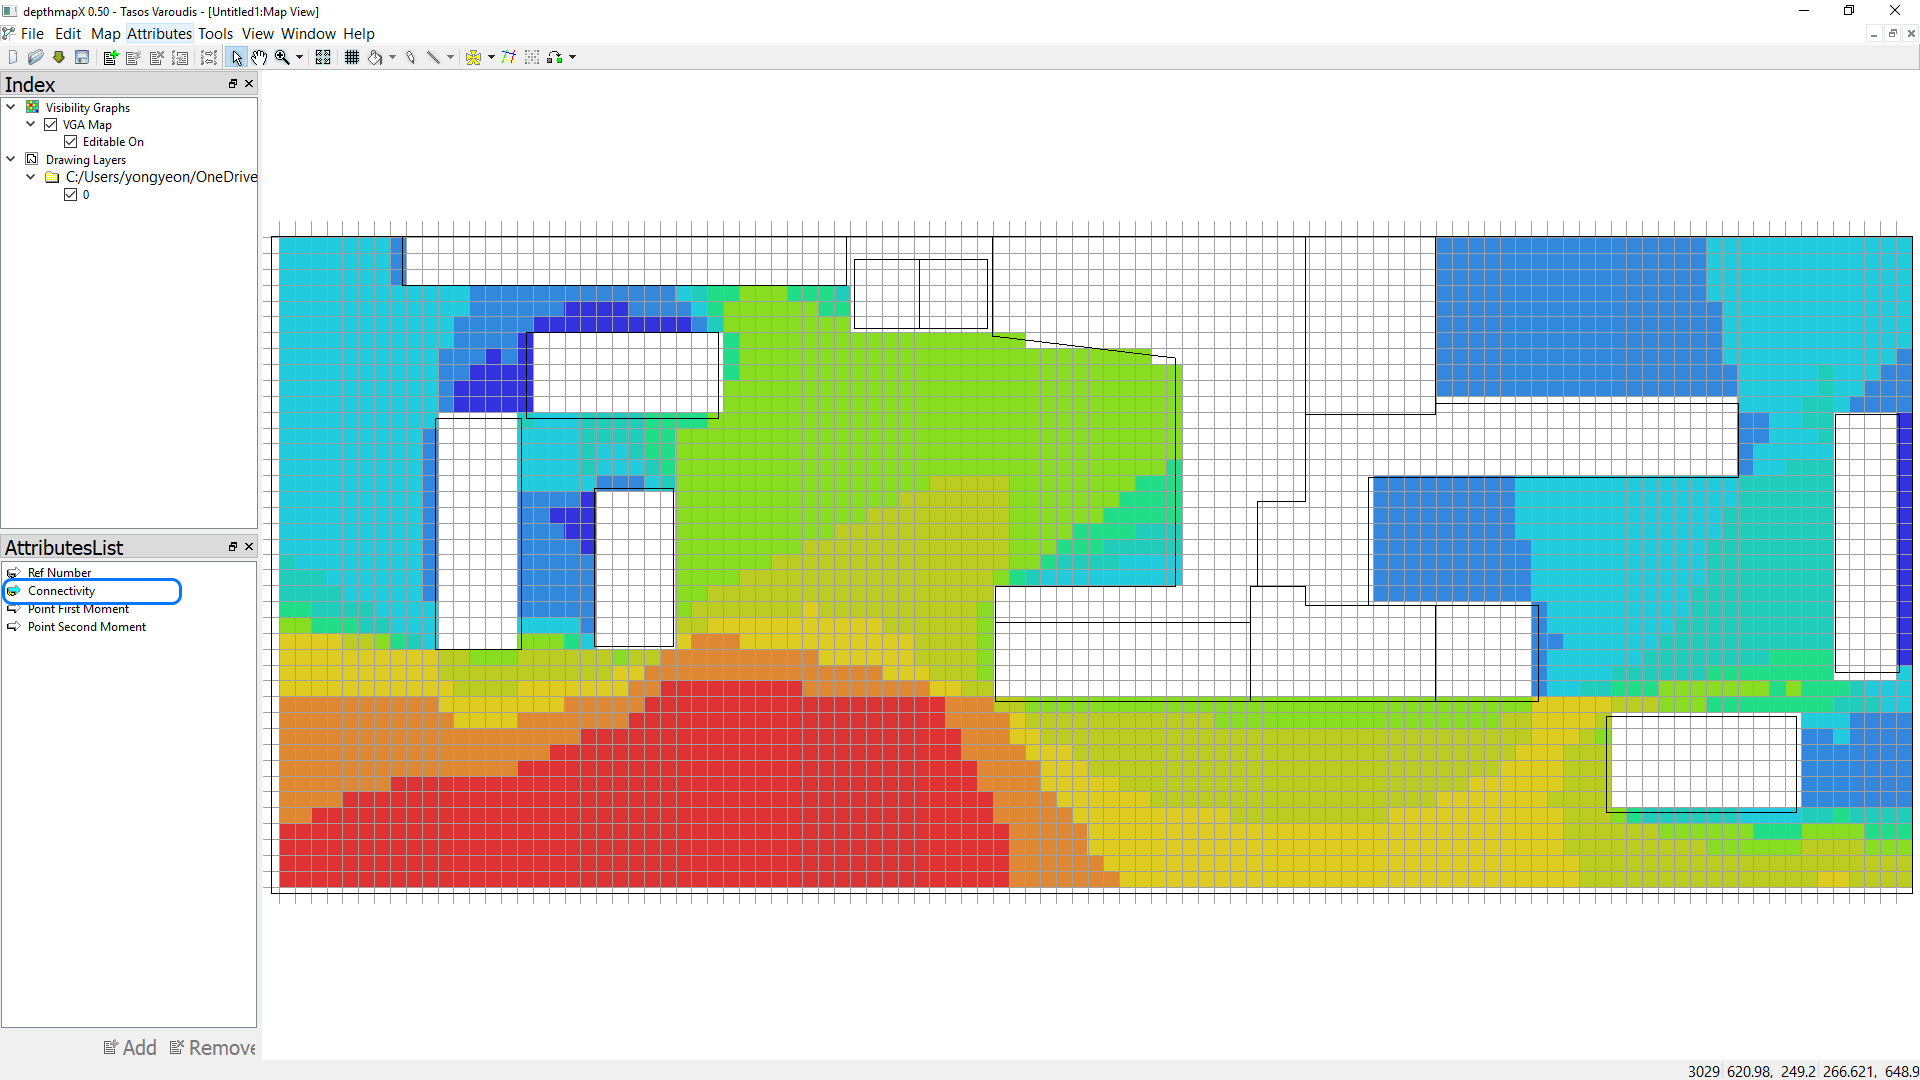
- [STEP 06] Click [TOOL] from the menu > Click [Visibility] > Click [Make Visibility Graph…] > Uncheck all from the options > Click [OK] > You will get [Connectivity] result.
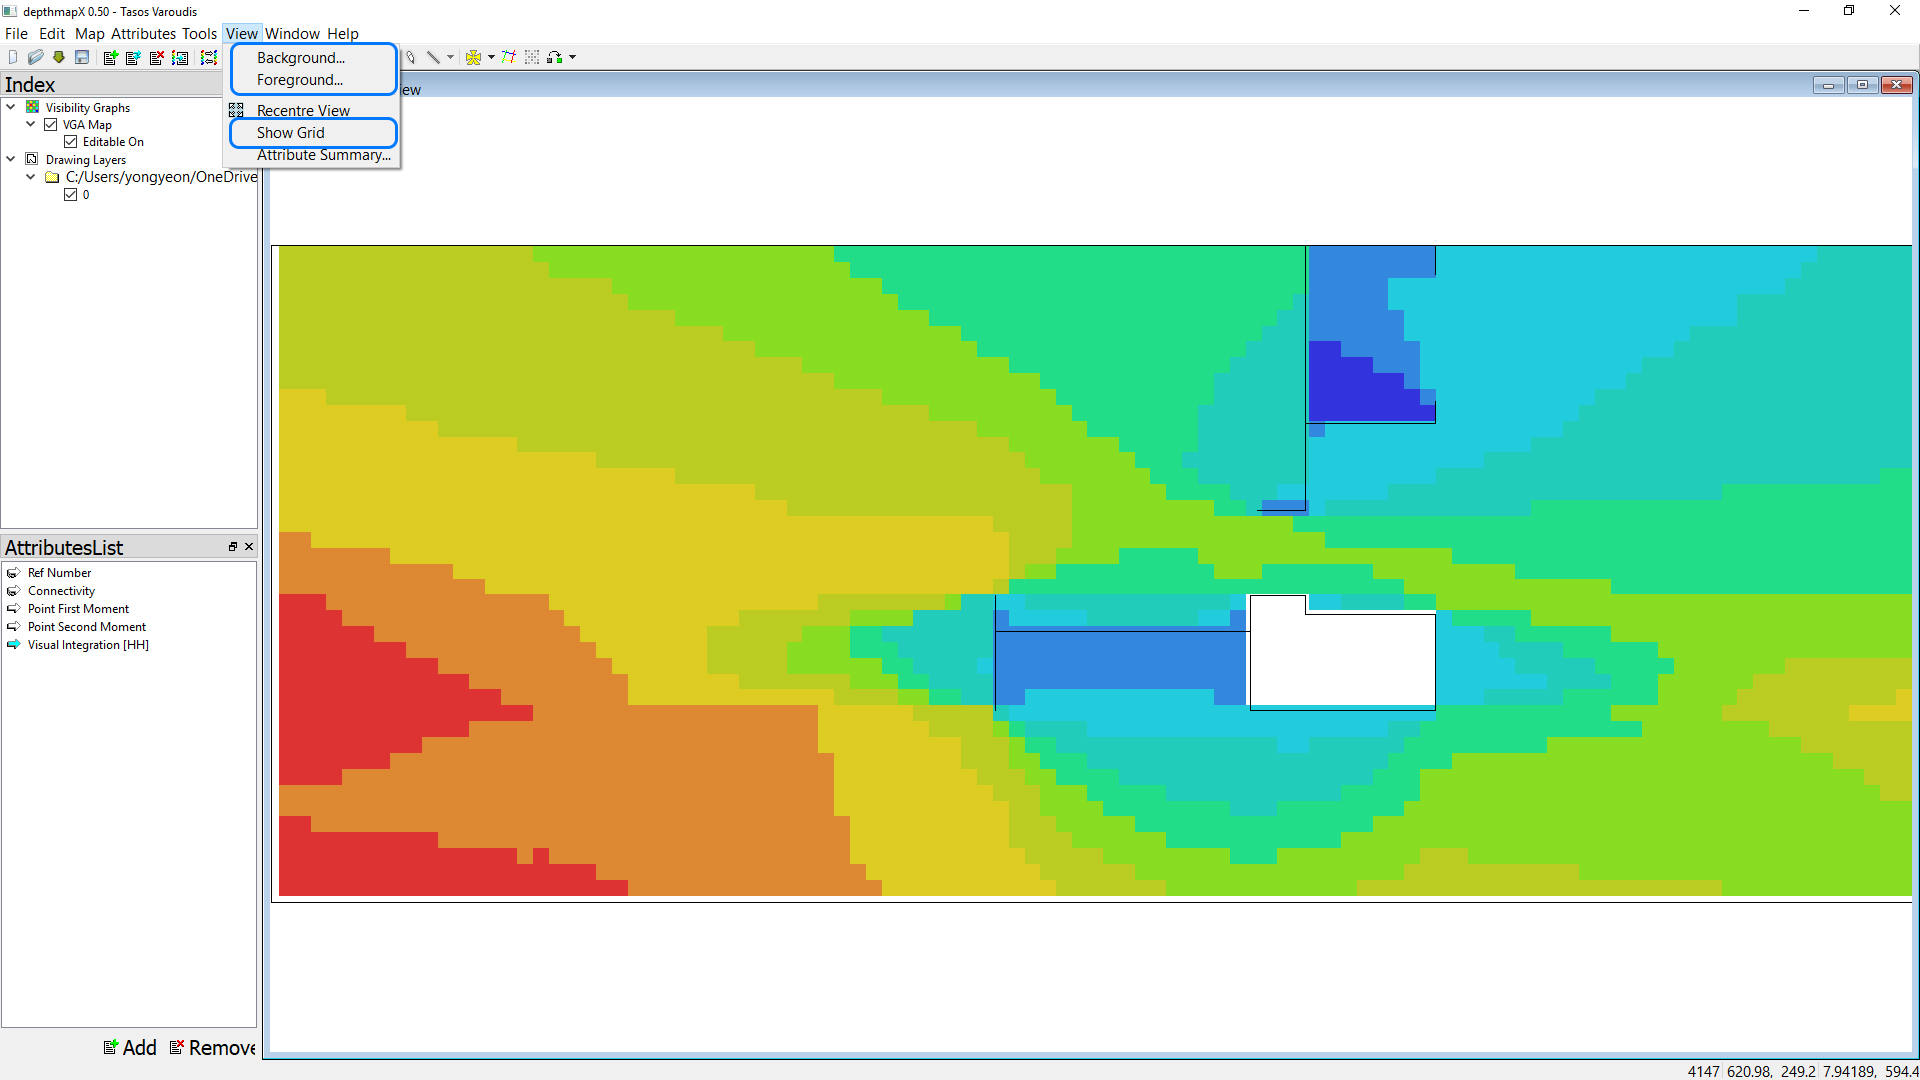
- [STEP 07] In order to get the visibility diagram, Click [Tool] from the menu > Click [Visibility] > Click [Run Visibility Graph analysis] > Check [Calculate visibility relationships], Check [Include global measure], enter [n] for [Select radius] the Analysis options > Click [OK] > You will get [Visual integration] result.
![It presents the visual integration] result.](https://iastate.pressbooks.pub/app/uploads/sites/53/2021/07/13-25-3-05-V-Visual-integration.jpg)
- [STEP 08] If you want to change the background color and line color, click the [View] menu > Click one of the menus> Change the setting. You also turn on/off the grids.
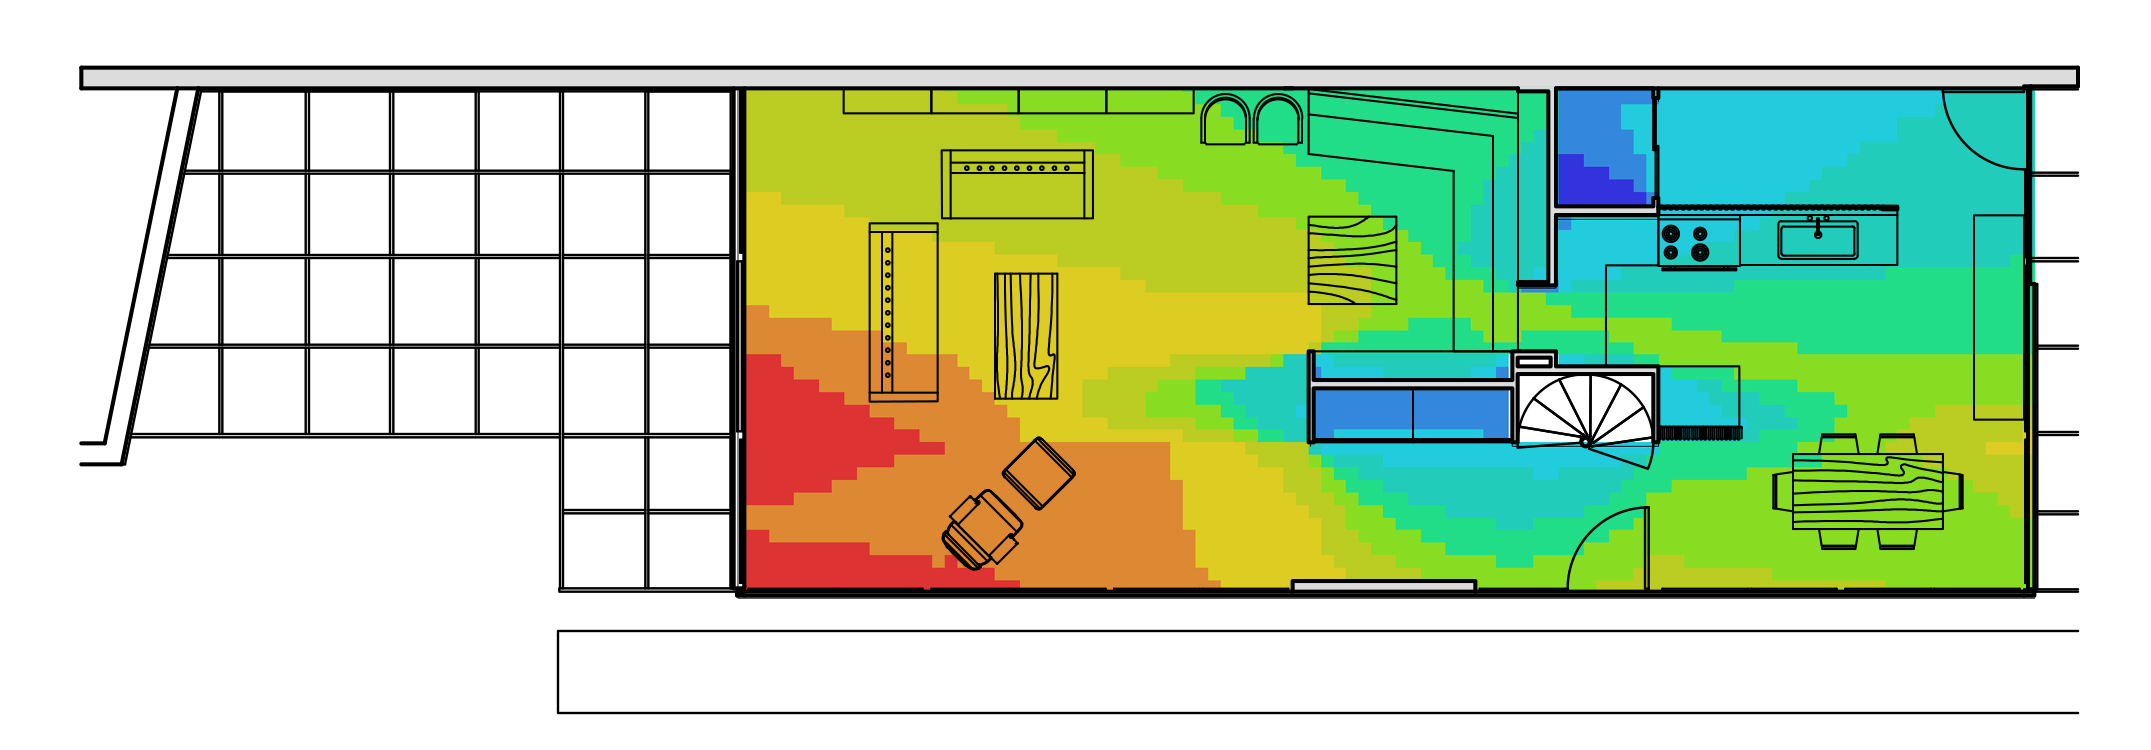
- [STEP 09] As far as I know, there is no export function on this software. So, it would be best if you screened capture to use the image. I recommend overlaying with the floor plan in Photoshop.
Create an Accessibility diagram
- [STEP 01] Click the [New] icon from the [MAIN] panel to create a new file.
- [STEP 02] Click the [Import] icon from the [MAIN] panel to import [Eames House_SS_A-1st.dxf].
- [STEP 03] Select [Eames House_SS_A-1st.dxf] file and click [Open].
- [STEP 04] Click the [Set Grid] icon from the [Main] panel to create grids.
- [STEP 05] Once the grid is set, click the [Fill] icon (looks like a paint bucket) from the [Main] panel to designate the area you want to analyze > Click one of the grids that you want to analyze.
- [STEP 06] Click [TOOL] from the menu > Click [Visibility] > Click [Make Visibility Graph…] > Uncheck all from the options > Click [OK] > You will get [Connectivity] result.
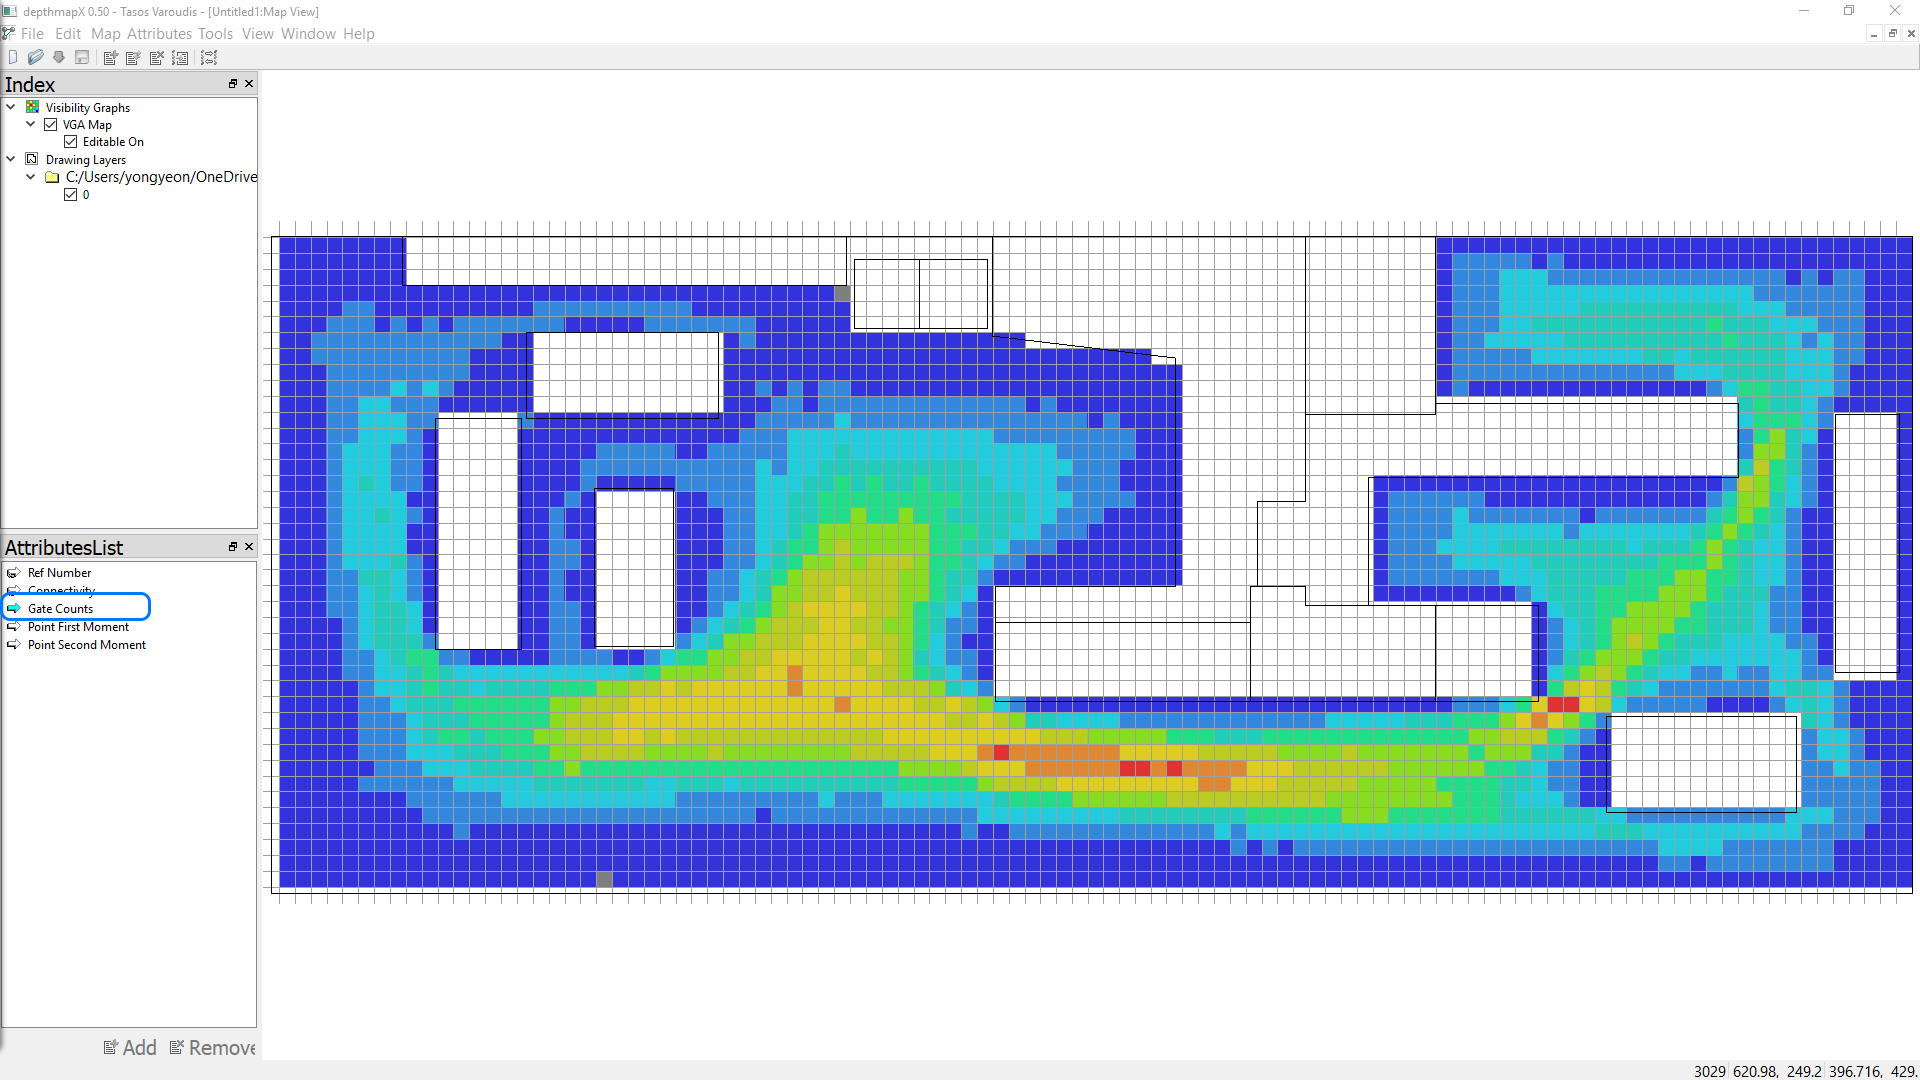
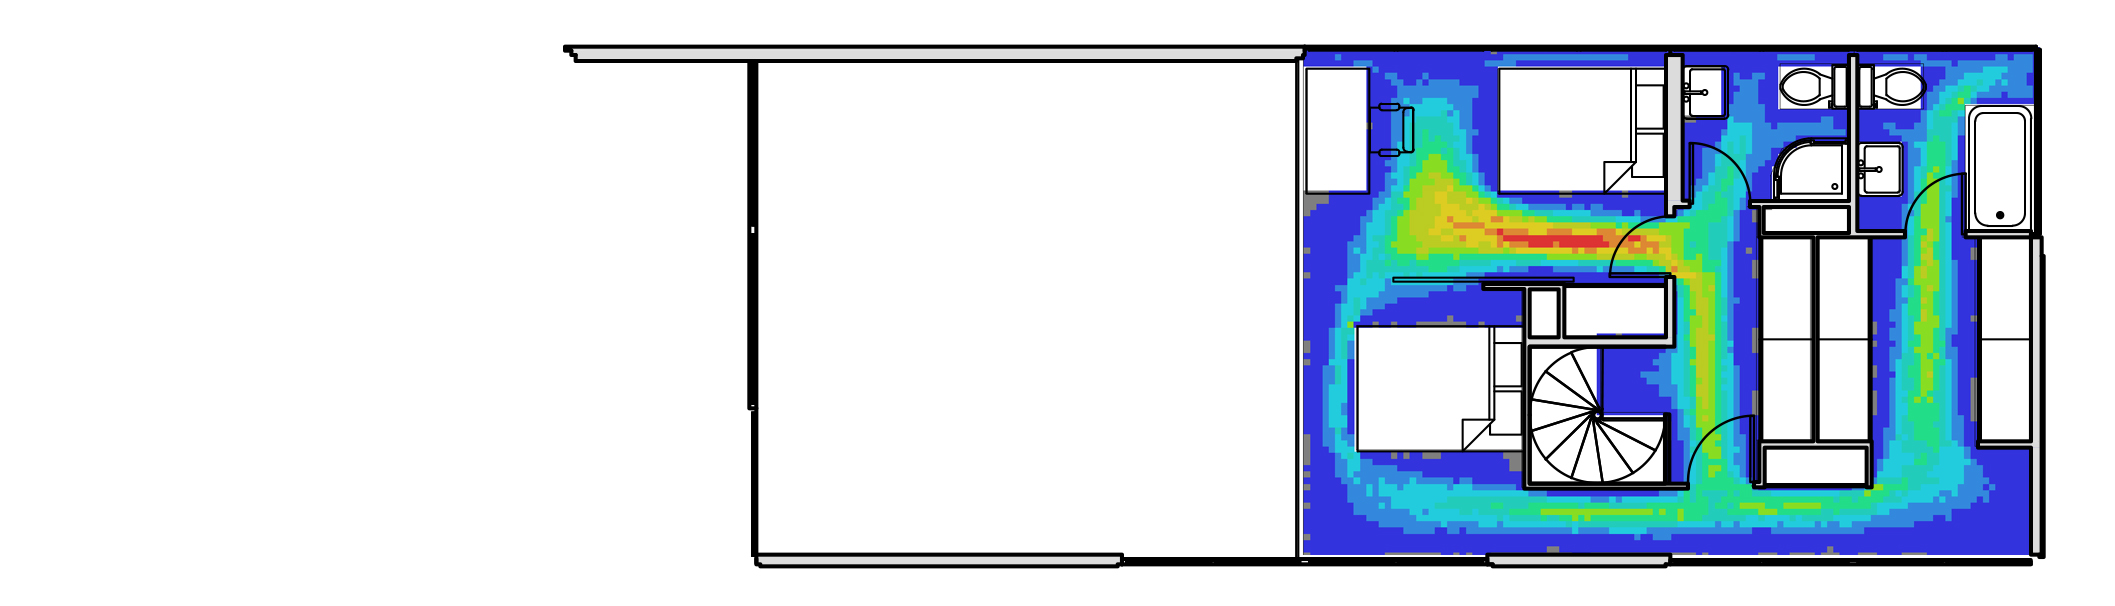
- [STEP 07] In order to get the accessibility diagram, Click [Tool] from the menu > Click [Agent tools] > Click [Run Agent analysis] > Default setting is okay, no change needed. But if you want to try different settings – Movement rule, Analysis length, and checking [Record trails] > Click [OK] > You will get [Gate Counts] result.
- [STEP 08] This is the final result after photoshop.
 References
Dawes, M., & Ostwald, M. J. (2013). Precise locations in space: an alternative approach to space syntax analysis using intersection points. Architecture Research, 3(1), 1-11.
Example of space syntax representation of housing floor – diagram transparent PNG – 850X475 – free download on nicepng. NicePNG.com. (n.d.). Retrieved December 22, 2021, from https://www.nicepng.com/ourpic/u2w7u2i1w7w7y3q8_example-of-space-syntax-representation-of-housing-floor/
Ostwald M.J., Dawes M.J. (2018) Isovists: Spatio-Visual Mathematics in Architecture. In: Sriraman B. (eds) Handbook of the Mathematics of the Arts and Sciences. Springer, Cham. https://doi.org/10.1007/978-3-319-70658-0_5-1
Sailer, K. (2016, February 3). Understanding complex buildings. SlideShare. Retrieved December 22, 2021, from https://www.slideshare.net/kerstinsailer/understanding-complex-buildings
Turner, A; Doxa, M.; O’Sullivan, D.; Penn, A. (2001). From isovists to visibility graphs: a methodology for the analysis of architectural space. Environment and Planning B. 28 (1): 103–121. doi:10.1068/b2684.
UCL Space Syntax. (n.d.). DepthMapX. Space Syntax. Retrieved December 22, 2021, from https://www.spacesyntax.online/software-and-manuals/depthmap/
Wikimedia Foundation. (2021, March 26). Space syntax. Wikipedia. Retrieved December 22, 2021, from https://en.wikipedia.org/wiki/Space_syntax
